Firstly, here is my solar setup on my Toyota 4Runner:
1 - Victron MPPT 100/20 charge controller (firmware 1.59) with 2, 12V cigarette lighter connections to the “Load Output”. The MPPT is networked to a Victron SmartShunt
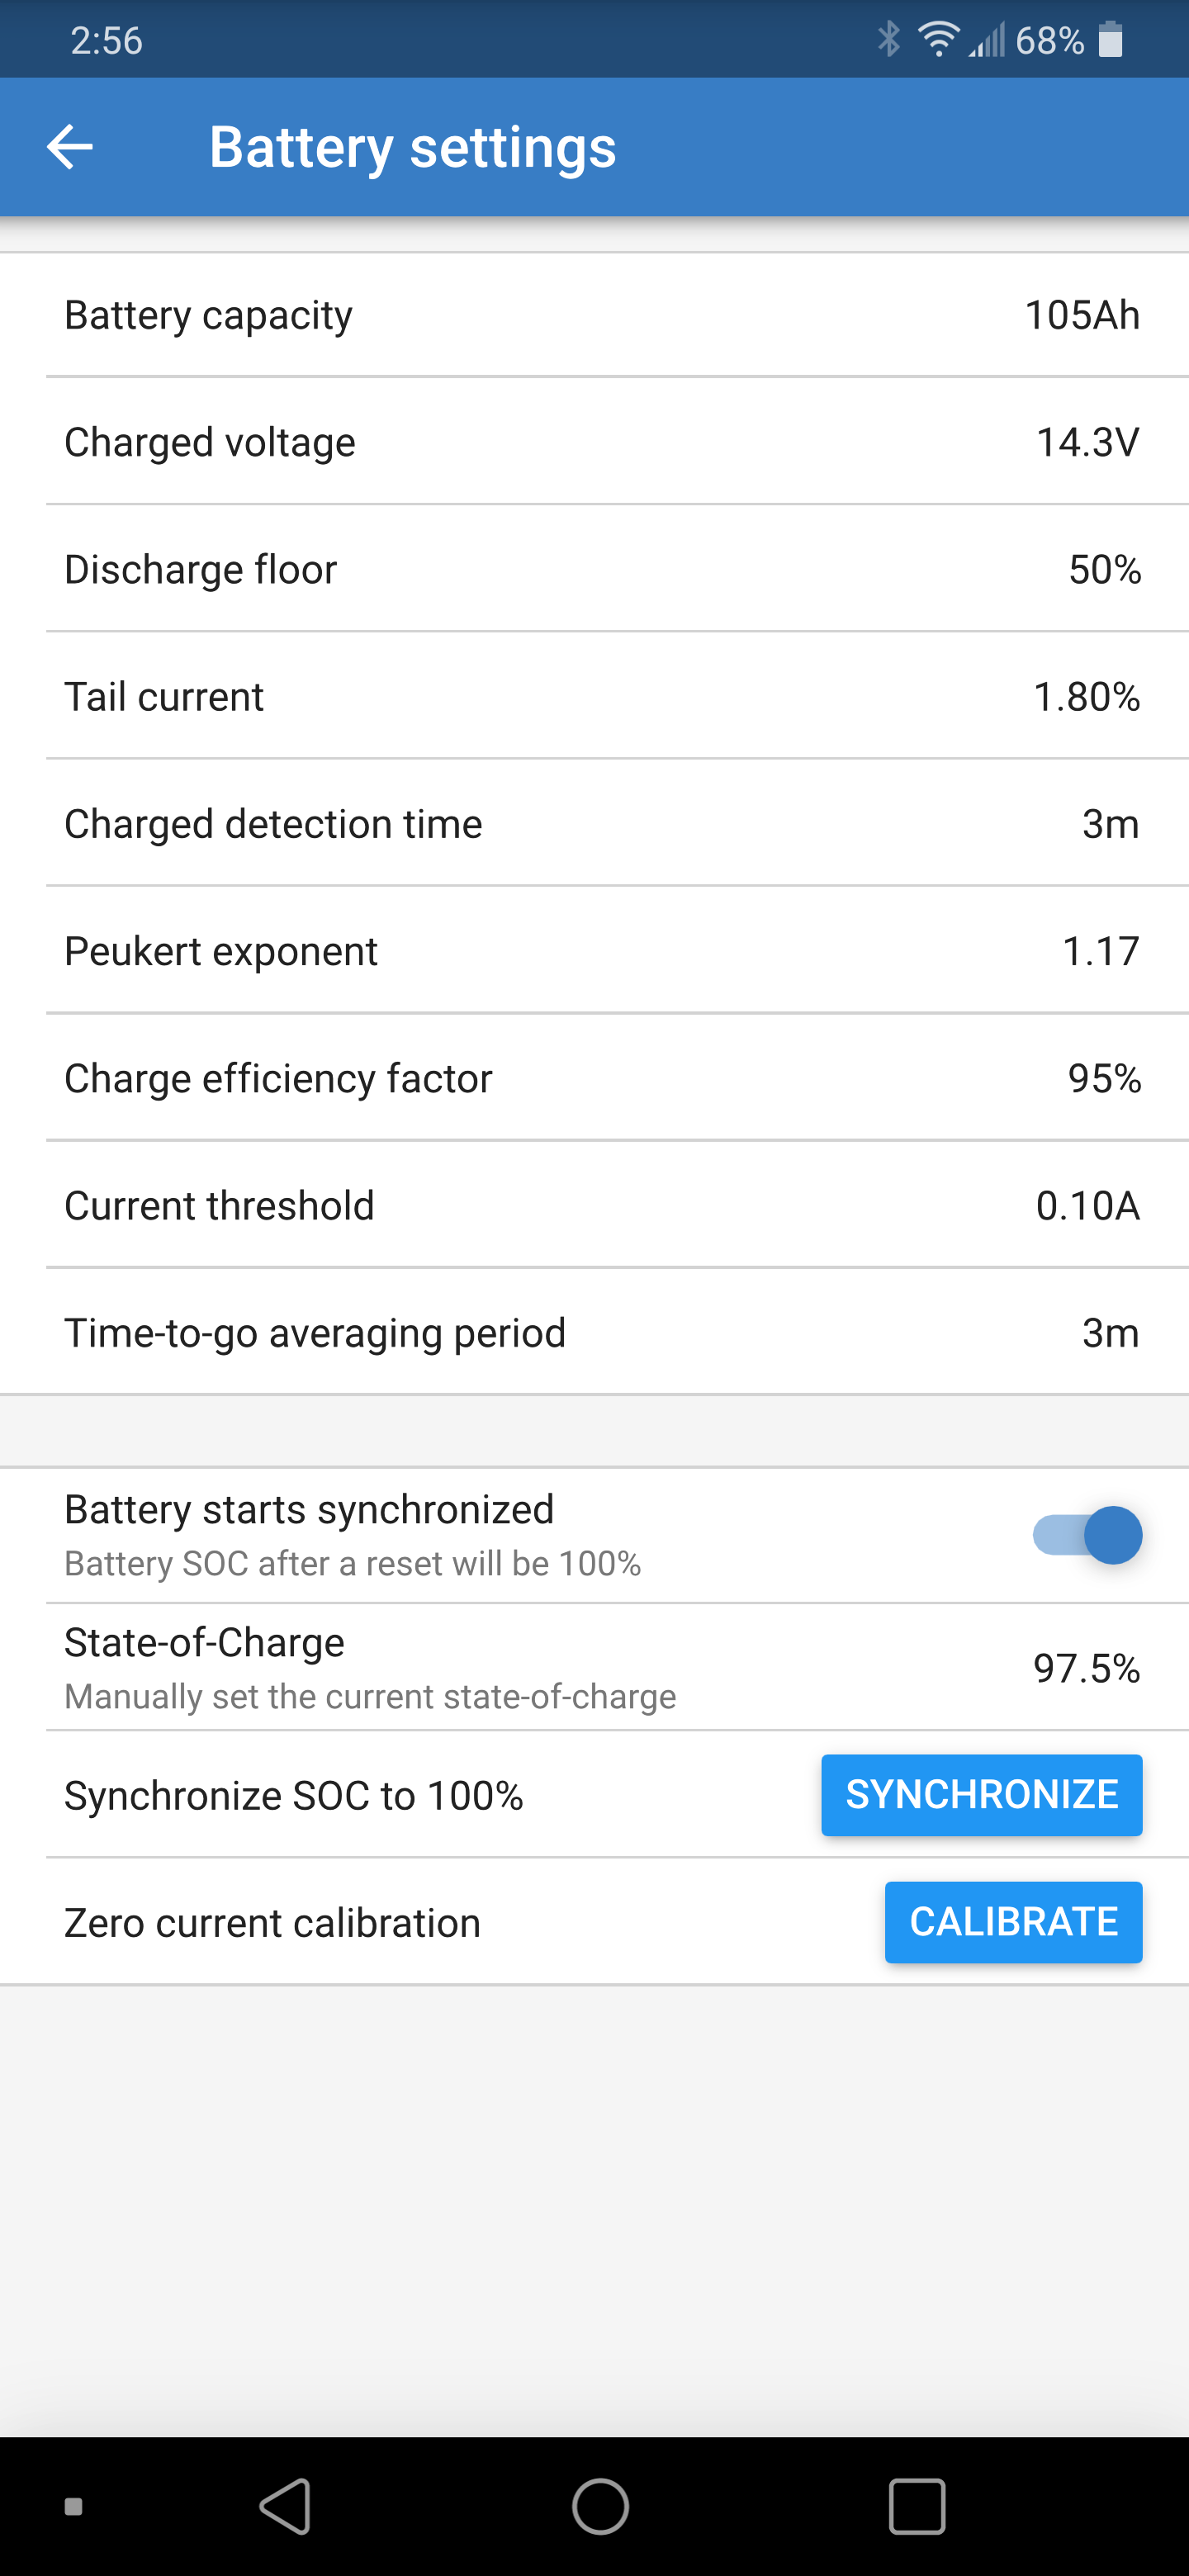
1 - Victron SmartShunt 500 amp (firmware 4.08), networked to MPPT to provide battery voltage and temperature
1 – Renogy Eclipse 100W solar panel permanently mounted onto my roof, specs: Open-Circuit Voltage (Voc): 21.2V, Short-Circuit Current (Isc): 6.10A, Optimum Operating Voltage (Vmp): 17.7V, Optimum Operating Current (Imp): 5.70A
1 – 20 amp inline fuse at the solar panel
1 – FullRiver Battery, 105 amp hour, AGM battery
1 – Dual dash camera that is powered/wired directly to the AGM battery (it does not connect to the Load Output of the MPPT), which draws 360 mA or 0.36 amps. It’s constantly on, in “parking mode”.
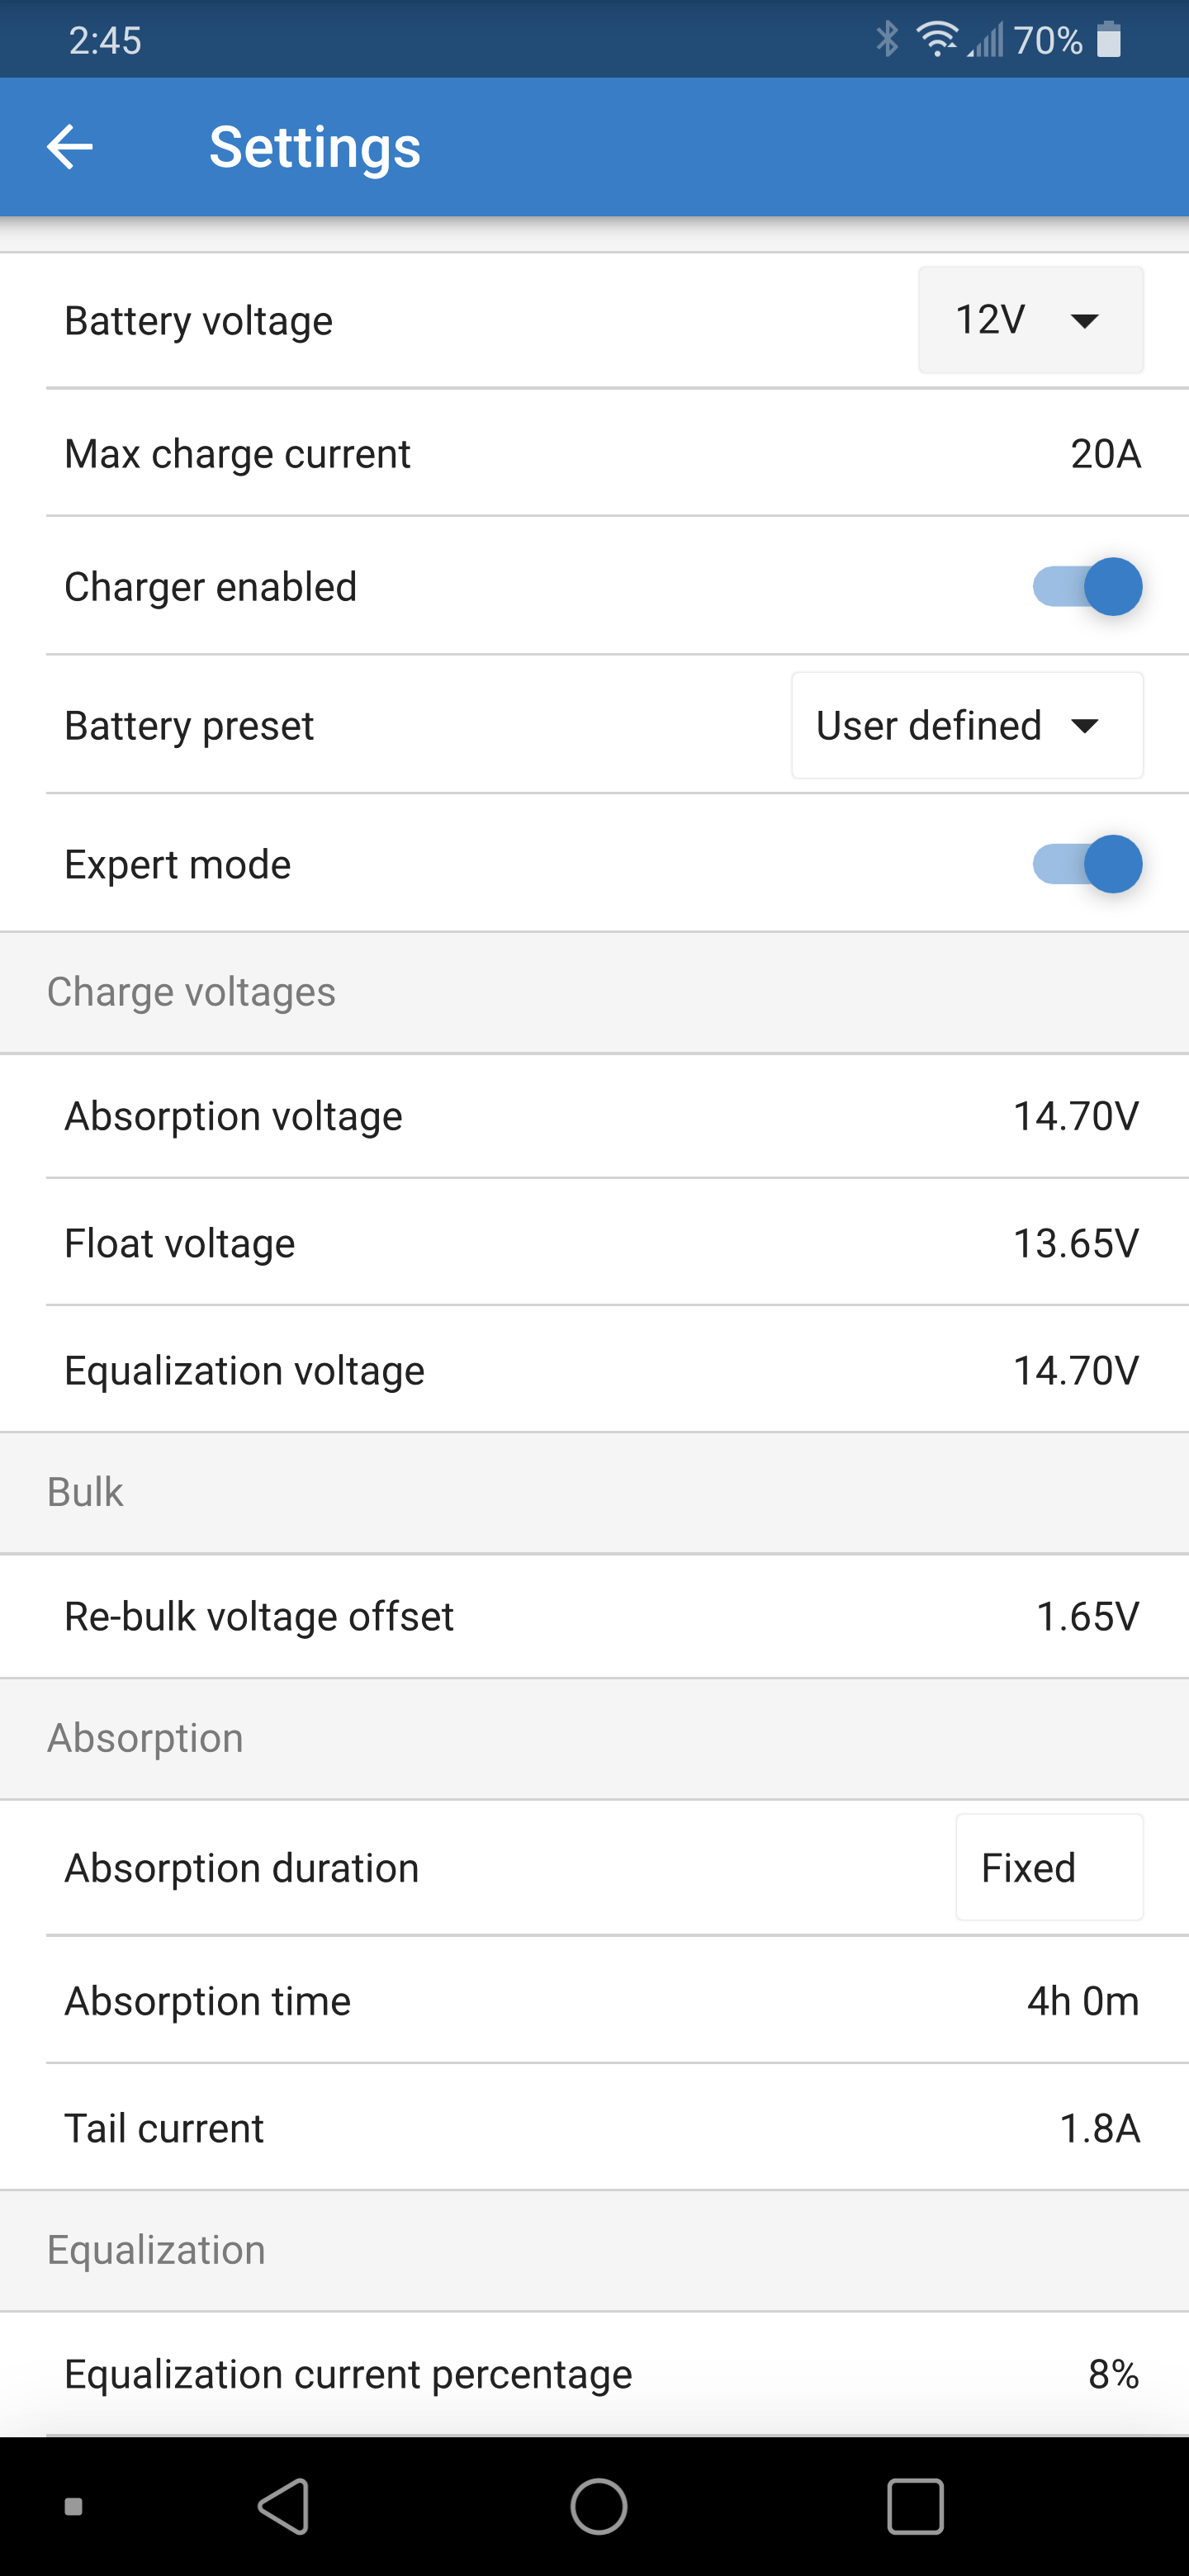
I have used the “user defined” and “advanced settings” for the battery charging parameters in the MPPT, following FullRiver’s charging parameters perfectly.
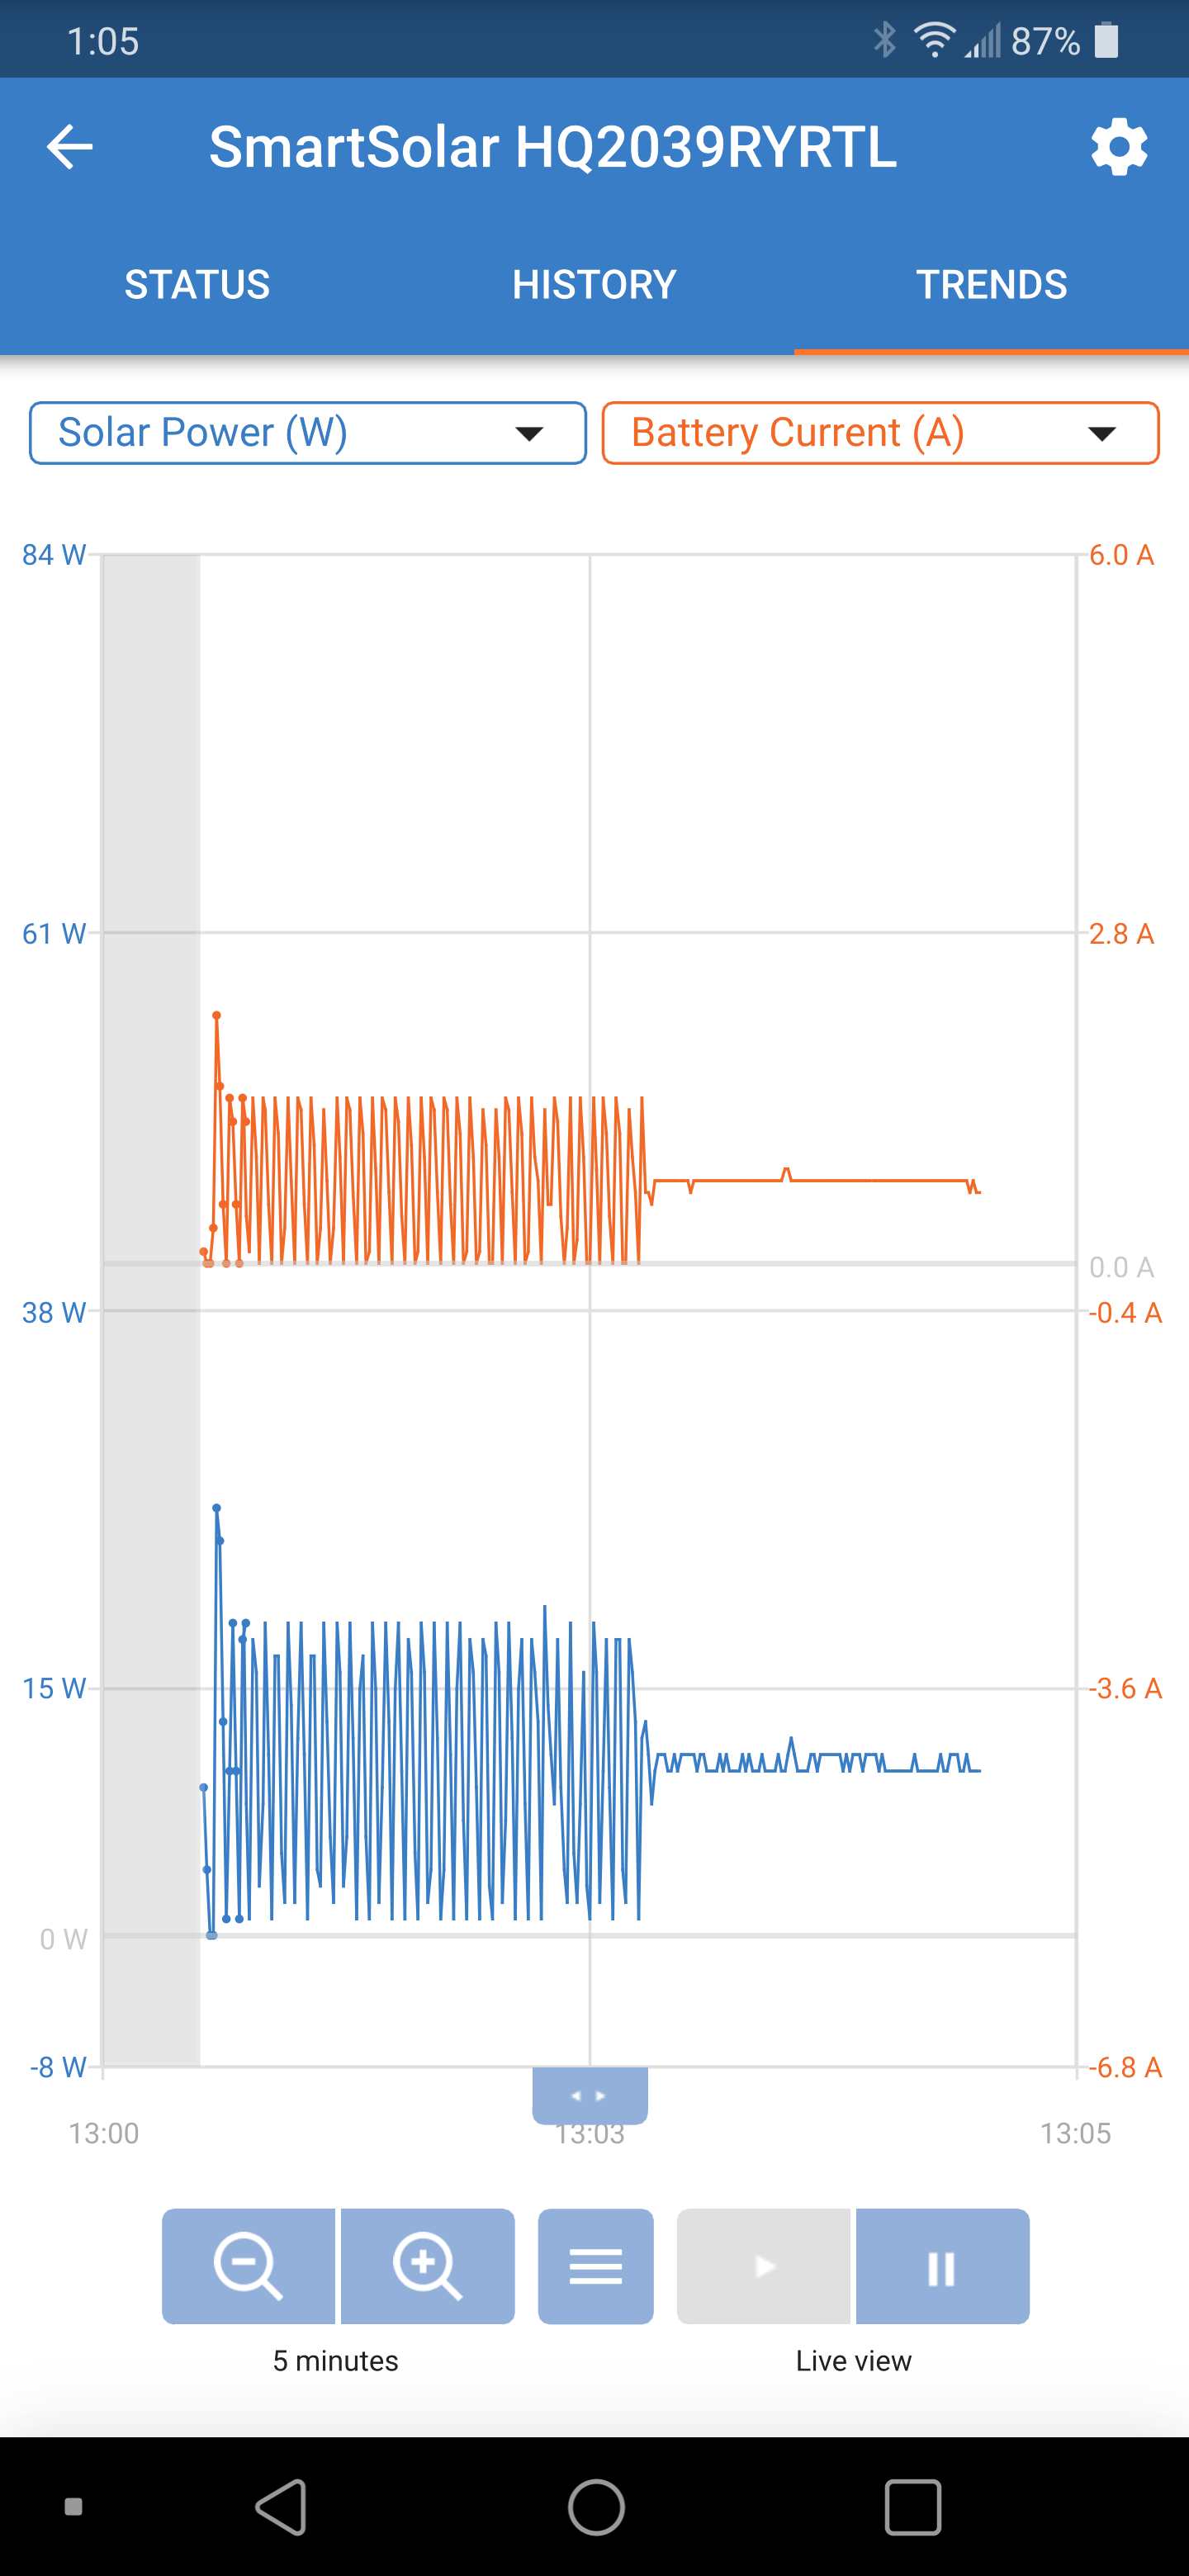
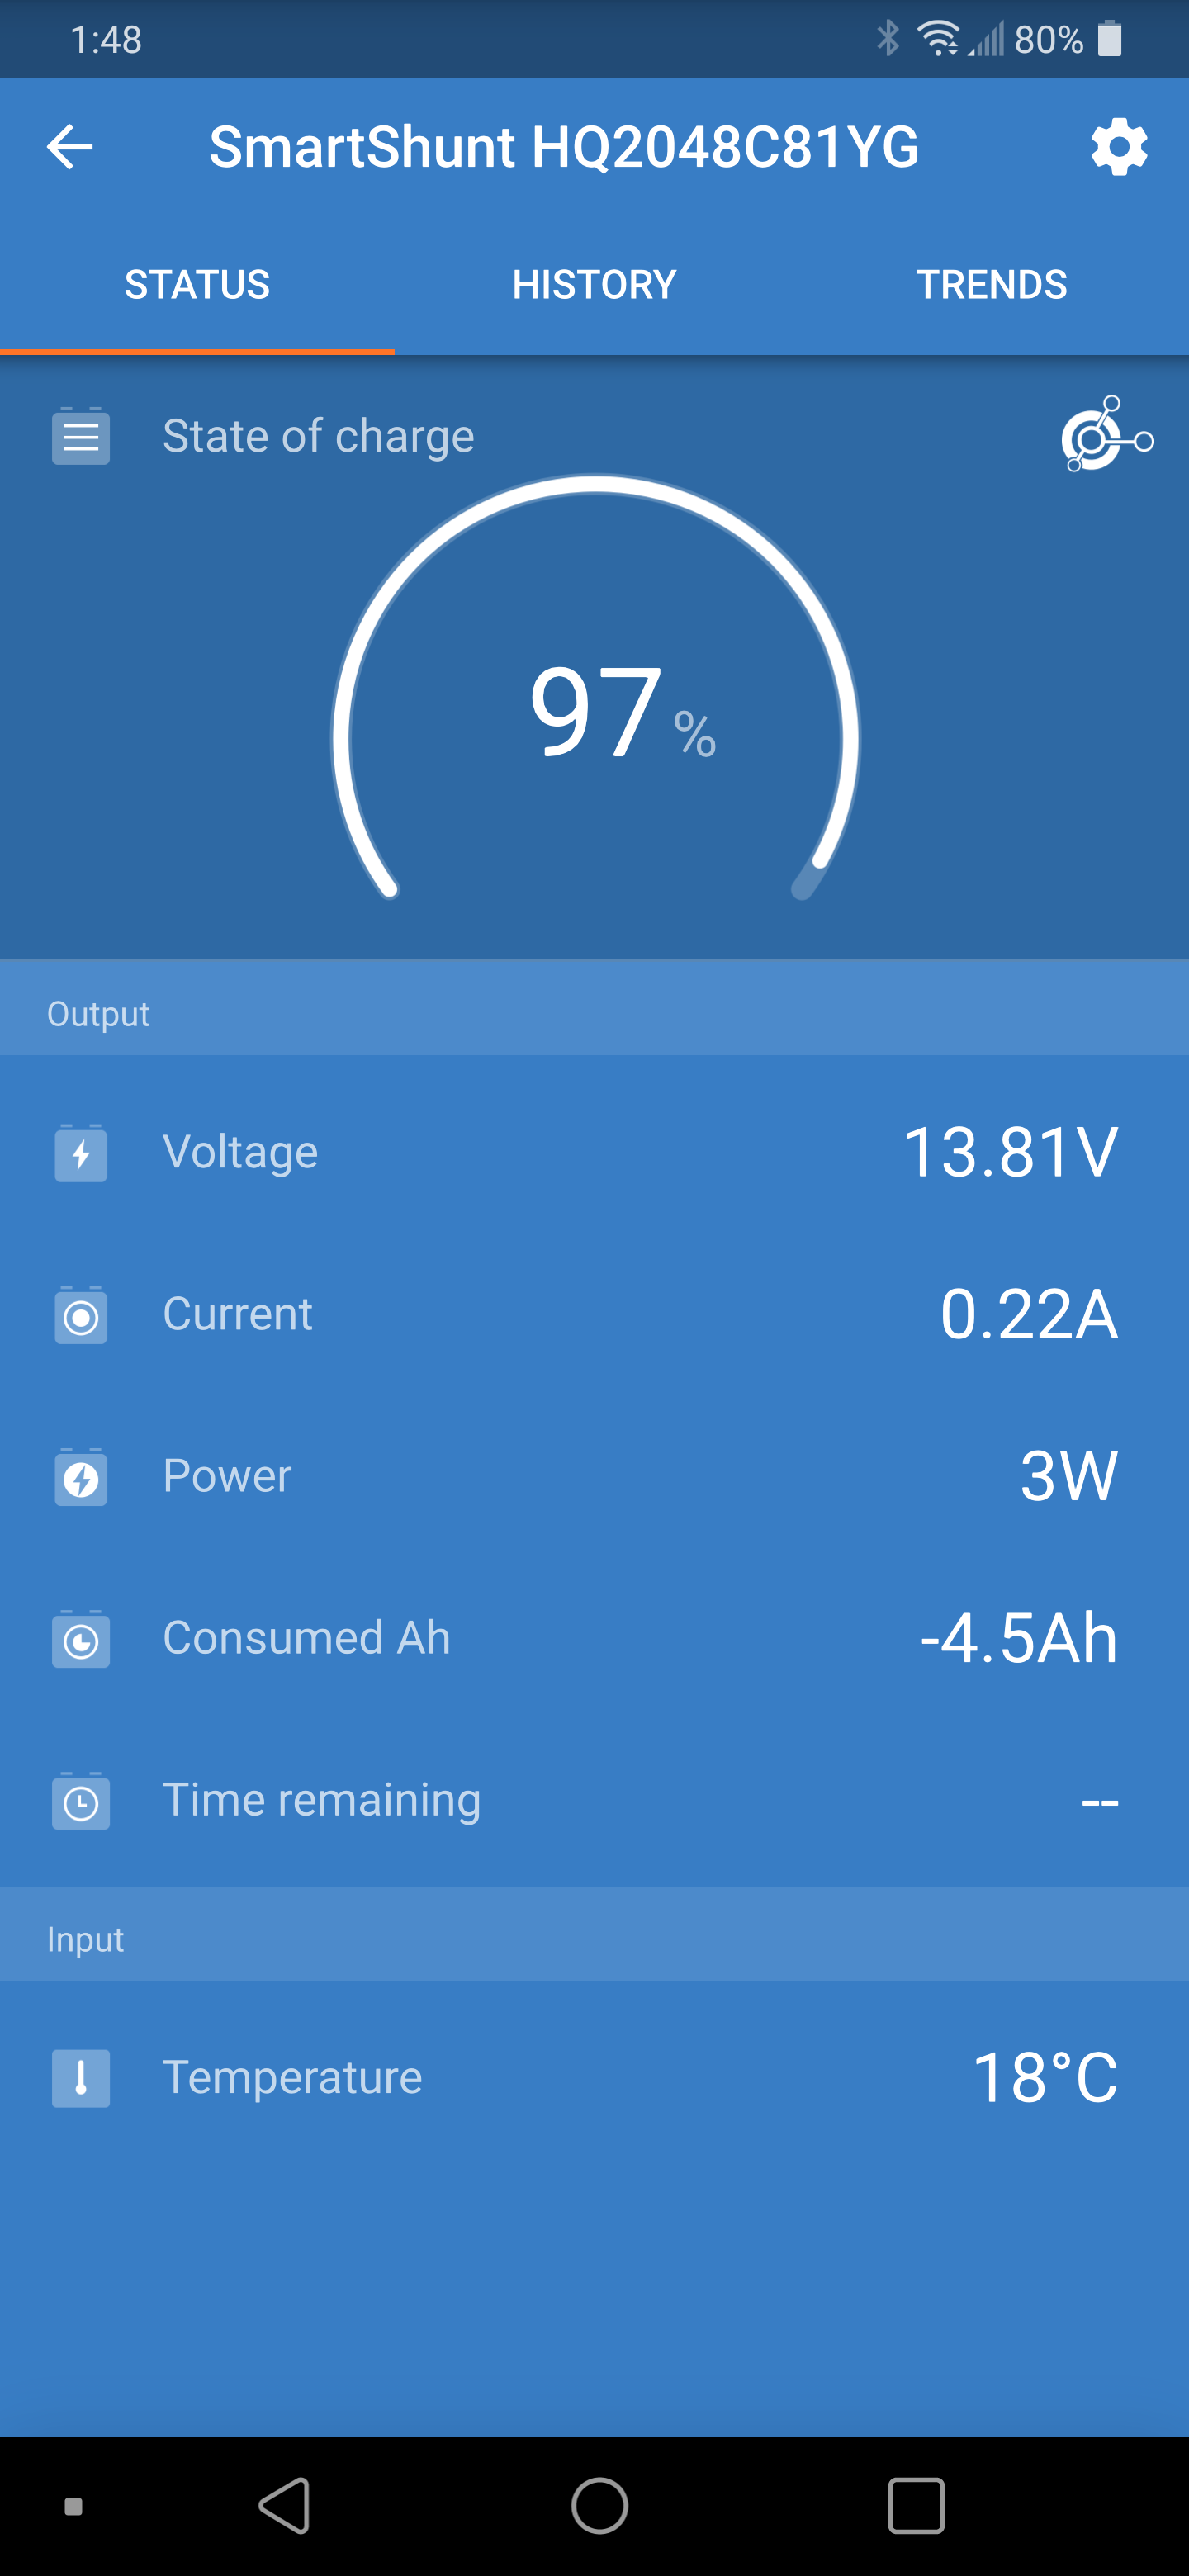
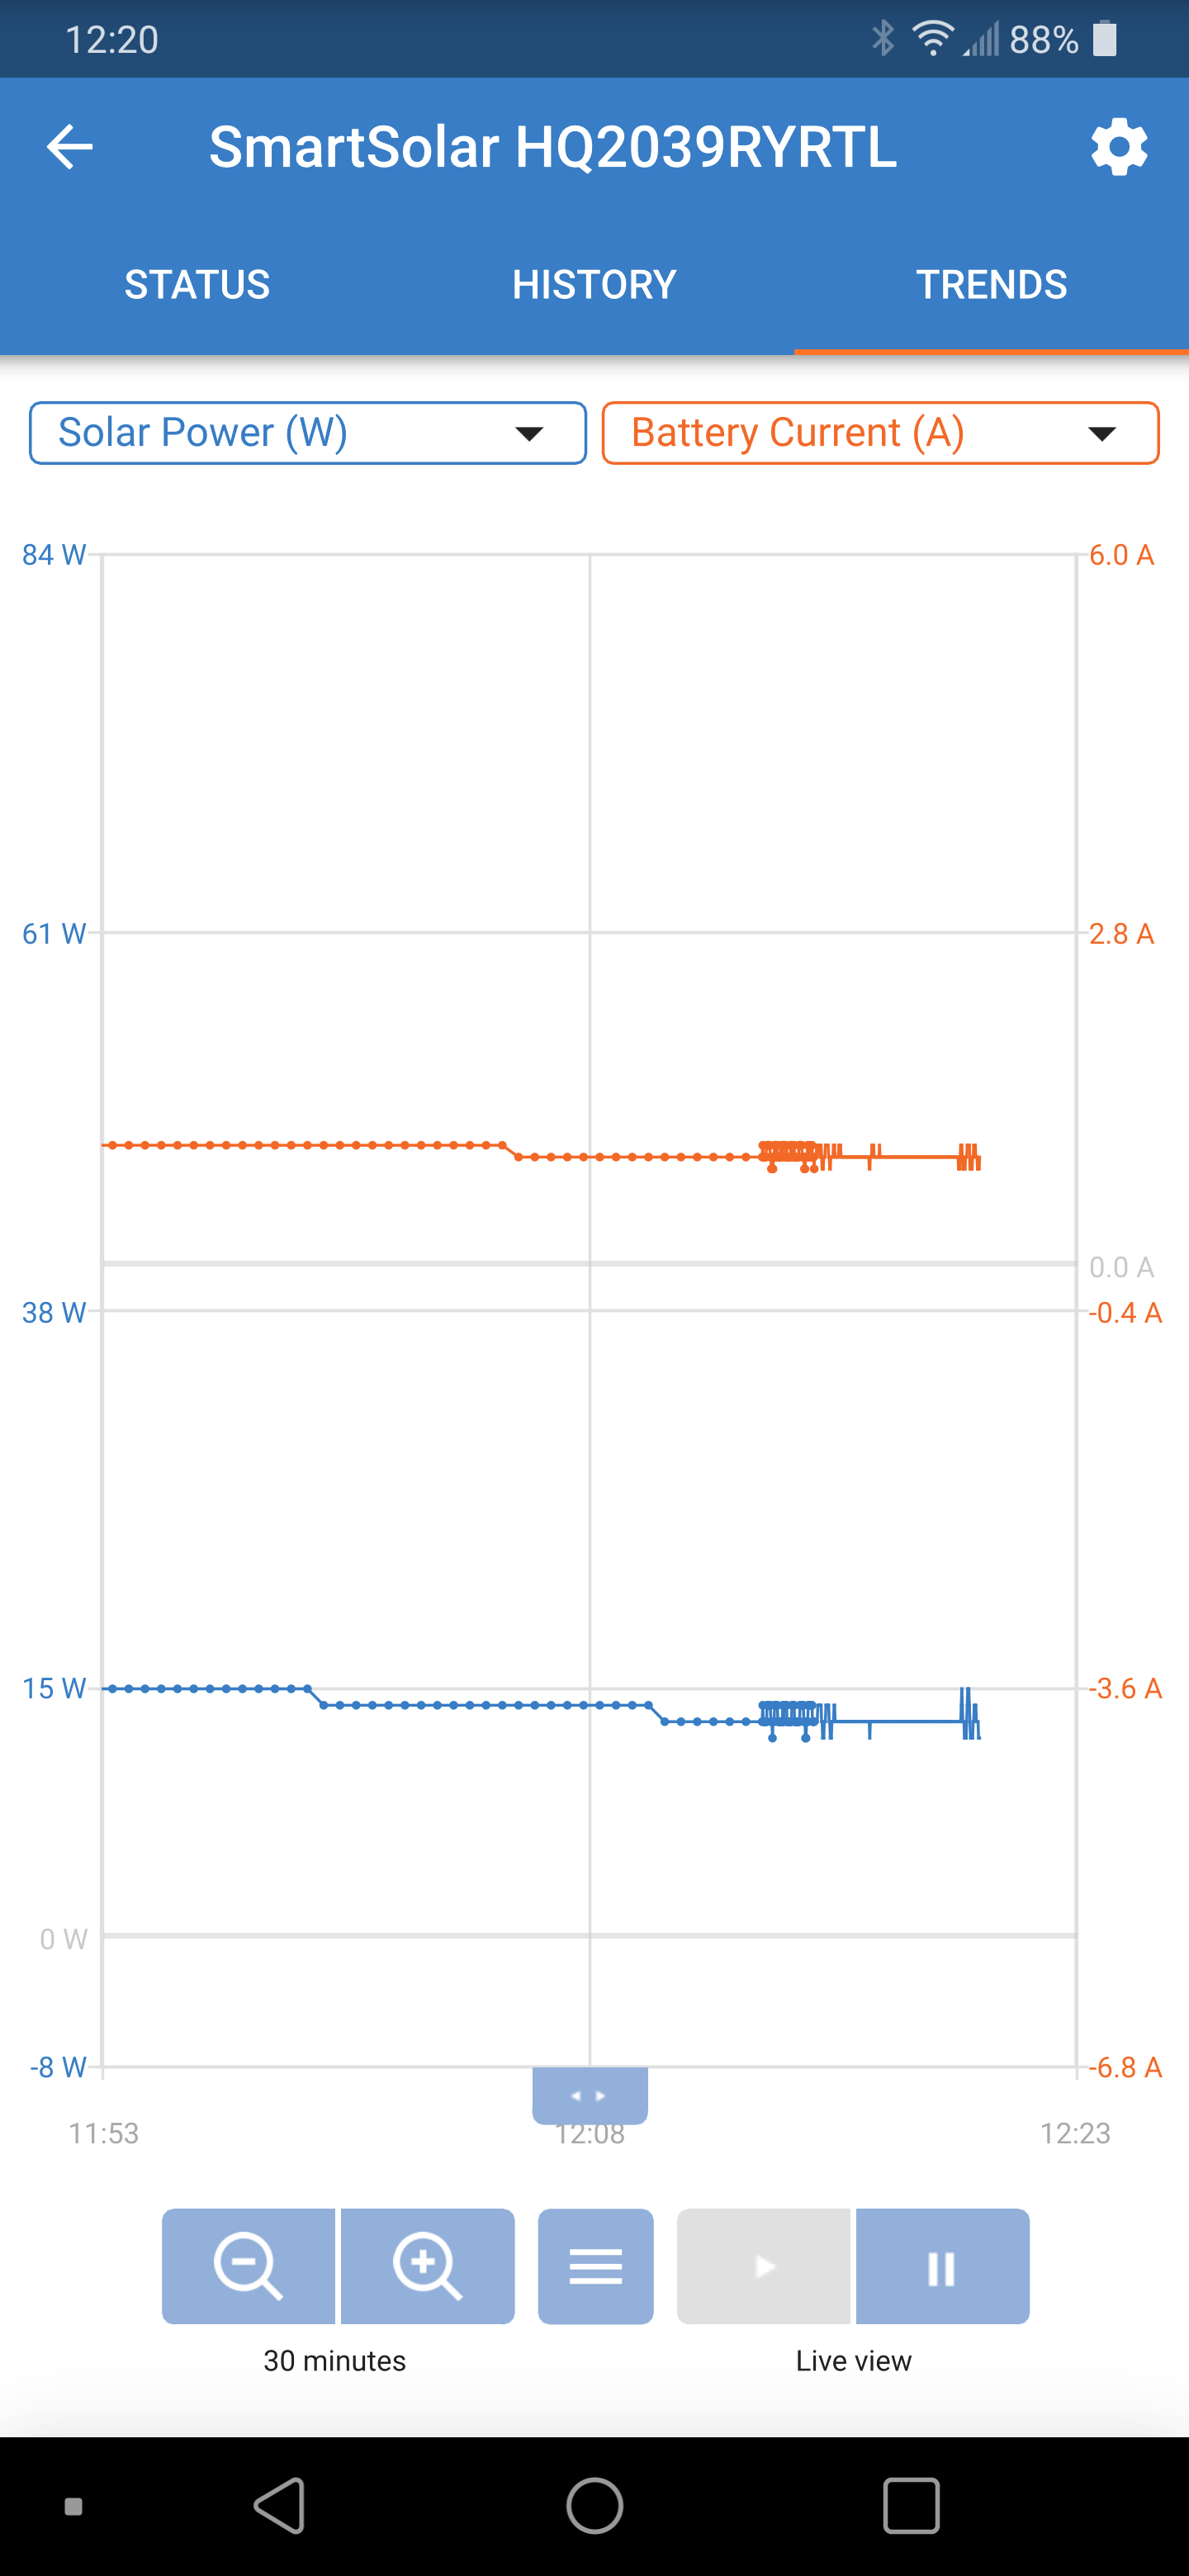
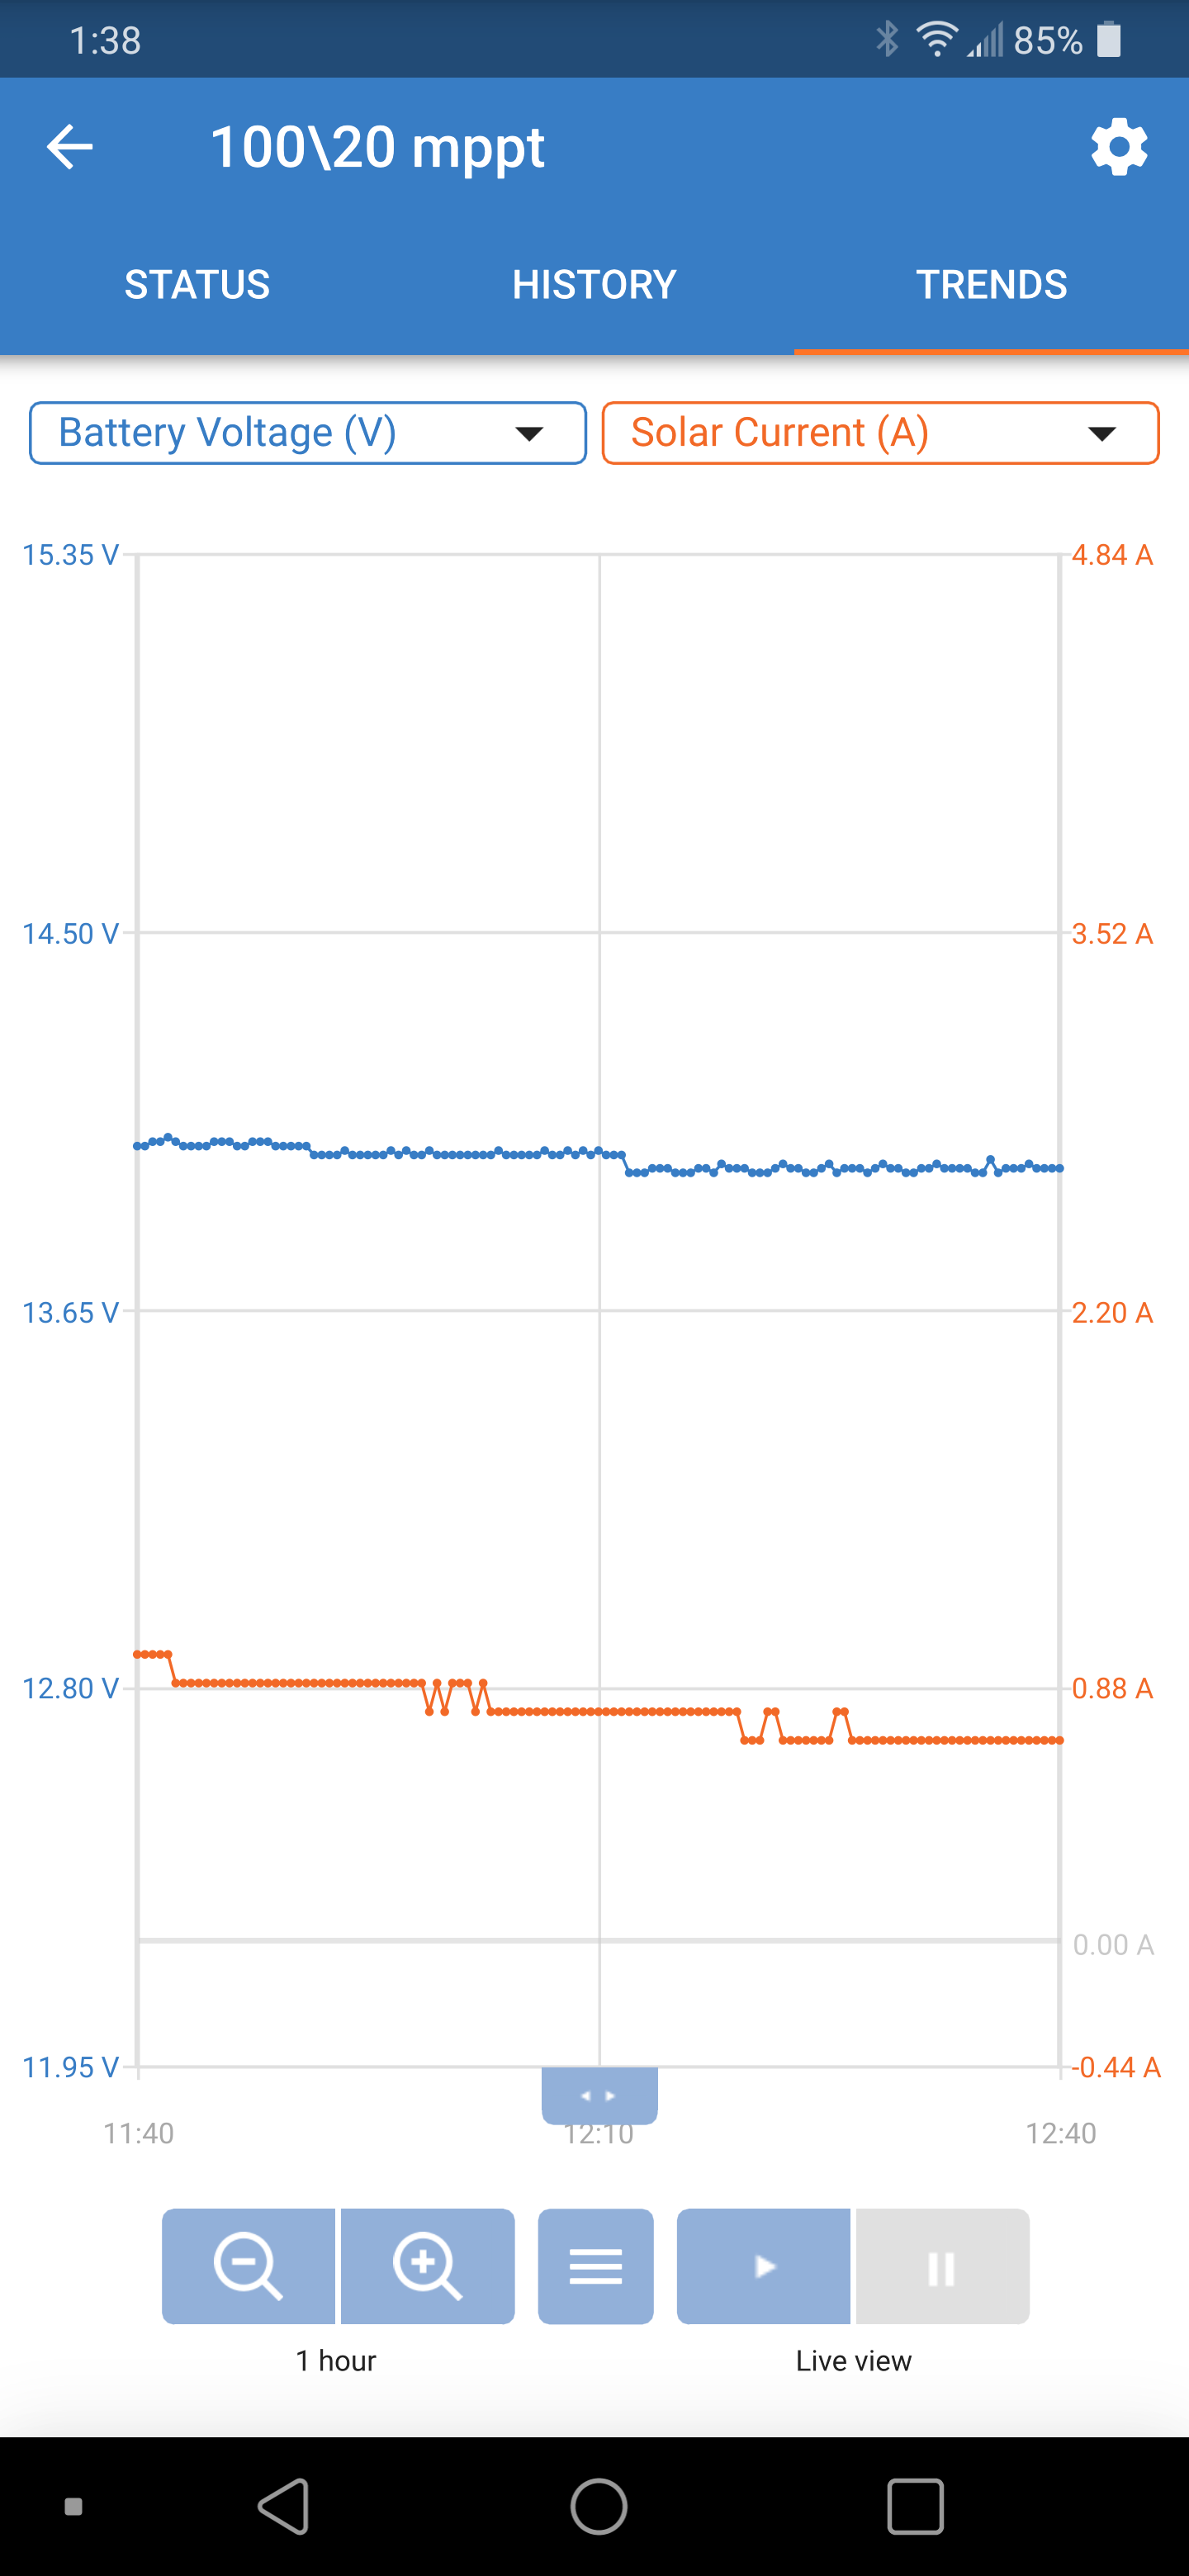
Now here is the issue which is sporadic and very puzzling. When in direct sunlight, without any draw from the Load Output (i.e. my fridge is unplugged/off), but a small 0.36 amp draw from the dash camera directly connected to the battery, the MPPT will go through its proper cycle of “bulk”, “absorption” and then “float” charging. I’ve noticed that randomly during the float charge, it will go from 15/16/17/18 watts, down to 1/2/0, then back up within 1-2 seconds. Also the amps will fluctuate 0.5 – 1.2 down to 0. Of course the battery voltage will jump (slightly) up and down during this time. The SmartShunt is reading at a 97% state of charge. Then after some time, the MPPT will settle in, with a steady (maybe fluctuate 1 or 2 watts) watt and amp input. But then goes back into the fluctuations.
When I connect a draw to the Load Output, i.e. turn on my fridge (draws between 35 – 45 watts), the MPPT will automatically compensate for the draw and aim to maintain the float voltage on the battery. At no time does the wattage or amperage have the dramatic fluctuation down to 0 like I mentioned above.
I’ve checked all the connections with a multimeter. Tightened down all the connections to the battery, MPPT, etc. My wiring from the solar panel to the MPPT is 10 gauge (only 16 feet in length total). The wiring from the MPPT to the battery is 8 gauge.
As per Renogy’s solar panel troubleshooting steps, I performed an open circuit voltage test, with it passing – needs to be within 10% of Voc; I measured 20.4V at the panel connections vs. the panel’s Open-Circuit Voltage (Voc): 21.2V. I then performed a short circuit current test, with it passing too – needs to read 50% of the spec sheet number or greater; I measured 4.6 amps with the panel’s Short-Circuit Current (Isc) being 6.10 amps. Therefore the panel is okay. I also cleaned the panel with water and paper towel to ensure it was clean.
I’ve also “disabled the charger” for several minutes, then turned it back on, letting it go through the charge cycle. After a few minutes in float charge, it goes back to the fluctuations.
I have no idea what’s causing this. Can someone please provide some guidance as I’ve done all the appropriate troubleshooting that I’m aware of?
I’ve attached screenshots from the MPPT charging parameters and history, as well as the SmartShunt.
Thank-you.
MPPT history with fluctuations.png