I released some major changes to GuiMods today. In no particular order:
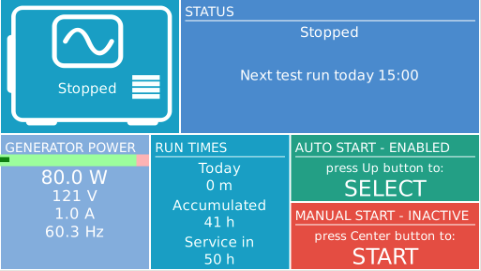
- revise Generator overview & add auto run enable/disable button
- add generator service interval and countdown on generator overview
- incorporate GeneratorConnector code in GuiMods - GeneratorConnector now obsolete
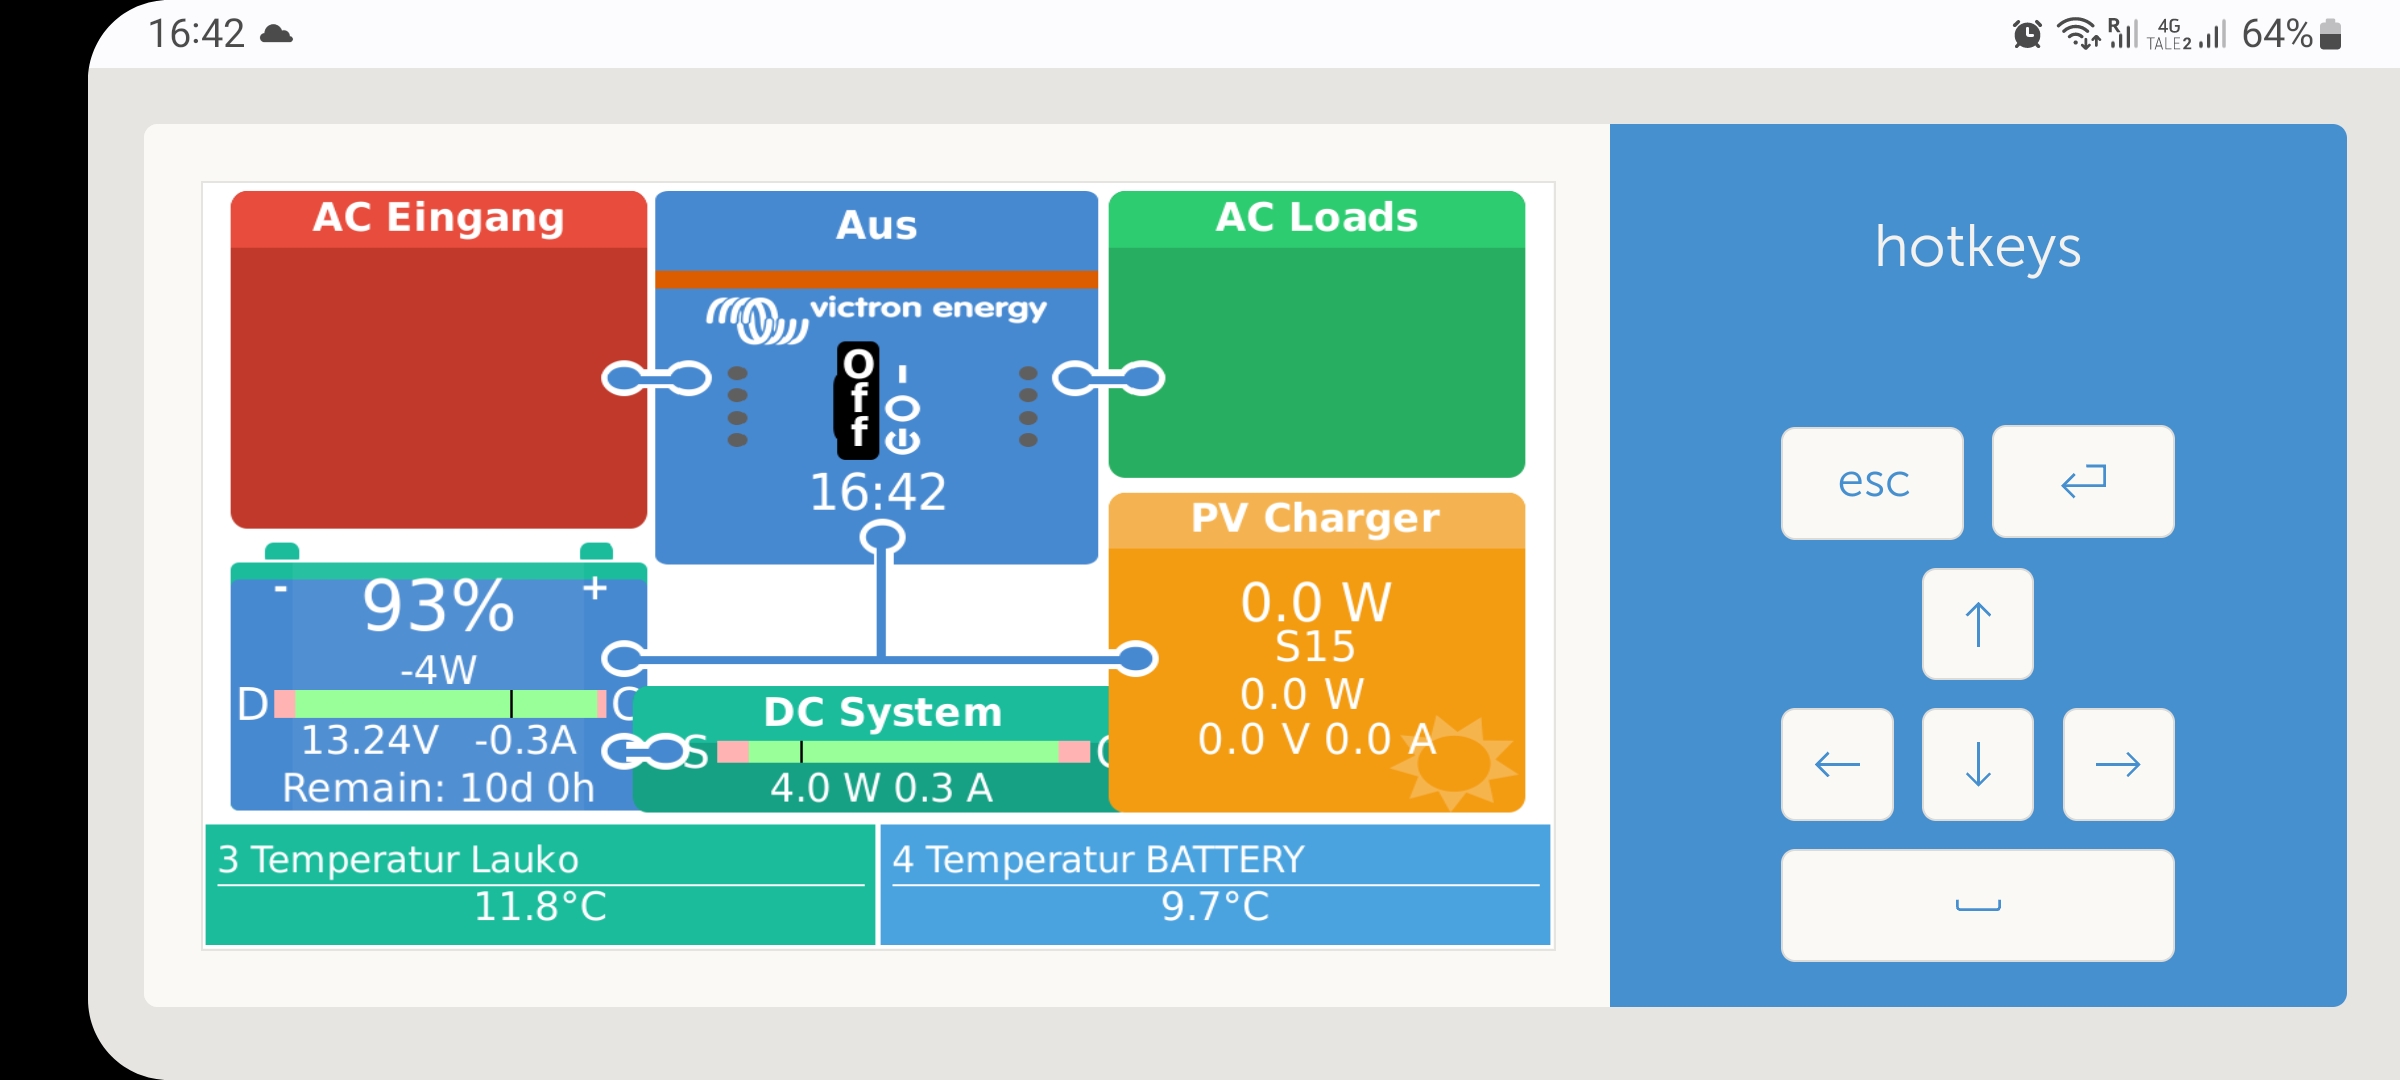
- revised "simple" flow overview
- revised "grid parallel" flow overview, now called "AC Coupled"
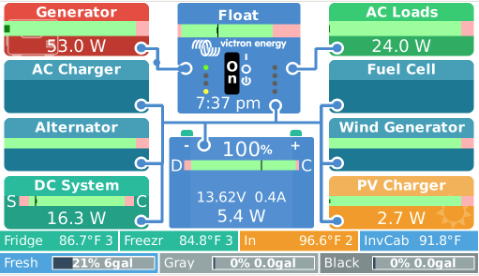
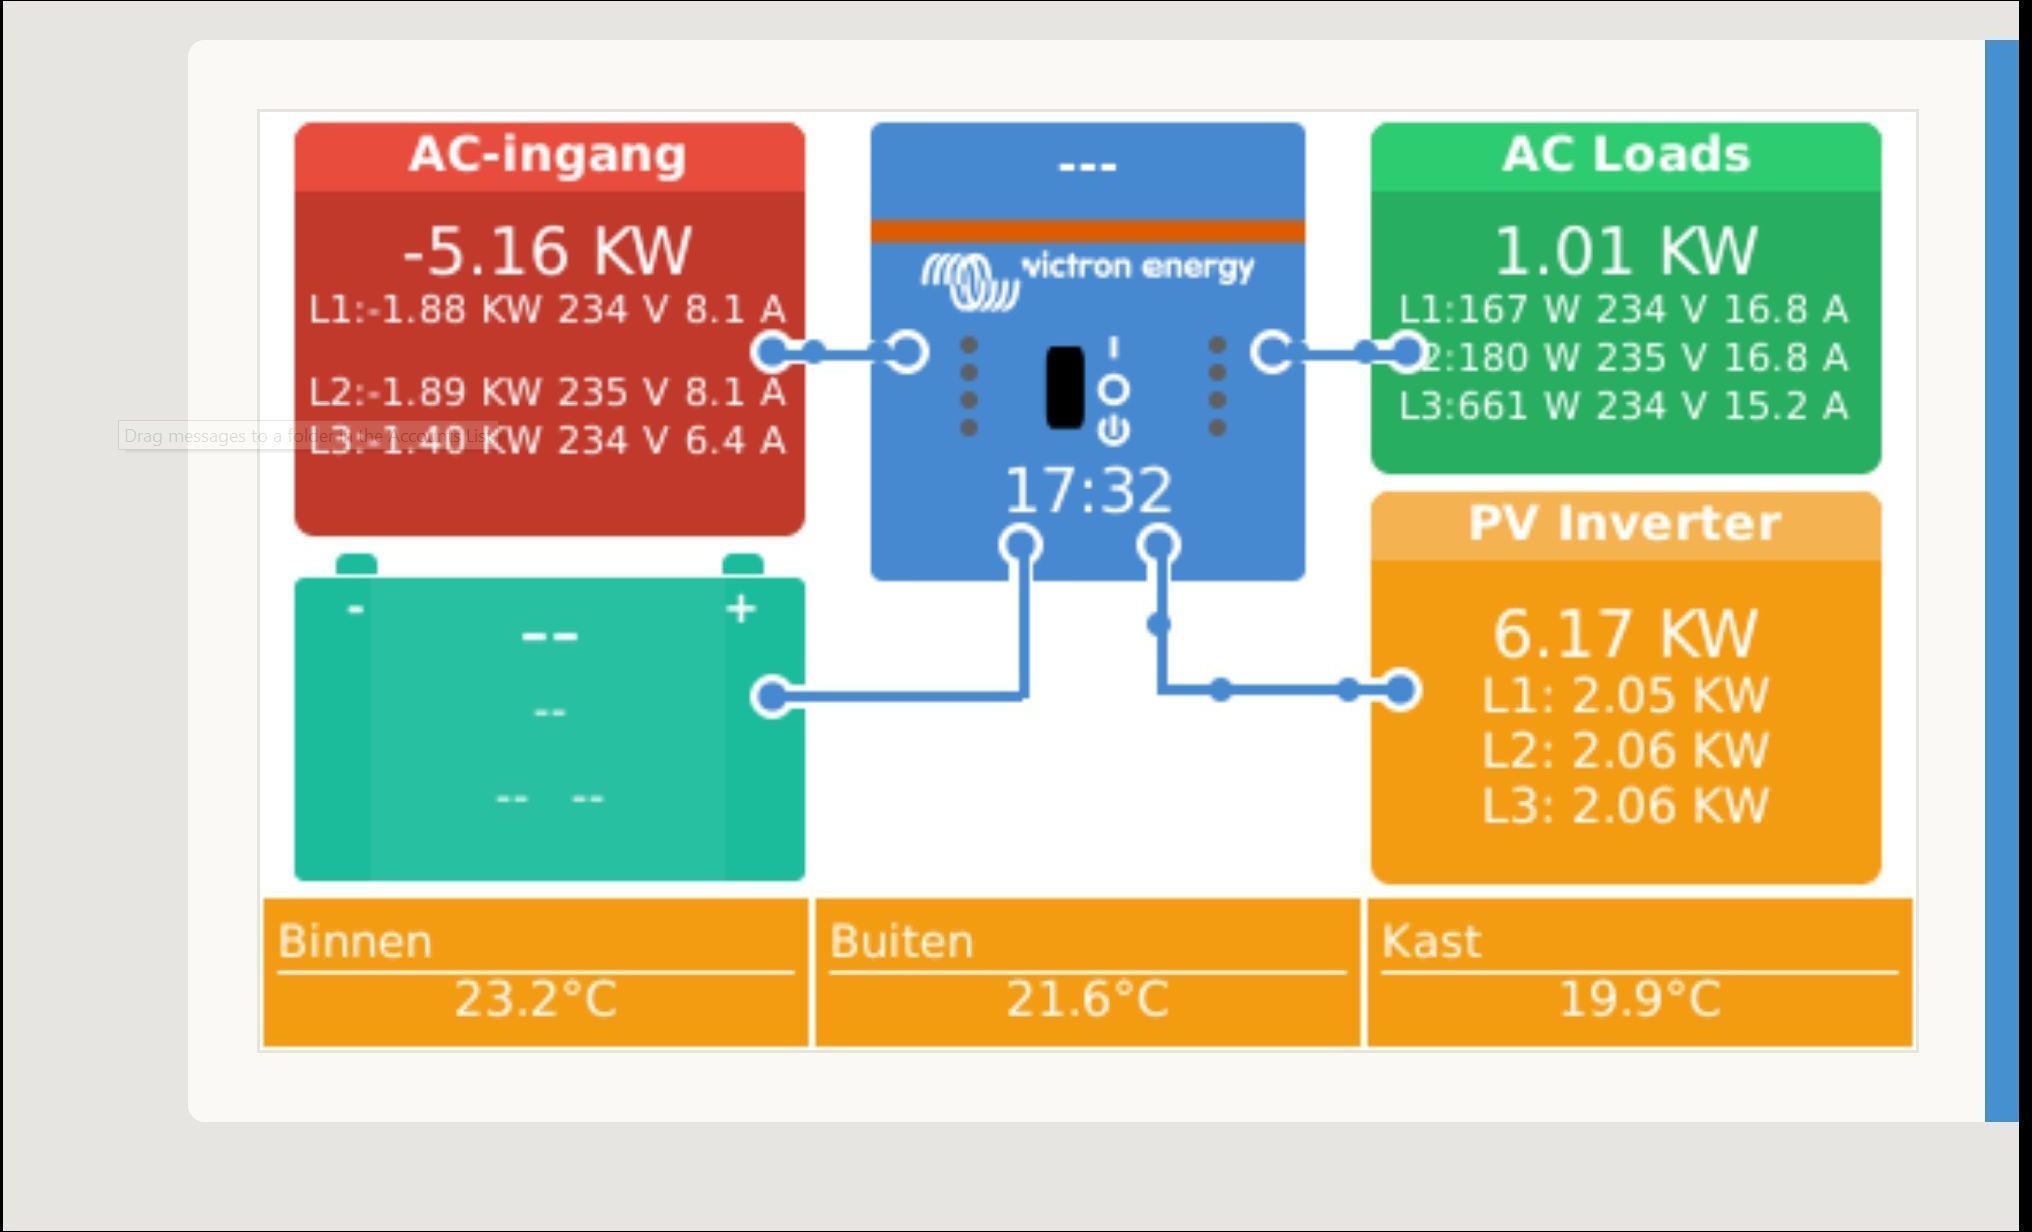
- added DC Coupled flow overview - shows more DC devices than previous pages
- add alternator, AC charger and wind generator DC sources
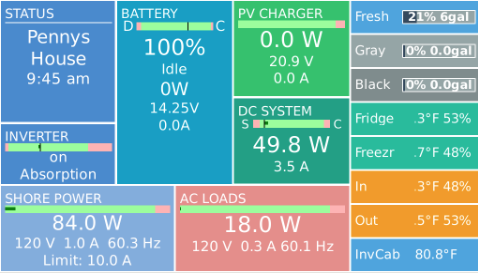
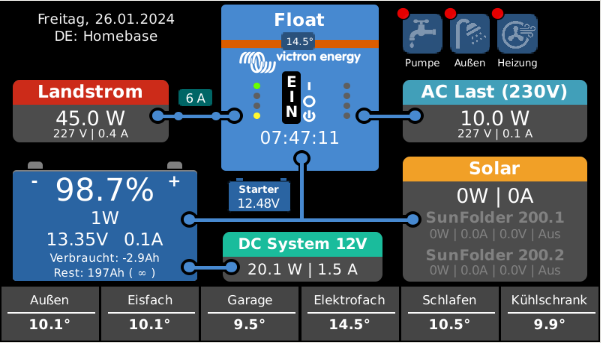
- added gauges to mobile overview and generator overview
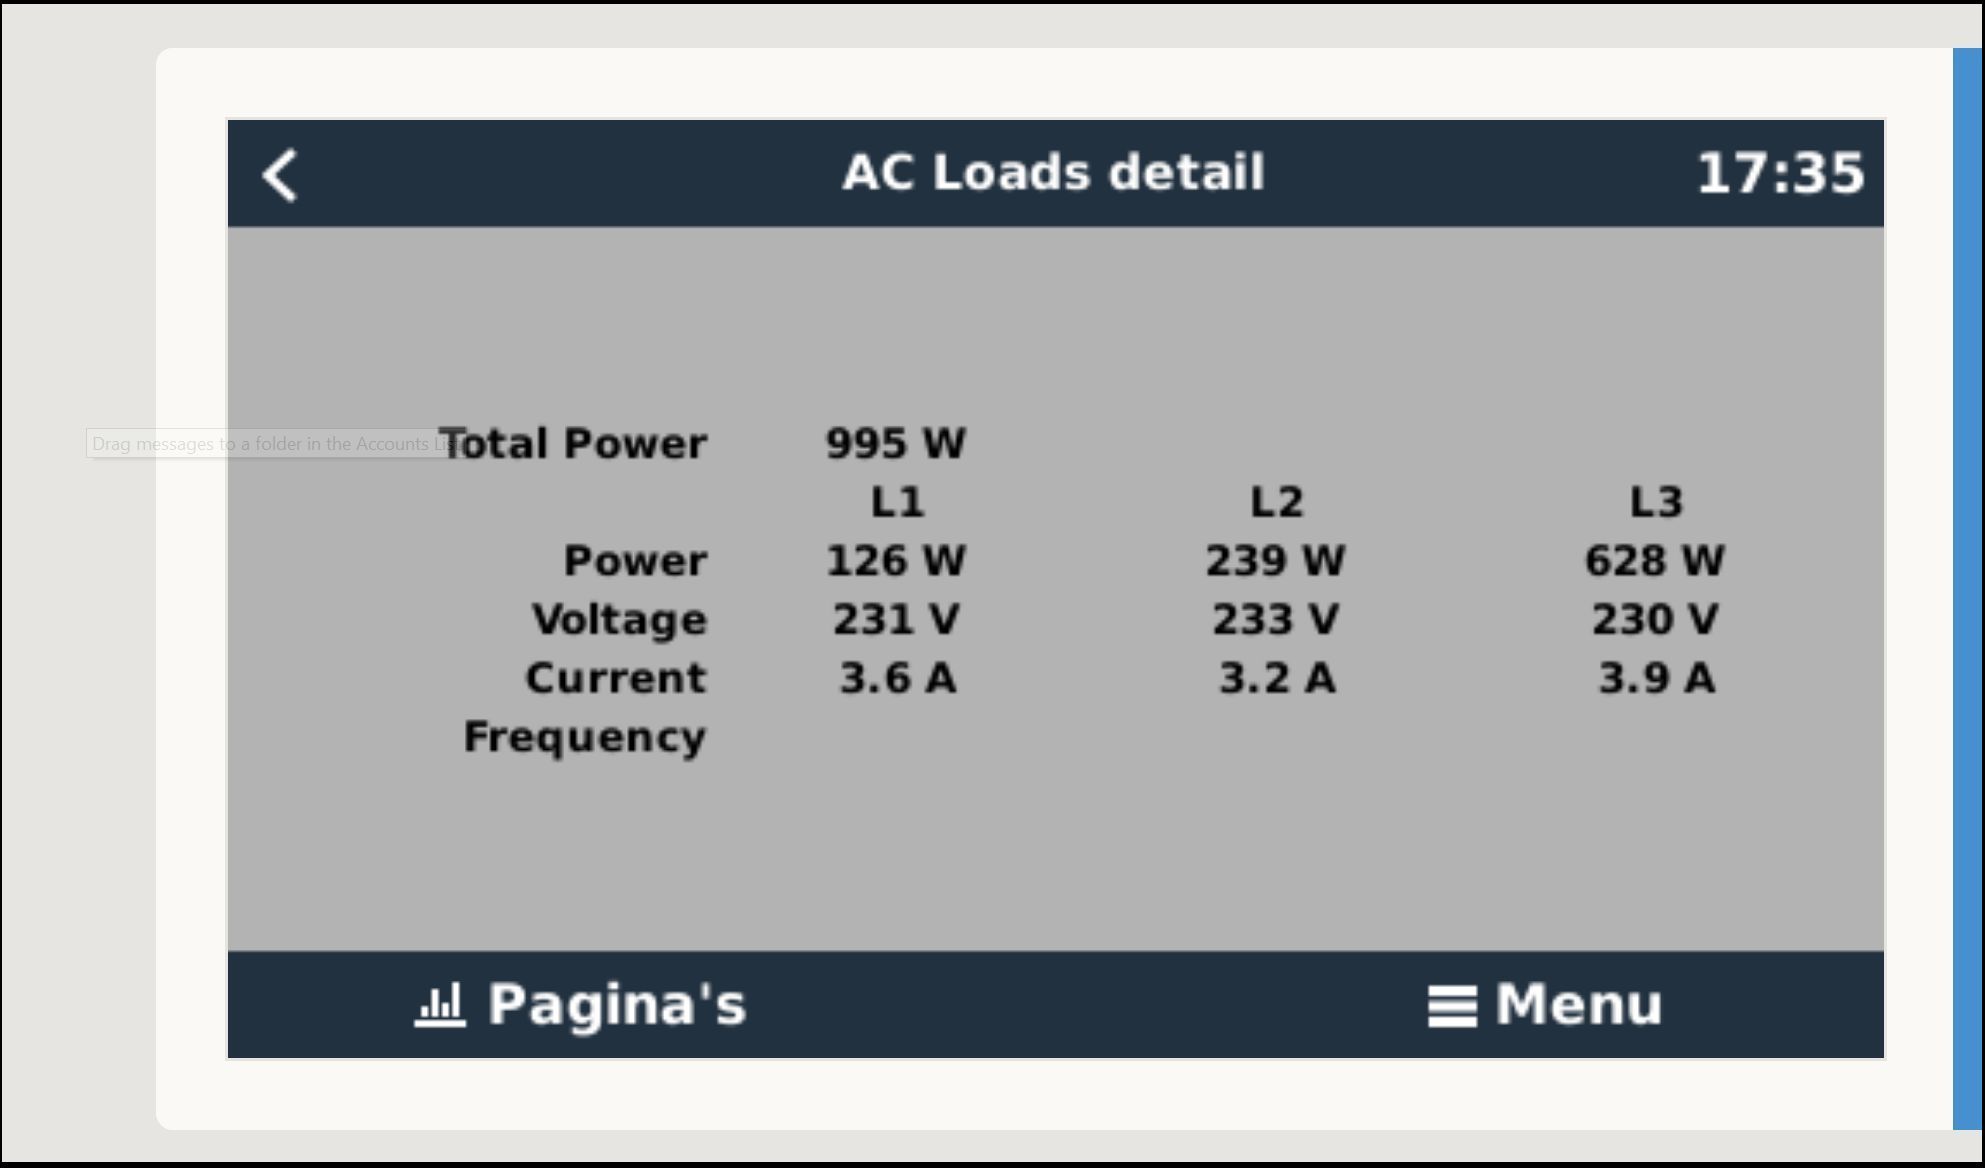
- add details page access from mobile overview
- current limit and inverter mode buttons removed/replaced with details pages
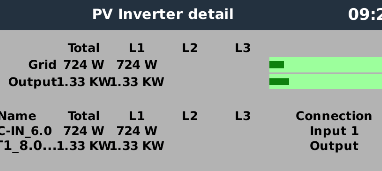
- DC system detail added: shows DC system devices
- as well as other devices not shown on the flow overview
- added detail acces via the CCGX hard buttons
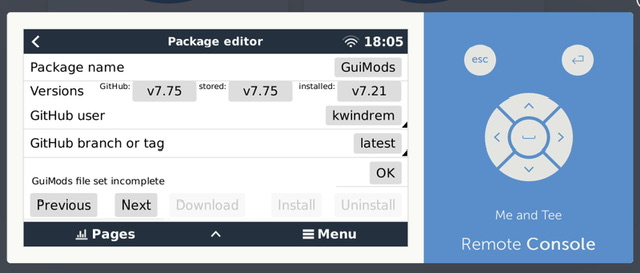
- dropped support for Venus OS v2.4x and 2.5x
- added more detail to the Relay overview generator status
- fixed: Generator buttons don't work on Relay Overview page for some Venus OS versions
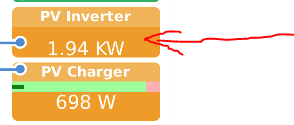
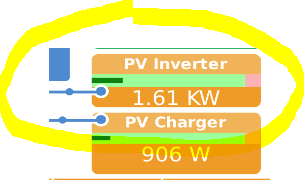
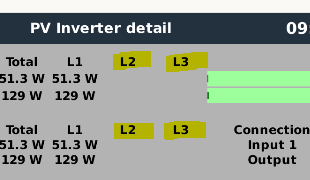
- fixed: PV Inverter tile on GuiMods Simple overview formatting errors
If you have automatic downloads and updates enabled in PackageManager you should get the update automatically. If not, manually update via PackageManager or download from:
https://github.com/kwindrem/GuiMods
Please report any issues here or in the issues section of the GuiMods repo on GitHub. Thanks.
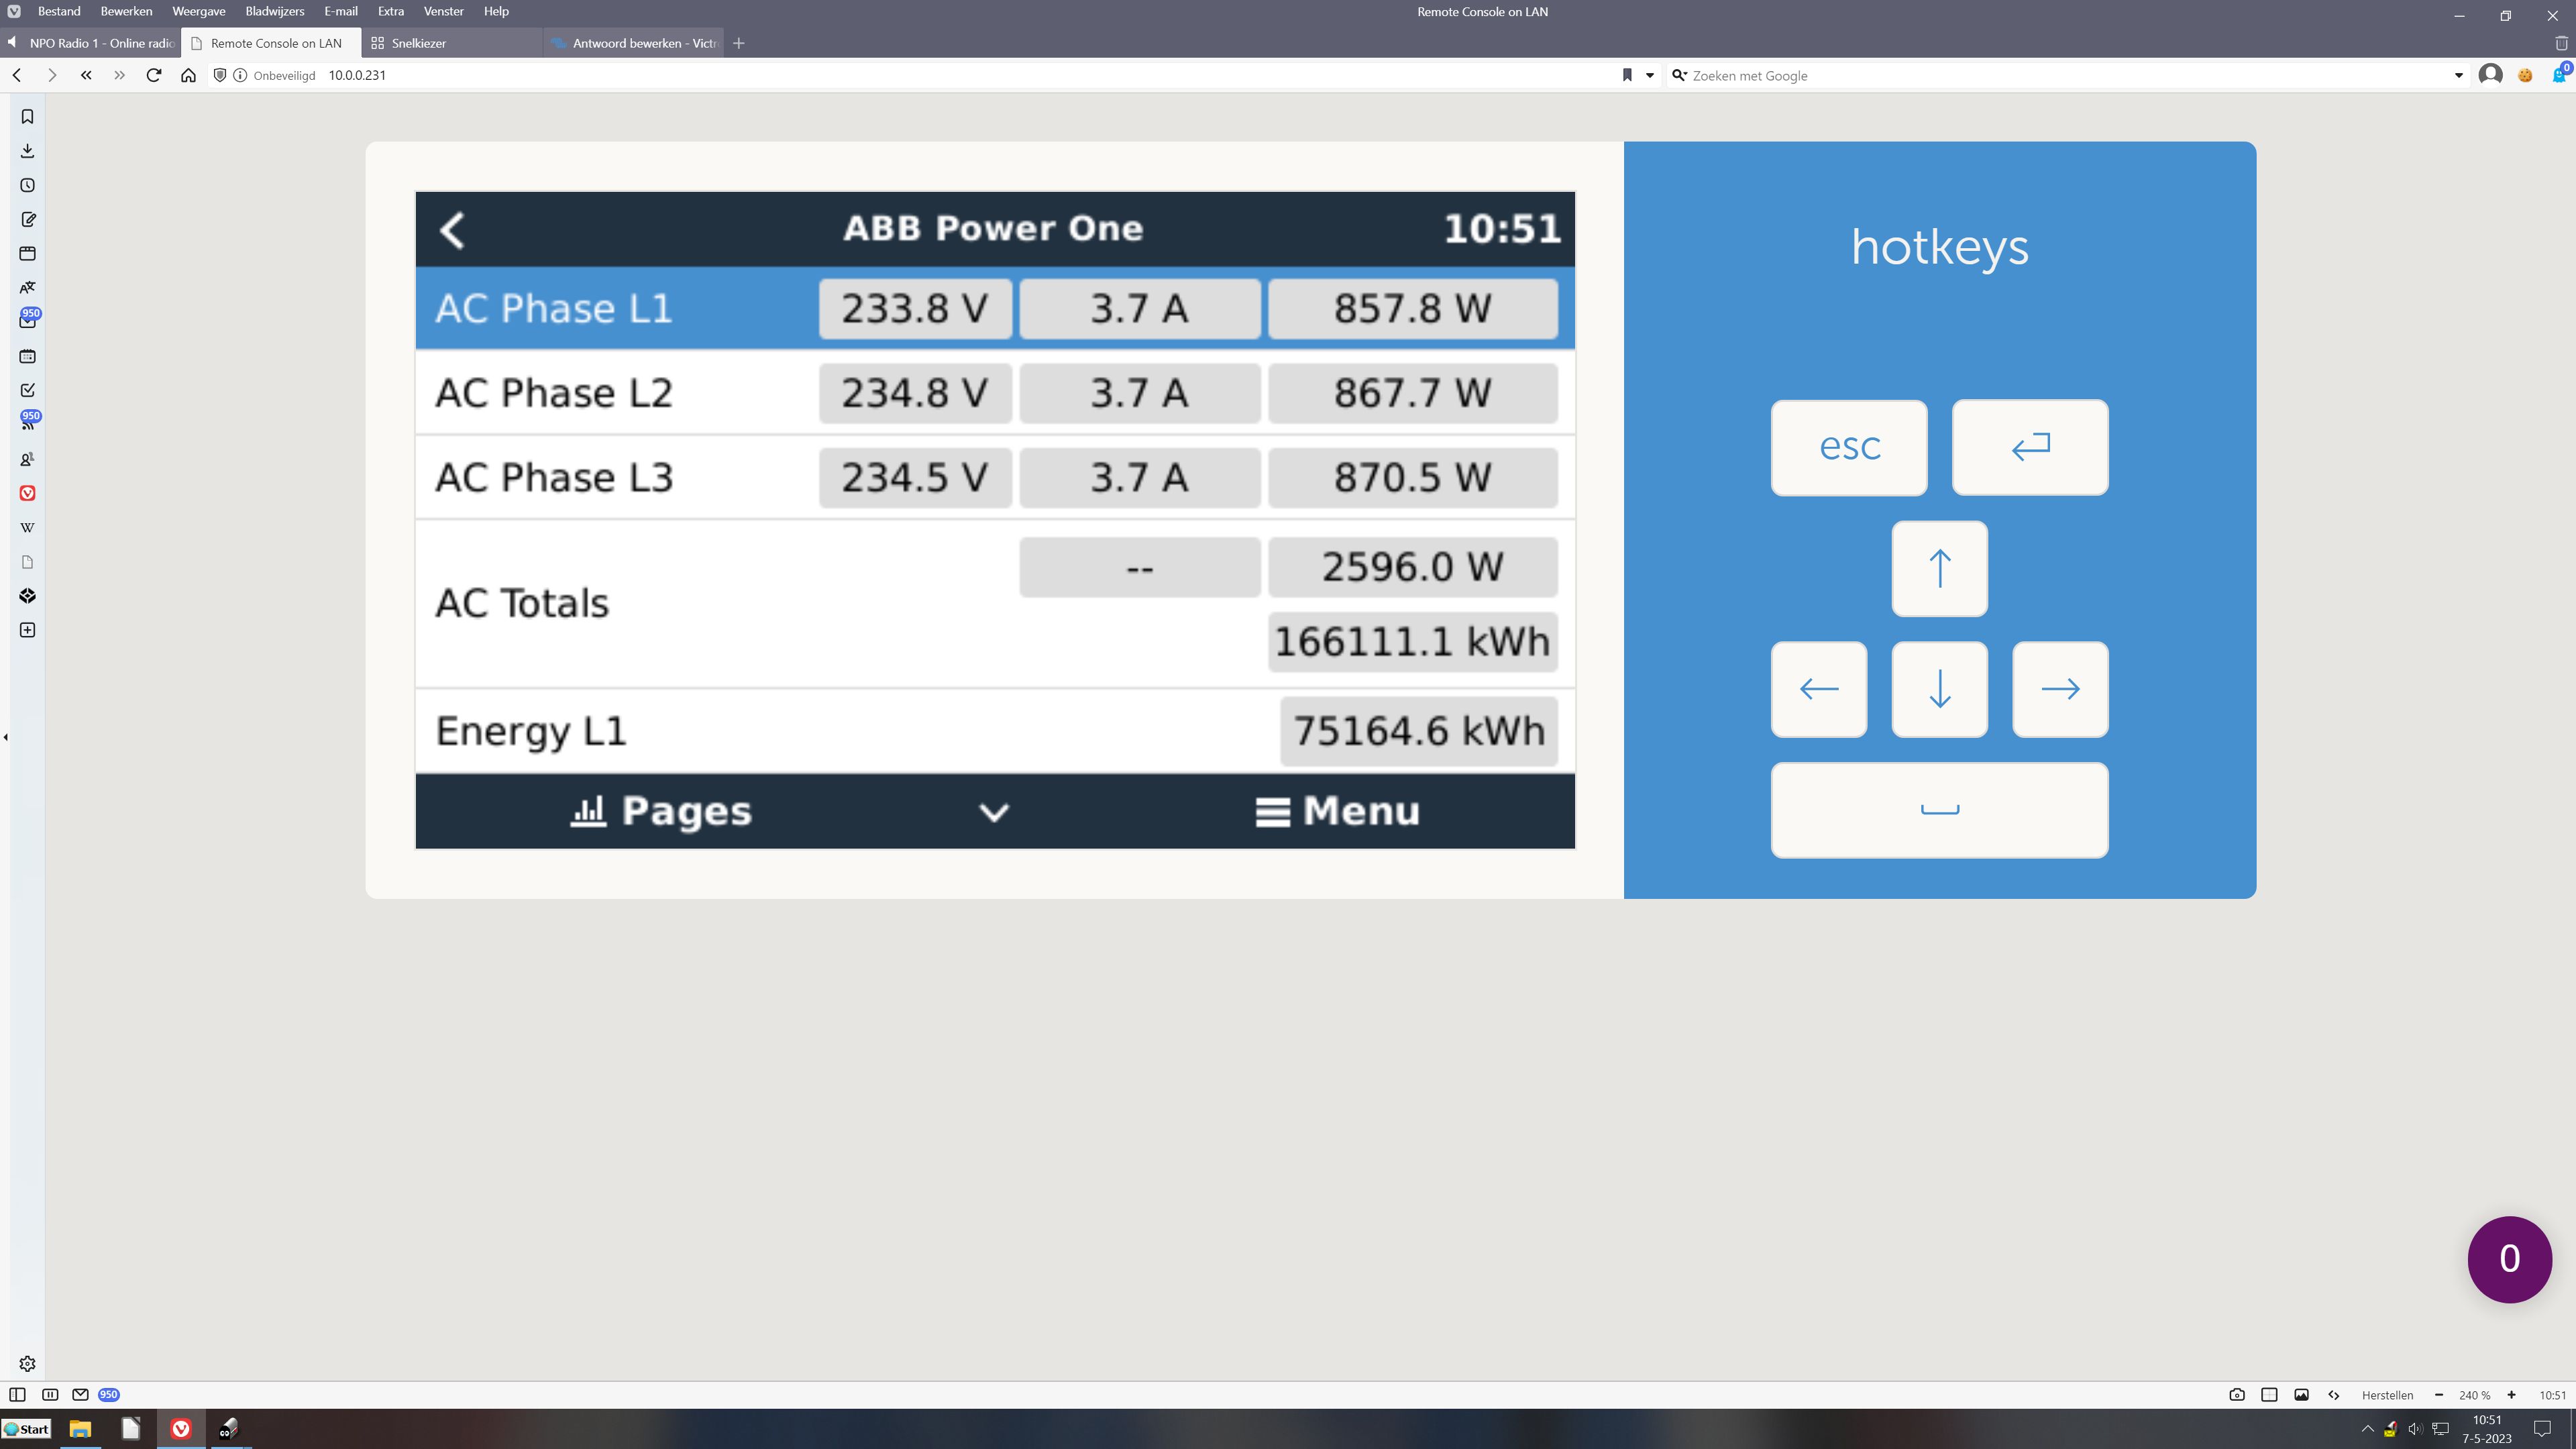
Screen shots of some of the new pages
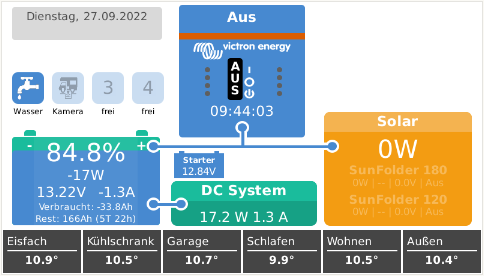
DC Coupled flow overview
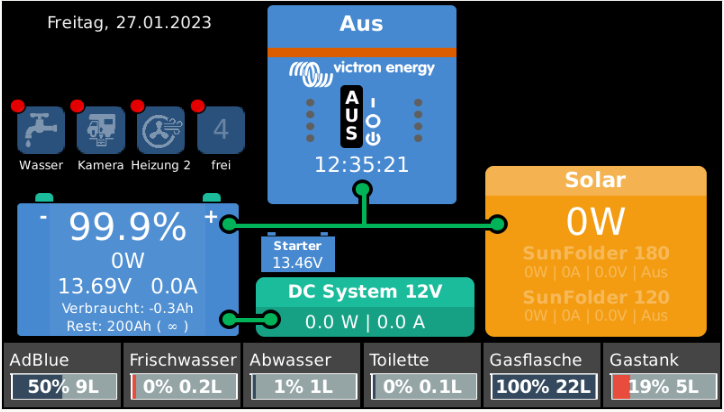
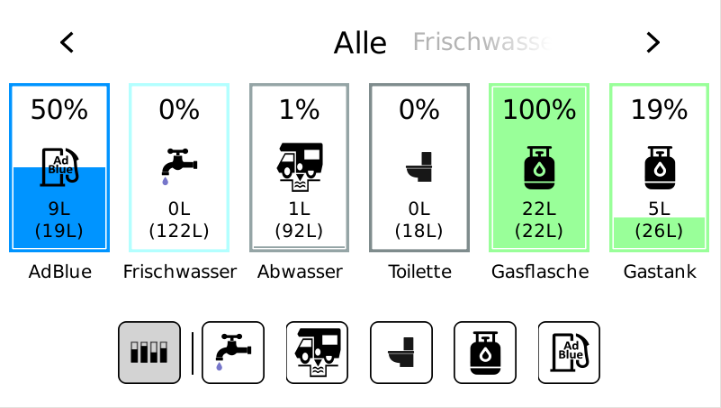
Enhanced Movible Overview


