question

nickdb avatar image
nickdb asked

Beta custom widgets in VRM

Thanks for this new feature, it is quite cool to create custom widgets.

I have noticed that if you try create a widget where there isn't current data available (seems to only use the "today" view), when you save the widget, it doesn't report an error but does not create the widget.

Also, you can't delete widgets once created.

VRM
10 comments
2 |3000

Up to 8 attachments (including images) can be used with a maximum of 190.8 MiB each and 286.6 MiB total.

harold avatar image harold commented ·
deleting worked with me.


However, showing LED status and alarms did not work.

0 Likes 0 ·
nickdb avatar image nickdb ♦♦ harold commented ·

Thanks, I found the option (it was off the screen) on the widget itself. There isn't an option to remove it from the custom widget section itself, you can only choose to show/hide it.

0 Likes 0 ·
Phil Gavin avatar image Phil Gavin commented ·

I like this feature.

I realize it is in Beta, so I'm just bug reporting:

Regarding the "Grid meter"

The "Grid Total energy" doesn't seem to work, whilst the per phase energy values are there.

0 Likes 0 ·
nickdb avatar image nickdb ♦♦ commented ·
Adding to the bug list:

GX stats like cpu load, wifi signal etc don't work.

Energy stats (ac1 in to ac out etc for ve bus device) are incorrect, or don't honour the selected time window.

0 Likes 0 ·
Tien avatar image Tien commented ·

I like this new feature, it will combine a lot of widgets.

Would be good to edit the custom widget, rather than delete and re-create.

Also adding names to the device or use the name of the device rather than the Parameter name.
If you combine a few temp sensors for example, it will look like below.

1647829005743.png


0 Likes 0 ·
1647829005743.png (35.6 KiB)
gone-sailing avatar image gone-sailing Tien commented ·

I love this new feature but the two things I wanted to use it for don't appear to be working.

1) Temperature - none of my temperature devices appear in the list of devices

2) Solar Charger - in the parameter list I have numerous PV Current attributes but none of them show up as values in the chart. Can anyone explain what is the difference between PV Current, PV Current on Tracker 1, PV Current on Tracker 2 etc. And why is each PV Current on Tracker 1,2,3,4 appearing in the parameter list twice.

1647879354682.png

0 Likes 0 ·
1647879354682.png (36.5 KiB)
Tien avatar image Tien gone-sailing commented ·

1/ What temperature devices do you have? Both my Analog Input, Ruvvi sensors are working, you pick them under Device.
If it's under a Device say SmartShunt then you'll have to pick that Device and find it under Parameter.

2/ I'm unsure on this one, so hopefully someone else can help.

0 Likes 0 ·
gone-sailing avatar image gone-sailing Tien commented ·
1) That's interesting. I must admit these are my own custom temperature sensors publishing data over mqtt. They are showing in VRM just not in the custom widget. I have a custom tank sensor that is using the mqtt interface and that is showing up in the custom widget. Very strange.
0 Likes 0 ·
mike4nl avatar image mike4nl Tien commented ·

I support that idea. I see the Temperatues[deg.C] only. When you have more then one senosor it becomes mixed up. Better is to use the names edited by the remote console or to have the possibility to give it a name.temperatures.png

I have now 3 sensors but i will use all 4 of them to do things with it (relais) and for dokumentation via logging. I can't see here which sensor is for which.

I hope Victron will this add in the nxt version of the Custom Widgets which is a great idea and gives me much more felxibillity.

0 Likes 0 ·
temperatures.png (29.7 KiB)
ad-le-roux avatar image ad-le-roux commented ·

First of all: great job!

I love the custom widget, but I want a way set a fixed min-max for each plot instead of relying on auto-scaling.

While auto-scaling shows the details of each plot, I often want to plot related things and auto-scaling makes it tricky to compare plots.

As an example I attach the yield for two solar arrays, I want to have both on a scale of 0-3k. I know the possible range and having a fixed scale gives immediate insight.screenshot-from-2022-04-26-11-43-54.png
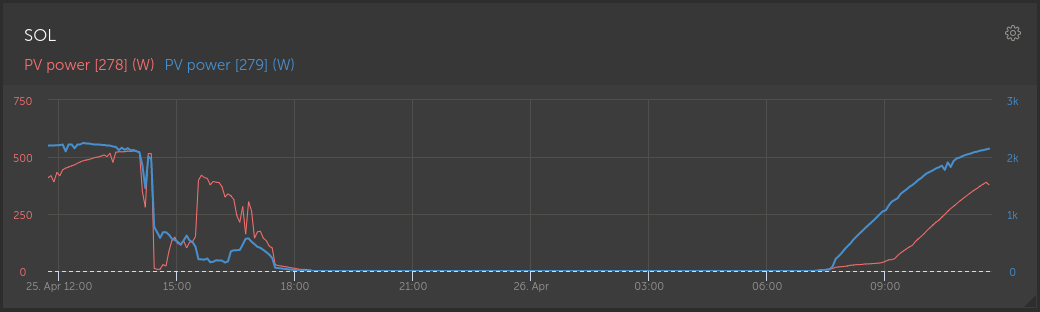
PS. The same goes for my plot of supply voltage+current

0 Likes 0 ·
1 Answer
permawatt avatar image
permawatt answered ·

Bonjour

Widget custom est un super outil . voici quelques suggestions

- il faudrait vraiment pouvoir choisir la couleur de chaque courbe

- pouvoir superposer les status mppt (bulk, absorp, float, egal ) et VE bus state, VE bus alarm

pour éviter de devoir faire ceci :capture-decran-2022-04-02-a-102107.png- pouvoir modifier le nom du paramètre
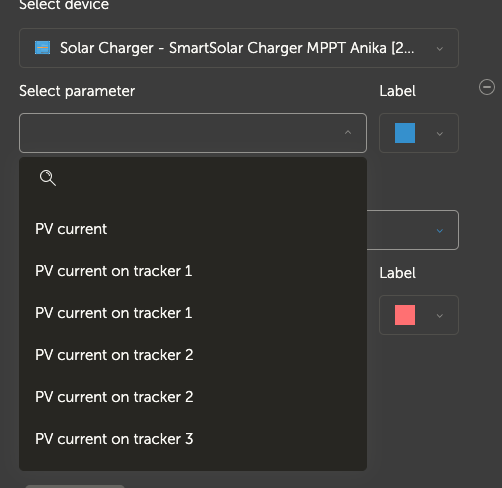
Merci

Permawatt


2 |3000

Up to 8 attachments (including images) can be used with a maximum of 190.8 MiB each and 286.6 MiB total.