Hi I’m not sure if I’m missing something but I want to chart my min and max temps of the MP2s I have. Is this possible?
asked
Can you chart MP2 min and max temps?
As far as I can see you have one temperature variable per sensor. There's a battery temp plot in advanced under ve.bus and battery monitor. But I can't find daily min/max. Even under custom widgets.
On the plots you can use the cog to show min/max range, while this avoids averaging, you end up with a thick line which iusually sn't that helpful.
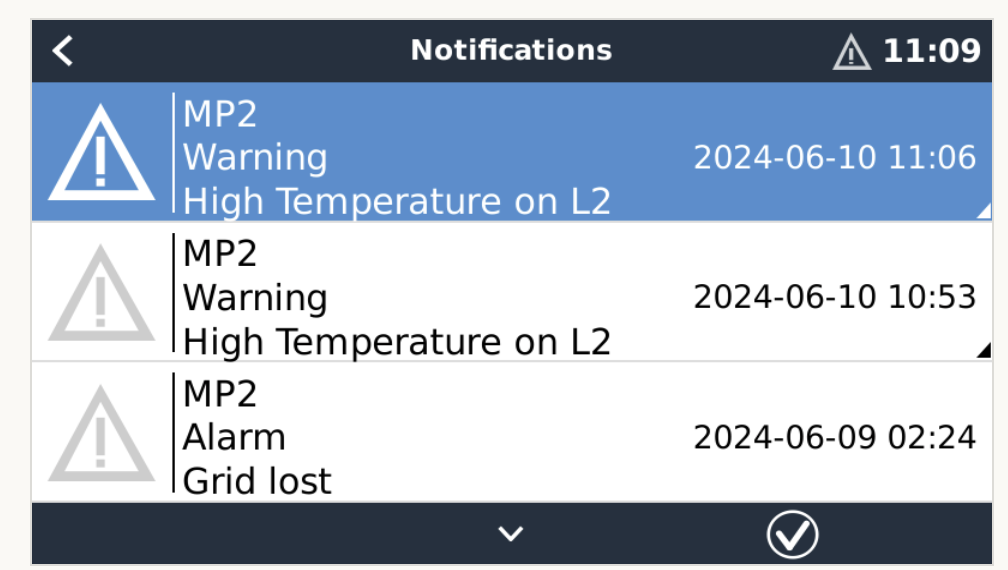
So There must be a temperature sensor stats because the inverters will report Temperature issues.
@Guy Stewart (Victron Community Manager) any chance you can advise on this, or @mvader (Victron Energy) maybe you can add the data point usable in the charts in the next Beta OS update?
The reason why I'm asking is I'm suddenly getting alerts when the temperatures/loads are within my normal operating range; so I'm wondering if something with the Beta OS update has cause a change?
For example: Temperature L2: Warning