question

andreas-siebenmorgen avatar image
andreas-siebenmorgen asked

Solar Production Forecast totally off

I really like the idea behind Solar Production Forecast.

Unfortunately during the past weeks, the forecasts were completely useless.

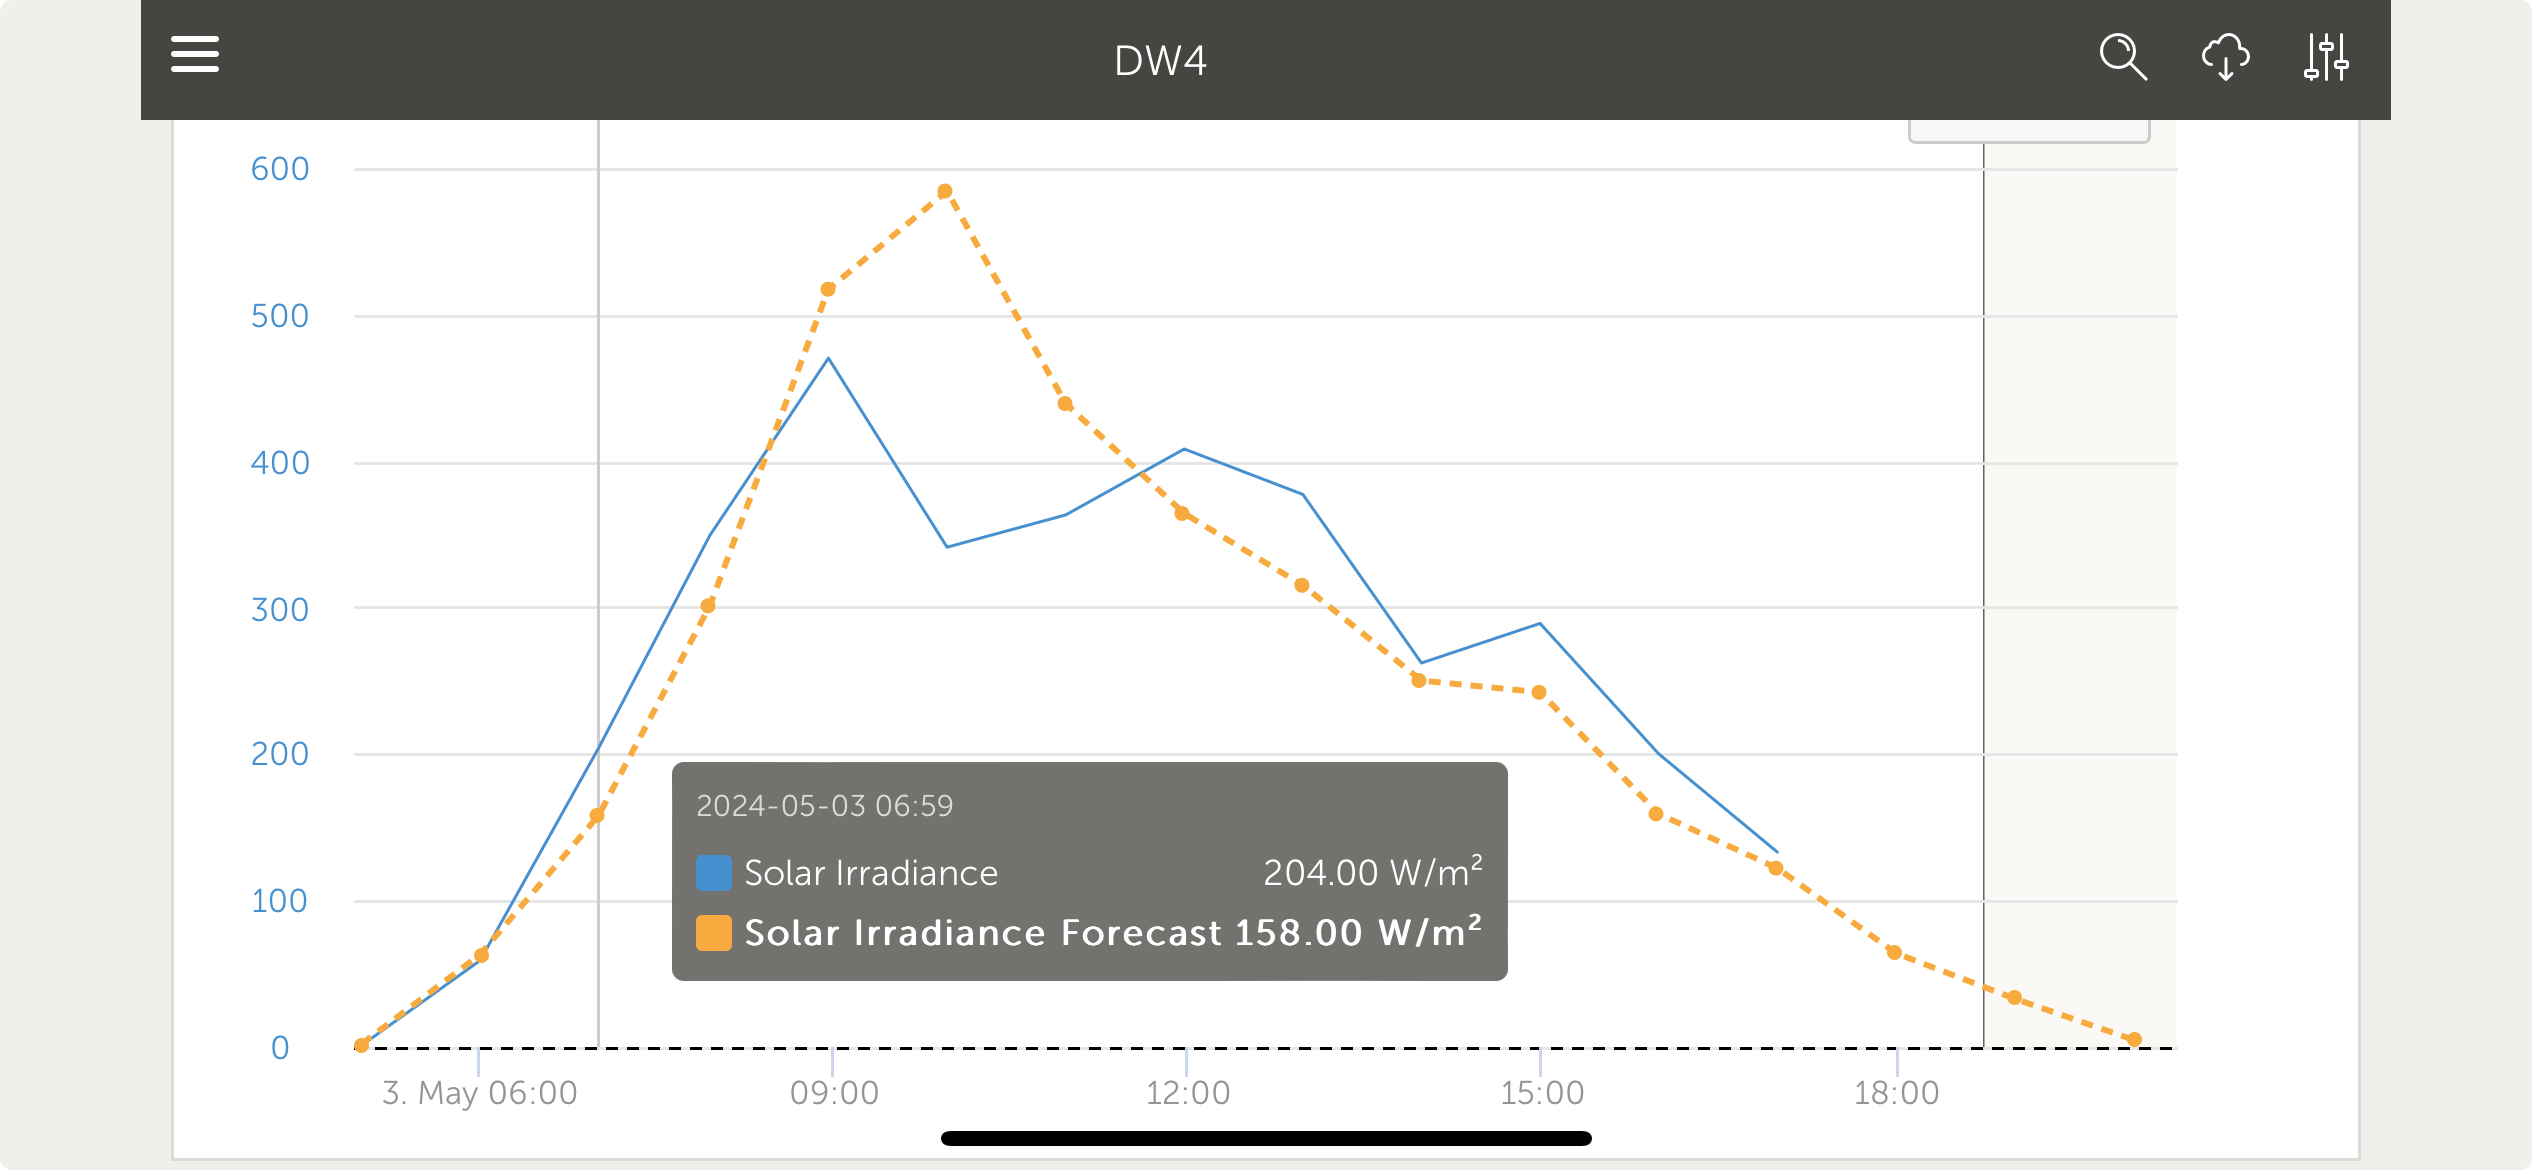
Even during full cloudy and rainy days, the forecast predicted „full sun“ during the day.

Victron really should ask if solcast is the right data source for weather predictions.

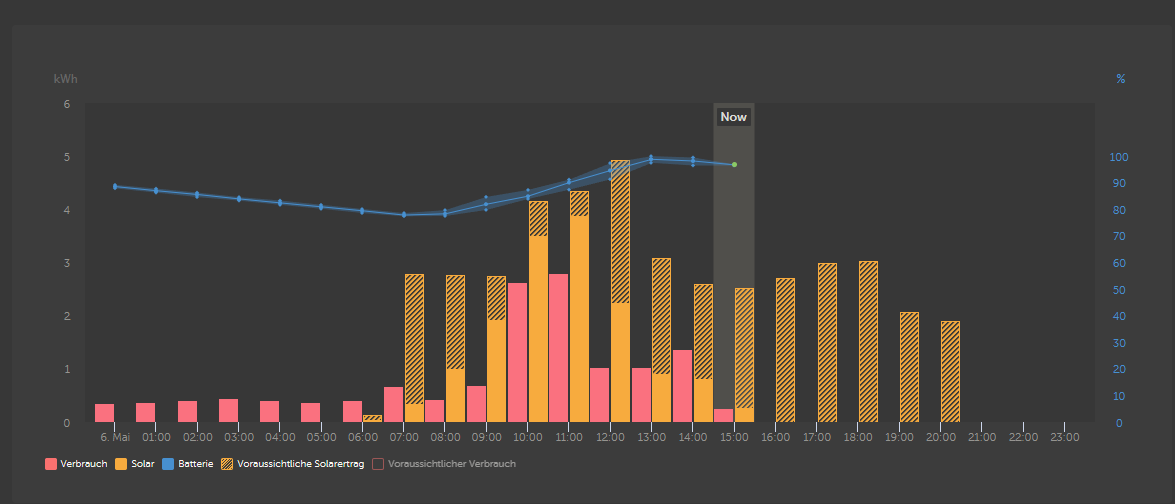
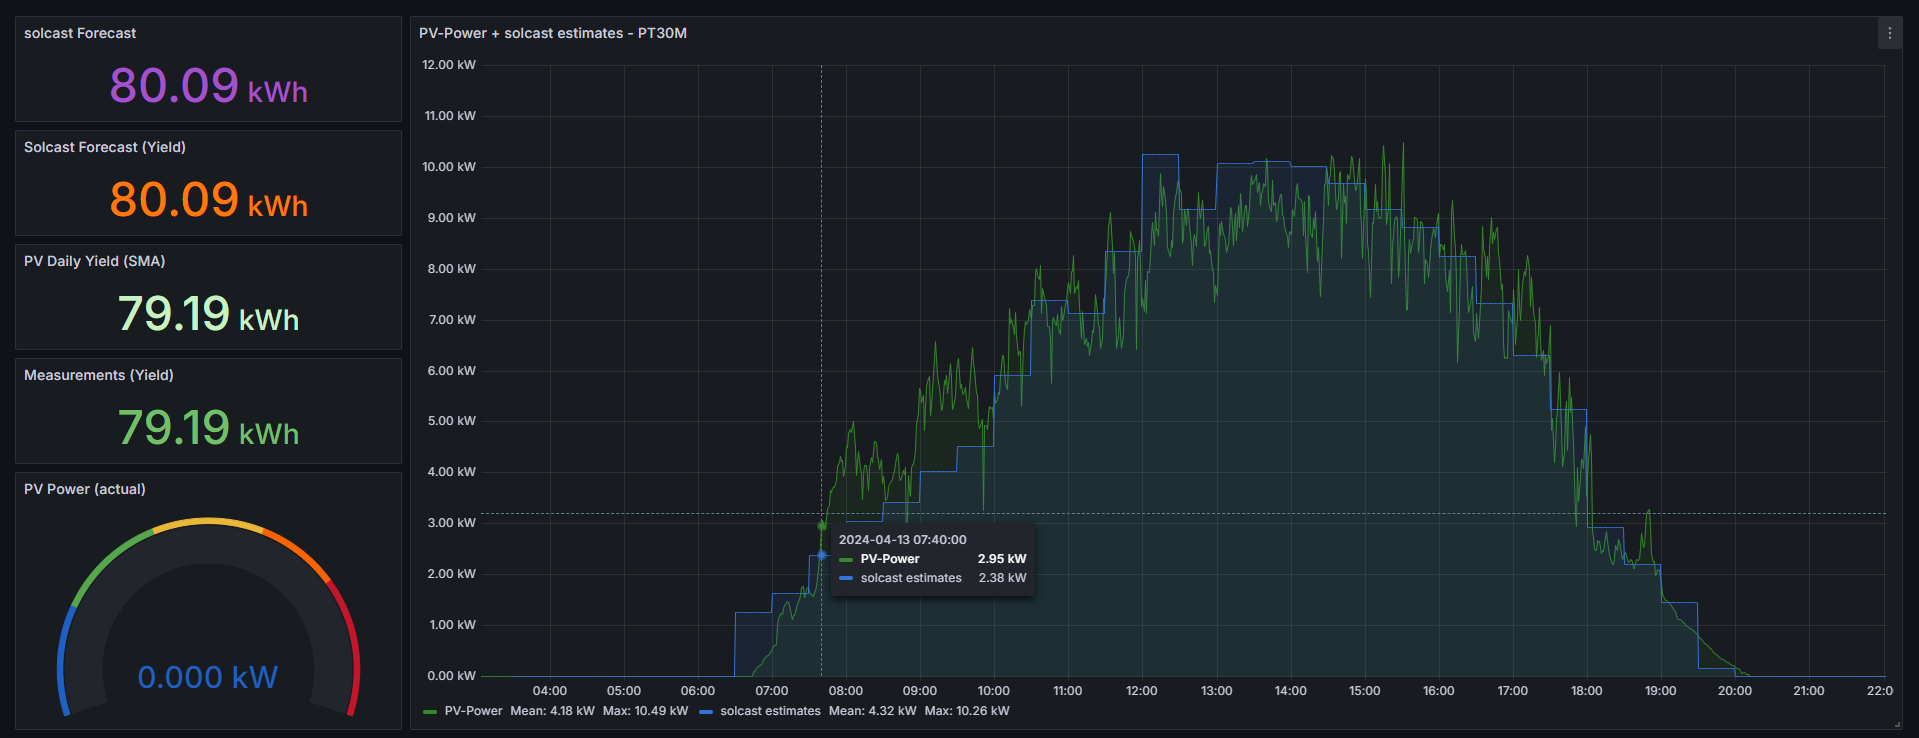
Example from today (cloudy day/ Battery not at 100% SOC, so thats not the reason)):


1715001990401.png

Venus OS
1715001990401.png (51.0 KiB)
3 comments
2 |3000

Up to 8 attachments (including images) can be used with a maximum of 190.8 MiB each and 286.6 MiB total.

Hey all - noted! We’re also not happy with how the current setup is working.

And in all honesty I don’t know yet if the problem is solcast data, or our algorithm that translate forecasted irradiance into forecasted yield. For now I’d say its most likely the latter, the algorithm + perhaps how data is visualised on VRM.

Note that for offgrid systems as well as grid connected systems that don’t feed back, actual yield is heavily influenced by when the battery is full / MPPT starts throttling.

On the VRM advanced page you can see the irradiance forecast, like this:

e4df7597-474b-418a-93cc-d735a44f8617.jpeg

1 Like 1 ·
nicovkampen avatar image nicovkampen mvader (Victron Energy) ♦♦ commented ·
Hi, glad you can agree with the problems. Is it possible to implement some quick fixes (max kw only for active inverters) on the short term? next month i will be switching to a dynamic contract. (again today 12 Kw predicted at noon when only a 5Kw inverter connected)
0 Likes 0 ·
andrii-podanenko avatar image andrii-podanenko commented ·
For my setup(South Facade field, West Facade field, Roof 18° field) + 28.5kWh batteries forecast usually underestimates prediction. My setup was getting more than prediction during cloudy or semi cloudy conditions.


There were days when it said 50+kW / day, but I usually consume not more than 35.

Also there were days when it predicted full solar , but it end up cloudy .

I see how the system tries to update prediction during a day, what starts with 40, ends up with 30 at noon, based on changed actual consumption.


By observing the system I must say it's very setup depending.

Having a couple of config variables could be helpful, like direction, angle, low/high voltage PV, SOC at the start of solar generation would probably help, but it complicates everything.

Basically I satisfied with current forecast mostly.


I'd rather call for having information about forecast is changing during a day. Like a difference on a graph (was, is) - which could help building automation.

For example, forecast is 50kW in the morning, with average 5kWh for 10h. But after first 1-3h system drops total prediction to 30kW with generation moved to end of the day mostly.

This trend (-20kW) could help to notify with message "easy on consumption, household/business"

Same for +20kW change - "hey, power on that heater/equipment, we got more sun here."


Maybe some day dreams will come true @mvader (Victron Energy)


0 Likes 0 ·
3 Answers
hominidae avatar image
hominidae answered ·

...IMHO it's not optimal, but not too far off (maybe around 10-20%).

I am using my own solcast rooftop account, in parallel to VRM and this is very, very accurate (around 0-2% off)


Edit: here's a sample from April 13th

1714977676301.png


1714977676301.png (231.8 KiB)
2 |3000

Up to 8 attachments (including images) can be used with a maximum of 190.8 MiB each and 286.6 MiB total.

nicovkampen avatar image
nicovkampen answered ·

I also have many issues with the algorithm. It really is way off many times. One point off improvement is to let users specify their installations specifics (like total Kwp en max power inverter, fields orientation) so that the algorithm does not make a foul of itself by predicting 12 Kw while there only is a 8Kw inverter. I think using this data together with the weather forecast is more precise than using last 28 day data ( where not on the equator). Or at least change the weight of each data set in the algorithm. In my case i have several inverters which are not always (hardly ever) switched on both. The algorithm still does not respond well to these changes.

2 |3000

Up to 8 attachments (including images) can be used with a maximum of 190.8 MiB each and 286.6 MiB total.

wilm avatar image
wilm answered ·

I have issues with the algorythm as well, but there is no way to comply with all systems over the world, except using AI.

1st: Weather forecast: Is quite good for the next day, but pollen and Sahara-dust is almost impossible to predict.

2nd: The system might learn to understand my total Wp, but it can't learn the obstacles surrounding me. Those obstacles will vary day to day causes by vegatation and time of the year. A leafless tree in the spring is different to a tree during summer.

3rd: Even if the system could estimate my Wp installed, f.i. I have a system consisting of 4 areas for my panels. SE, S, W, and NW. How to calculate ?

This would request a complex AI for each system which are multiples of thousants.

For my POI almost impossble if VE will not invest into AI at it's best.

My conclusion is quite simple: It's a HINT, but for DESS I will use my BRAIN to adjust the settings for the best results.

Let's wait until AI is common and we'll get better results.

Just my 2 cents,
Wilm

2 |3000

Up to 8 attachments (including images) can be used with a maximum of 190.8 MiB each and 286.6 MiB total.

Related Resources