Another quick fix for the VRM elves to look at. The graphs are data from a MPPT 150/35 attached to Solar Panels on my boat.
Same device - different x axis - different values?
Probably to do with what time of day you use as the data point - so it might be necessary to check the peak value for the day and plot that. I have tried the "show range value" but that does not improve things much.
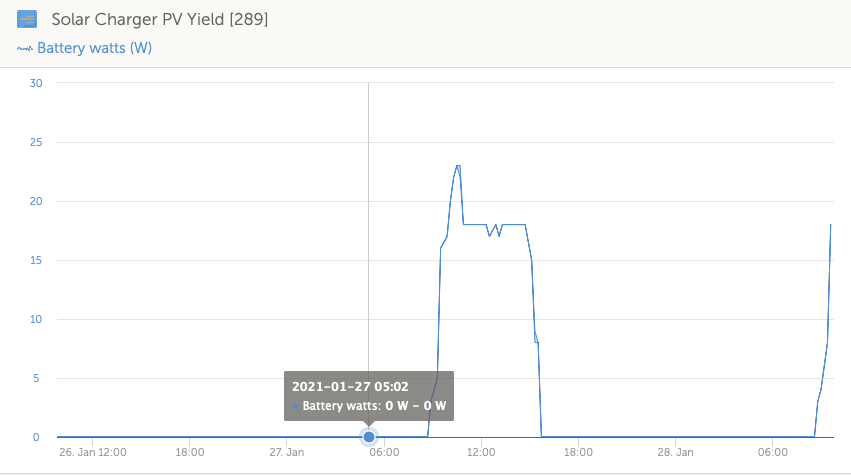
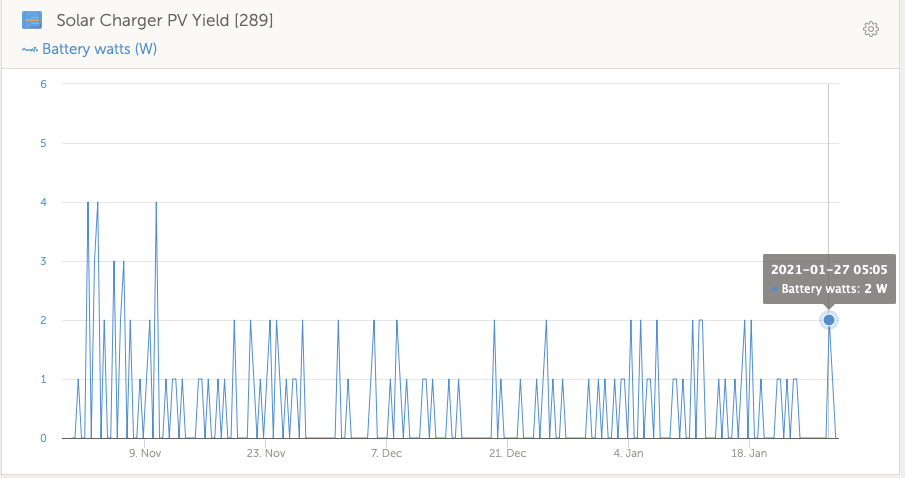
Also at 5:05 on the 27th there was no generation (see last graph)
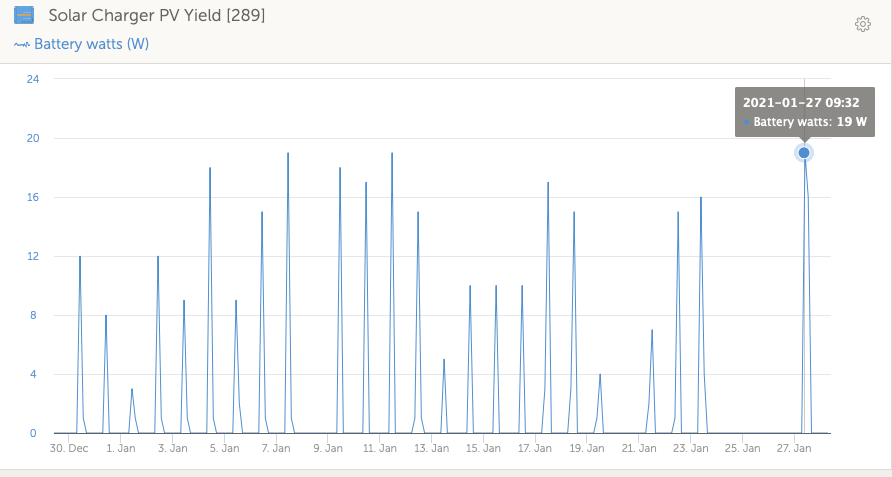
30 day graph
90 day graph
The graph for the 27th