I cannot find a way on VRM of totalling the amount of kWh consumed over a set period of time, say overnight, this would be very handy as running an off grid system as is for analysing I have to set to 12hrs and add up the consumption or am I being stupid!?
asked
How many total kWh during a certain time
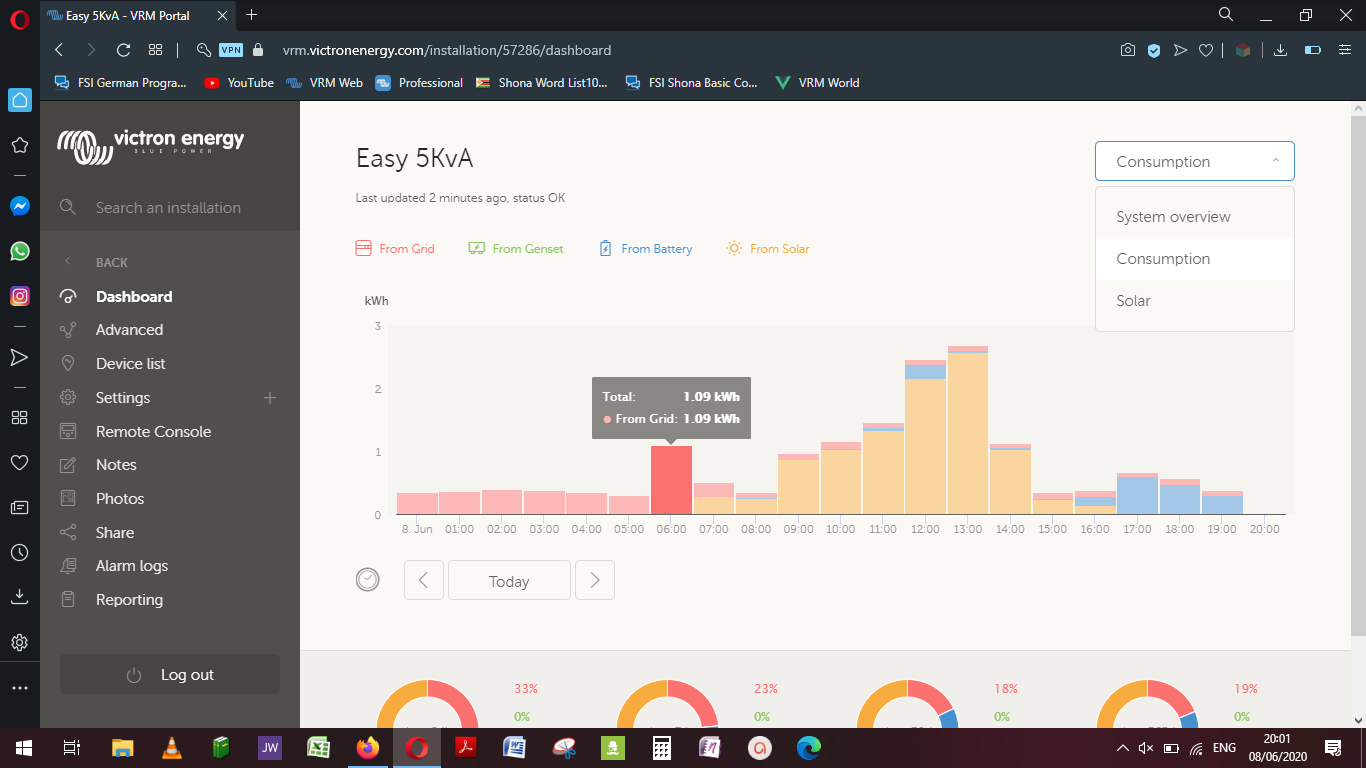
In the vrm in the top right corner you can change the view to consumption. Then hover your mouse over each bar and add up the amounts to work out consumption for over a few hours.
Thank you ,I knew that it,just means you have to add up the bits urself, I want it all done for me set time period and boom job done
Hello @Matt drummond bell,
me, too! ;-) To stupid to find a solution to get directly the total other by using a calculator or my brain. I wished boom job done, too!
In the consumption page there are diagrams which shows how much percentage was solar, battery, grid, genset. But percentage of what? What is 100%? This would be exacly the figure I wanted and is not shown here, but VRM knows it otherwise it could not calculate the percentage.
Perhaps somehow will be an improvement!
DayAndNight
Hello @Matt drummond bell,
I just found half way by chance to read what we wanted to know! ;-)
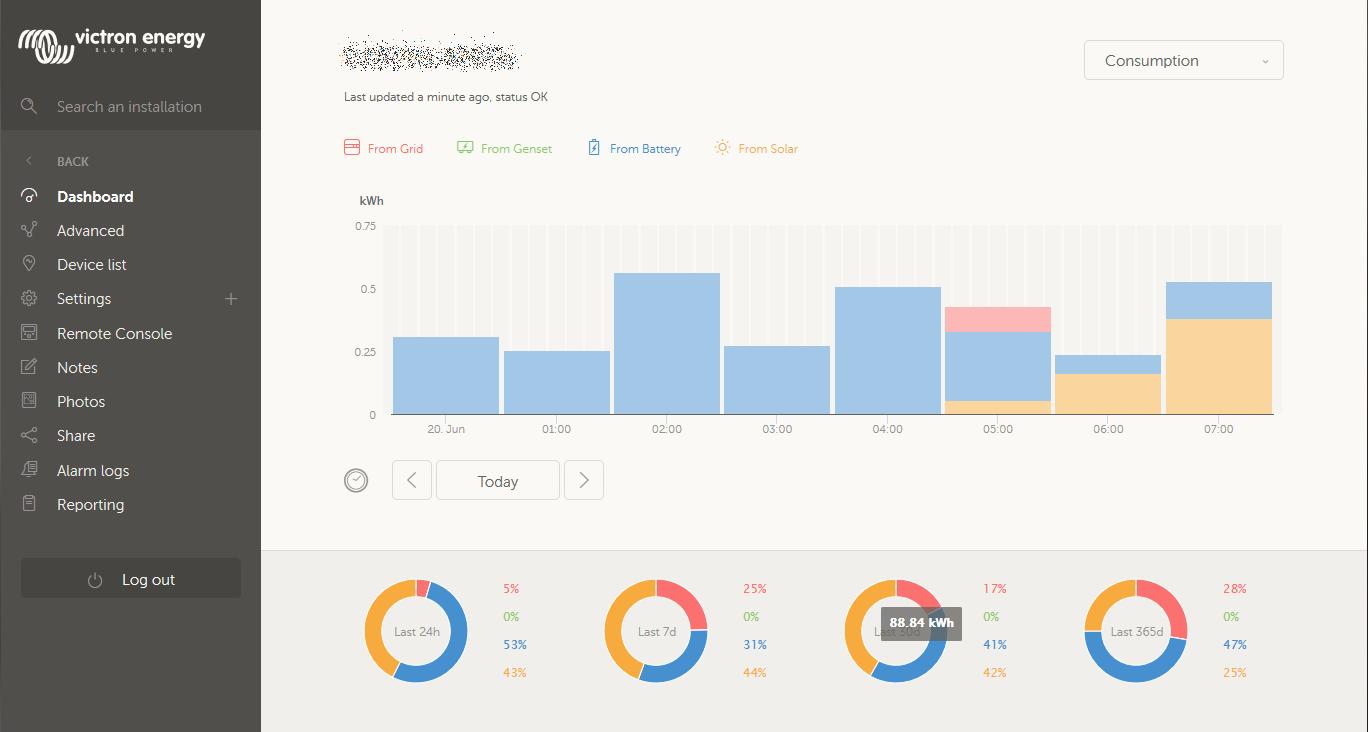
In the consumption diagram it is possible to hover the mouse over the red, yellow, blue part of the circle and the corresponding consumption in kWh will be displayed. What is missing that it is possible to hover over the word e.g. "last 30 days" and get the total | 100% kWh for last 30 days - but now it is only necessary to add three figures.
But when switching the time period for showing the stacked diagramm to minimum last 6 month or longer you get by hovering what we wanted to see directly
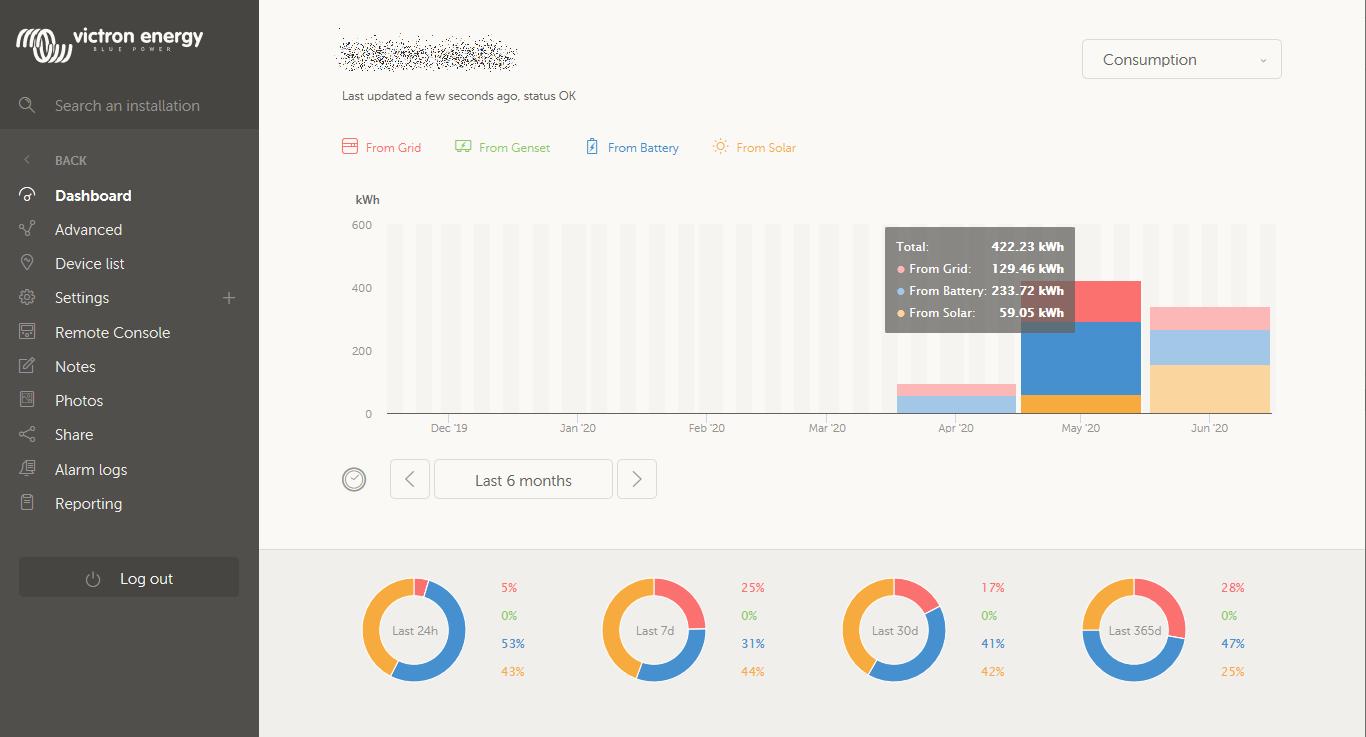
E.G. monthly based all four kWh figures: total, subtotal grid, solar, battery for the month.
DayAndNight
@Matt drummond bell and @DayAndNight
Did you ever find a solution to this? I too would like to compare night and day consumption over 24 hours, 1 week and 1 month. For now, I'm manually adding up the figures using a calculator. Too much work for a lazy sod like me, especially when I'm sure the data is already there.
F.