Looking for comments understanding my new 100/50 blue solar. I have 1000 amp bank with 500 watts of solar on my yacht, the fridge is doing a number of runs in each 24 hr hour run and using led lighting at night , the days are getting more sunny but I'm still only seeing yields around 1000watt? What are your thoughts? 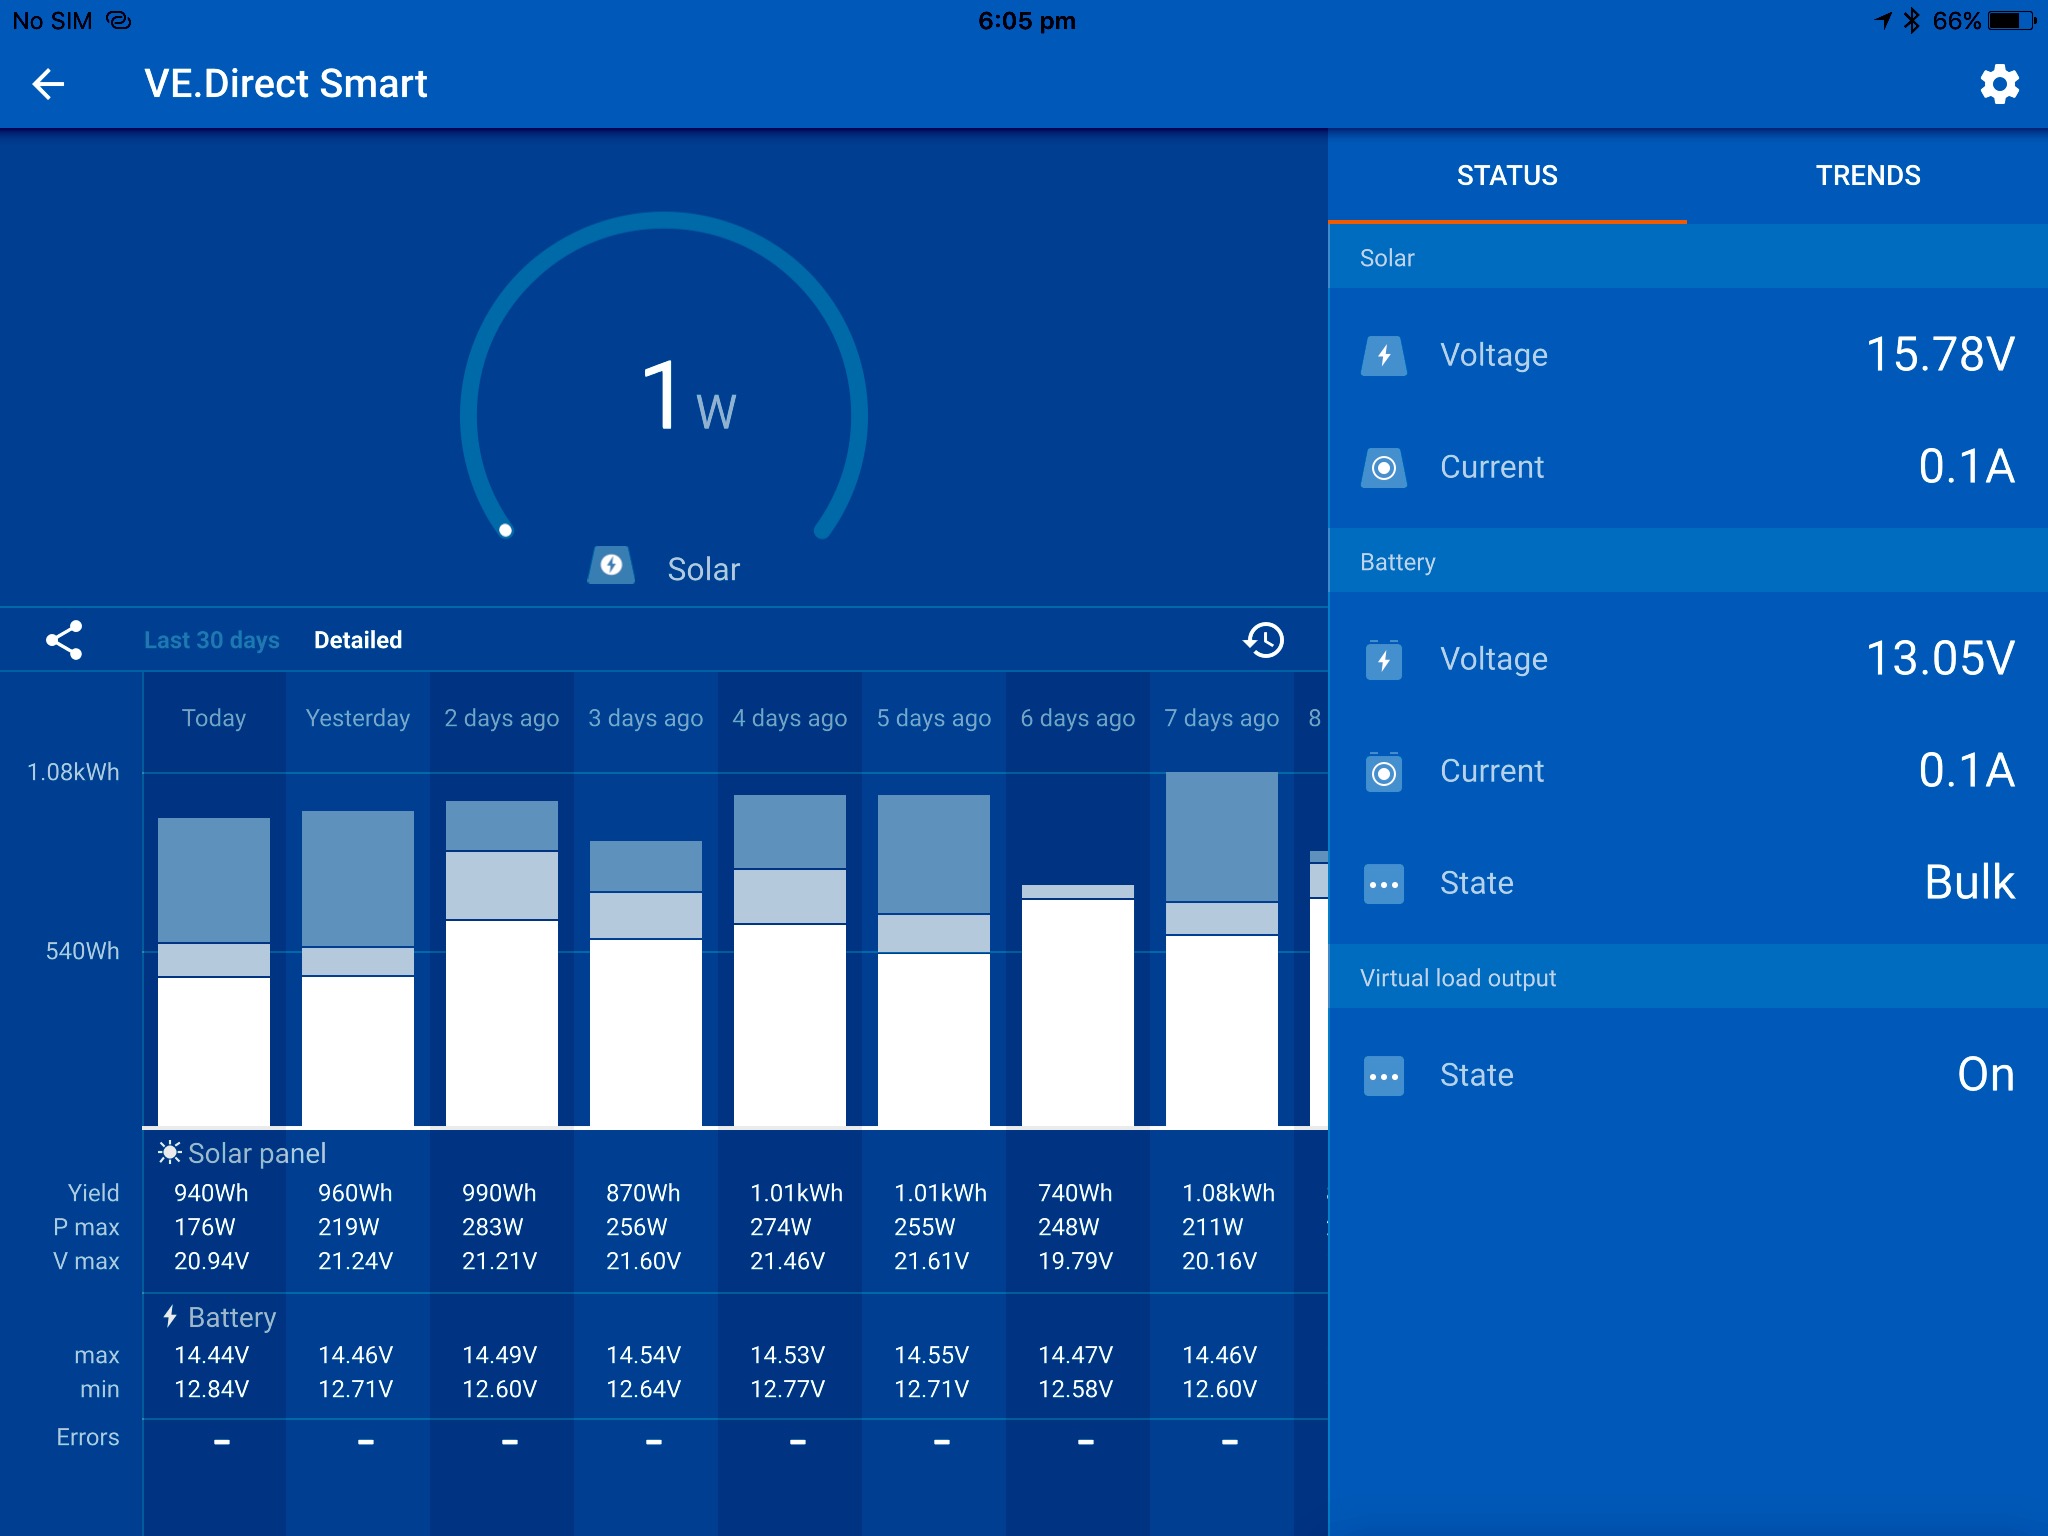
asked
Understanding mppt victron graph
If you click on the bar chart for each day it will provide more information about the time spent in each charge phase.
But going by the main overview I can still see that you reached float phase on all days except one.
The battery can only take a certain amount of energy, until it is recharged to its full capacity. Once full it physically can't absorb any more energy, so any excess solar power available simply won't be utilized.
If you really want to see more daily solar yield, then you need to discharge the battery deeper overnight or use more loads during the day.
Obviously this is not really the main objective, the aim is to use whatever loads are required and then have sufficient solar power available to replenish the energy discharged during the next charge cycle - which is already happening.
Hi @Southace,
I agree with @Mark. The white, light blue, dark blue bars, show that you batteries have spend quite some time in float all days but 1. Float is the dark blue at the top of the bar. That's brilliant. That's what you want to see.
Remember that you can only put back into the battery today, what you used yesterday. So if you only used a little, you can only put back a little. It is the same as water in a glass. If you drink 1/4 of the cup, you can only put back 1/4. If you put back more, the glass will overflow. In case of solar, the MPPT will simply stop putting power into the battery.
In you graph your system yielded 940Wh "Today", which means "Yesterday" you used 940Wh.
Your yield has been between 900 and 1000Wh/day. So that simply means, that is what you have used.
So looking at the graphs, your system is functioning just fine. :-)
Regards,
Anita
Hi @Southace
Another thing to remember is that your total daily solar production = usage from batteries the previous night + usage today directly from solar.
So you total production (yield) is not equal to total consumption from batteries.
In your case your fridge will be drawing power during the course of the day. Depending on your setting, it could come straight from the panels, especially when your battery is in float.
Regards,
Anita