question

furyjk98 avatar image
furyjk98 asked

MPPT Tracking less power due to voltage drop of battery. Is this normal?

Hi guys, I started to notice this issue for quite some time, and I ran some analysis on this to get it clear.

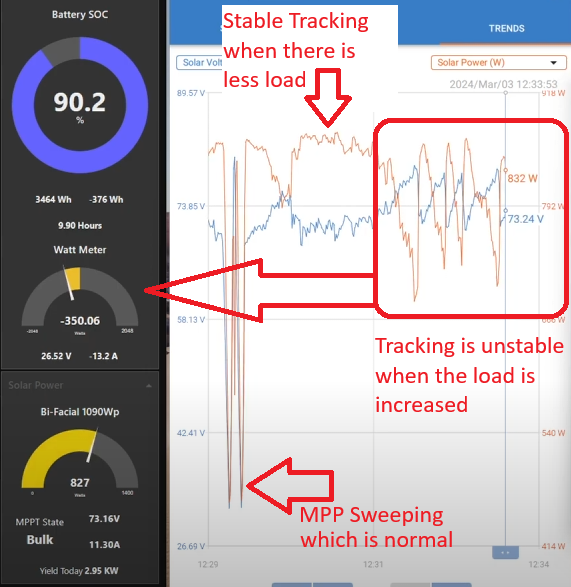
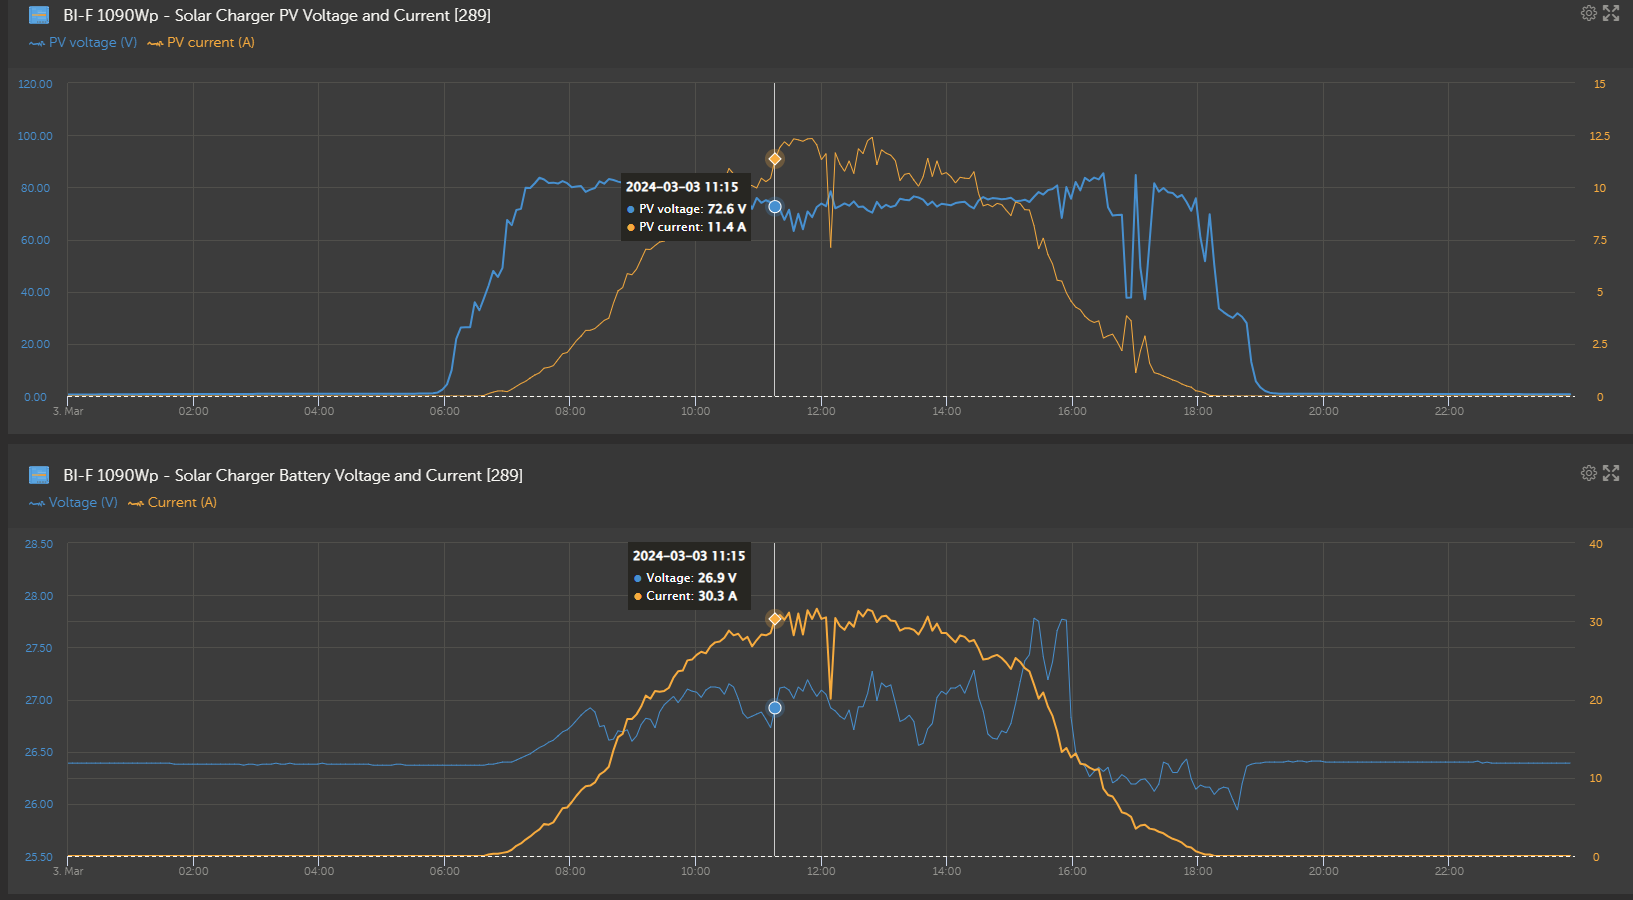
It seems like whenever there is a slight voltage drop on the battery side due to the loads. The MPPT tracking seems to go higher and track less amps than it was able to harvest at a slightly lower voltage which might be its MPP.

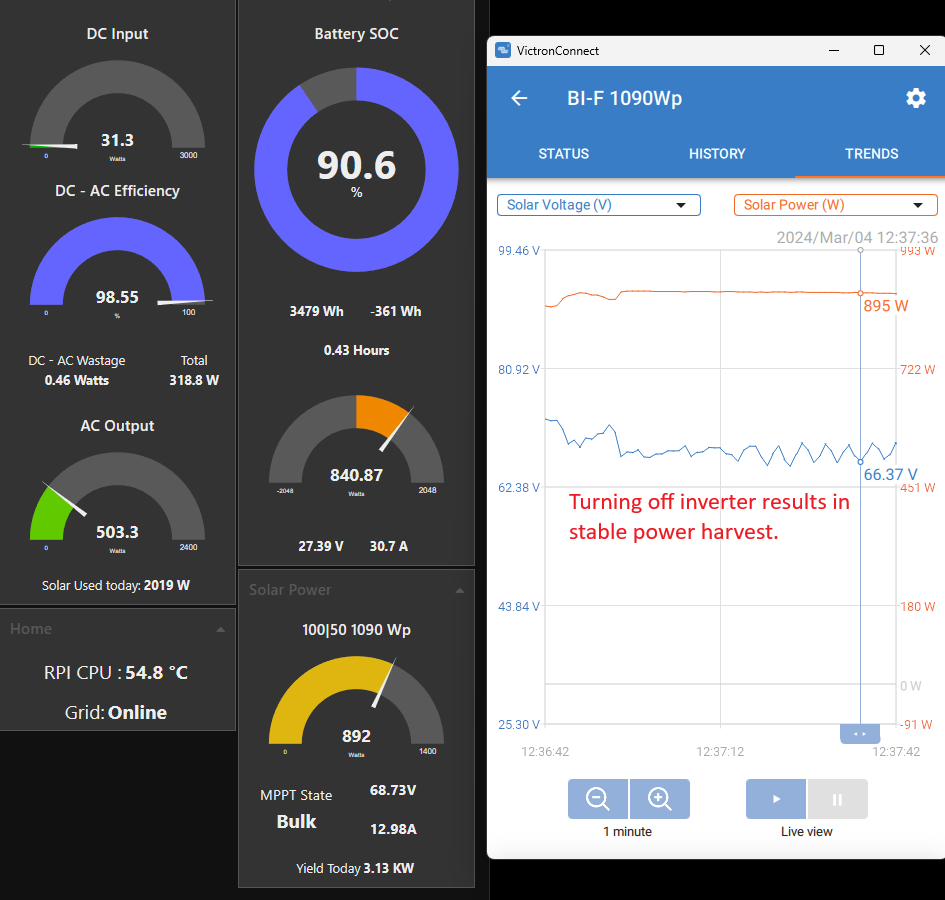
1: The load is low, and the MPPT is harvesting more energy.
high-power.png


2: Load increased which caused a slight voltage drop at the battery, and the MPPT increased its tracking voltage and is harvesting less energy.
low-power.png
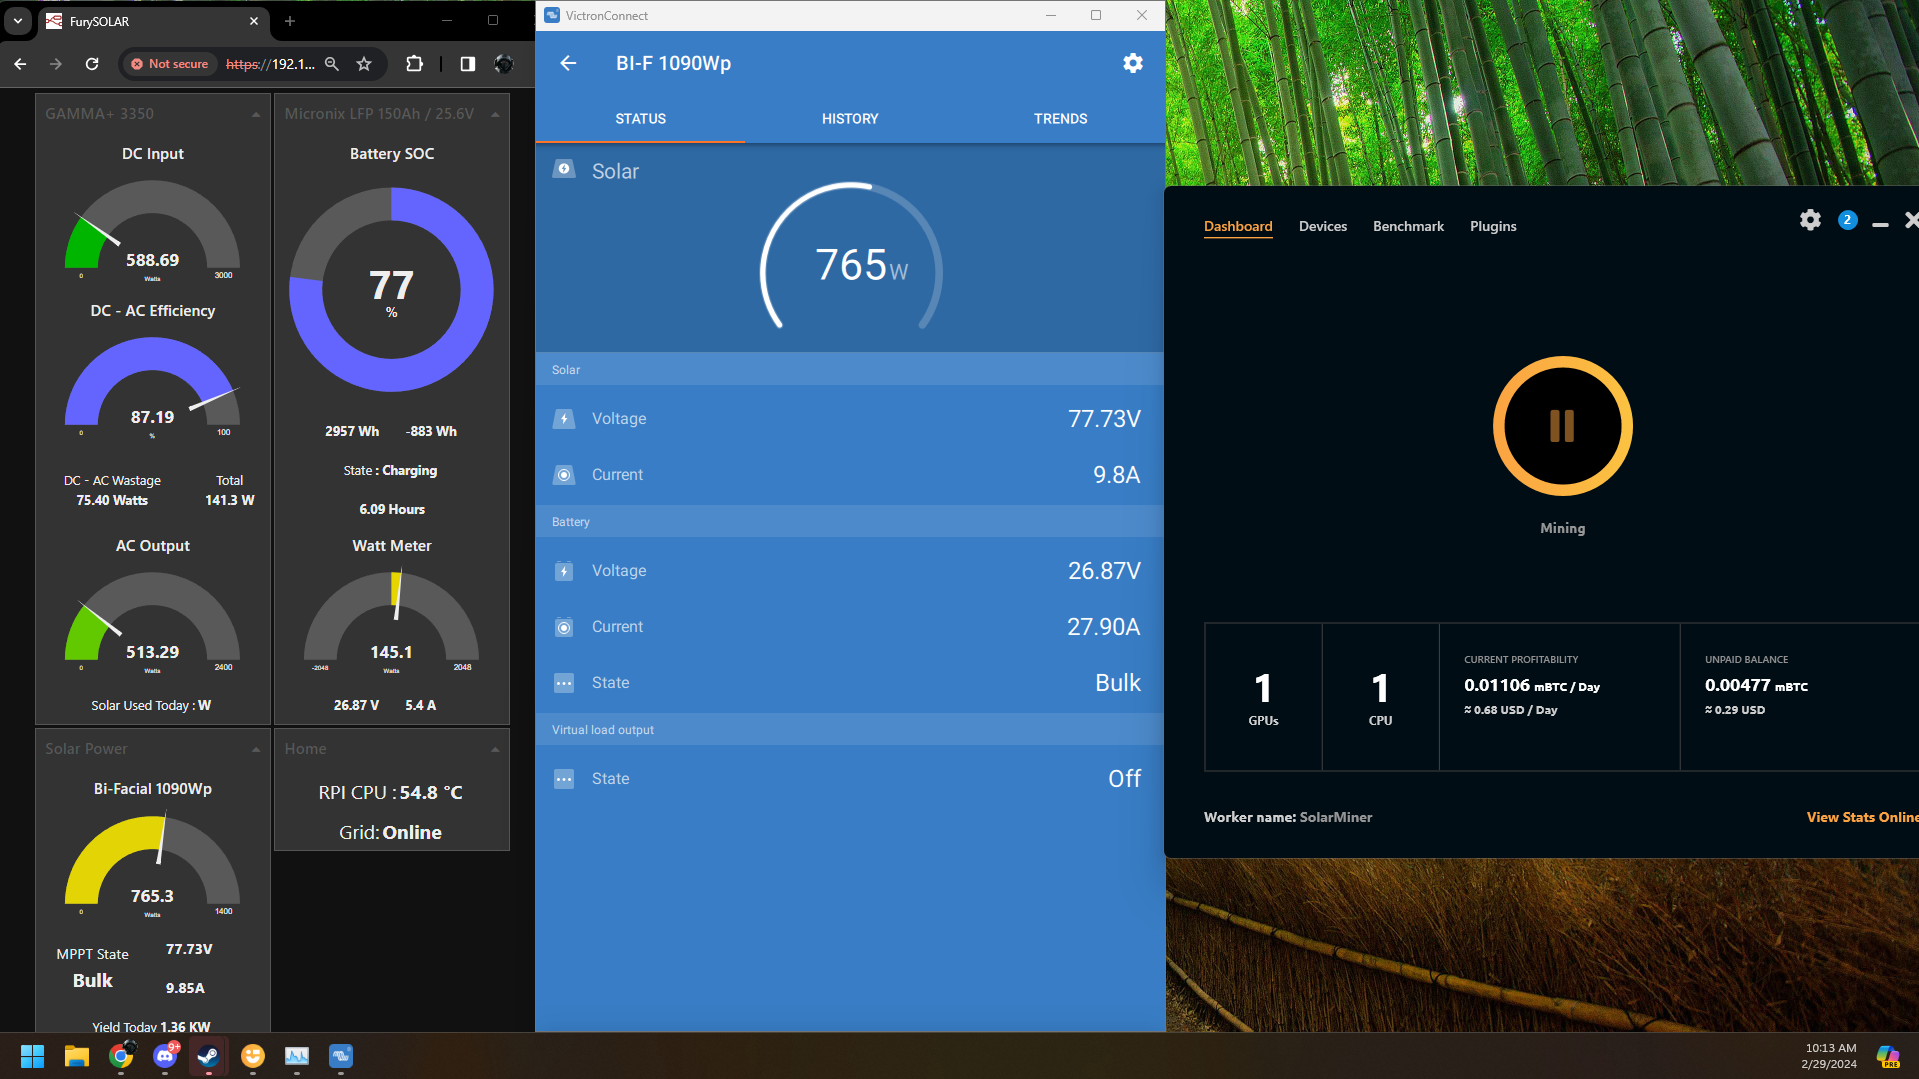
Link for a video, where I have tried increasing and decreasing the load, and you can see there is something wrong with the tracking of MPP due to a slight voltage drop in the battery.

The power loss is more significant when there is a discharge from the battery where the load needs both Solar and Battery causing even more voltage drop, and it will be 80+ watts of wastage since the MPP voltage goes higher even more.

Initially, I thought it might be due to changes in the sunshine, maybe a cloud was passing by or something. But I don't think that's the case.


Has anyone faced this issue or know why this happens?
MPPT ControllersMPPT SmartSolarvoltage drop
high-power.png (1002.9 KiB)
low-power.png (1000.5 KiB)
2 |3000

Up to 8 attachments (including images) can be used with a maximum of 190.8 MiB each and 286.6 MiB total.

6 Answers
Alexandra avatar image
Alexandra answered ·

@FuryJK98

I have seen this behaviour and it can be based on how the components are connected.

You are only looking at V and A there but don't forget the R in the circuit.

Resistance changes in the circuit. Do you have everything on a bus bar?

2 |3000

Up to 8 attachments (including images) can be used with a maximum of 190.8 MiB each and 286.6 MiB total.

furyjk98 avatar image
furyjk98 answered ·

Thanks for the reply.

I have the setup like this.
Positive Wire of Battery <> Disconnect Switch <> Inverter and MPPT's Positive Wire combined.

Negative Wire of Battery <> SmartShunt <> Inverter and MPPT's Negative Wire Combined.

The Battery Cable is 25mm2, Inverter wire is 25mm2, and MPPT's wire is 16mm2
I am using Smart Solar 100 | 50 MPPT

When combining both. I have made sure that the MPPT's wire is having direct contact with the Shunt and in the Disconnect switch, so if there is any excess power, it can flow through the battery without having to go through the inverter lug.

Will adding a Bus Bar to the system resolve this issue?

2 |3000

Up to 8 attachments (including images) can be used with a maximum of 190.8 MiB each and 286.6 MiB total.

furyjk98 avatar image
furyjk98 answered ·

@Alexandra
I have made another video to showcase this problem. You can see more data in the Trends graph of what happens during the tracking.

And when I turn off my Inverter, which allows all the power to go into the battery. I get stable power from the MPPT. I don't know what seems to be the problem. The basic function of the MPPT is to always find the maximum power point irrespective of the battery voltage.

inverter-off.png
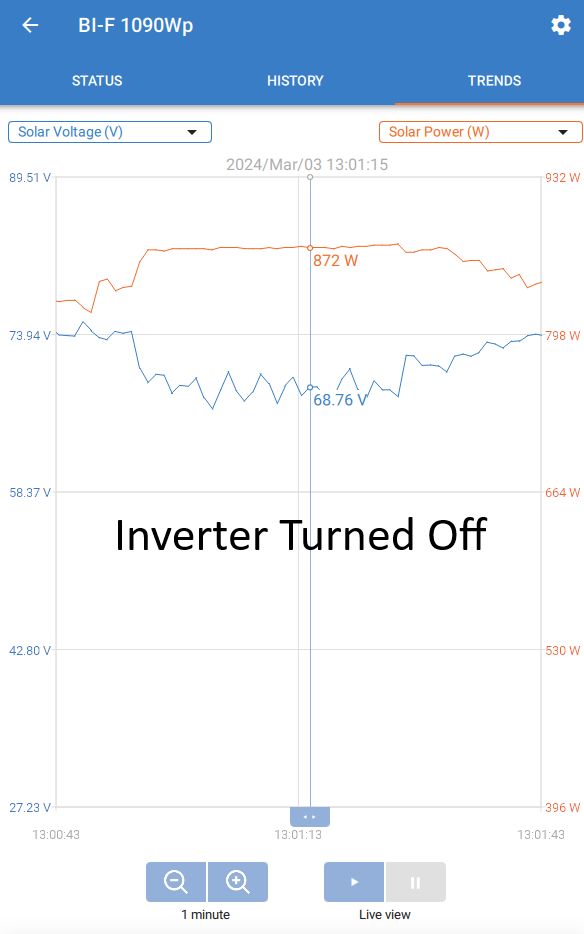
Could this be a faulty one that I have got, or this is how all the MPPTs work?


inverter-off.png (44.4 KiB)
2 |3000

Up to 8 attachments (including images) can be used with a maximum of 190.8 MiB each and 286.6 MiB total.

JohnC avatar image
JohnC answered ·

Hi @FuryJK98

I very much doubt there's anything wrong. The mppt doesn't track continuously. Only when it hasn't met it's target battery V, and then only every 10 minutes (if it's not interrupted). In your video it can be seen happening at 12:19:43 (the classic 'triple dip'), then again 10 min later.

What happens in between I've never seen published. Possibly some sort of PID control algorithm to keep things as smooth as possible. And not necessarily focused on Panel V alone. I suspect Output Amps might have some say there too. But I'm just guessing.

Try using Battery (Output) Amps vs Solar V in Trends, you're likely to see it much smoother. Might let you get a better feel for it without a W calculation making it look worse.

It might surprise that tracked V doesn't change as much as you might think over a day, even with passing cloud. Different at dawn & dusk, when weird things can happen - but little power to be had then anyway.


3 comments
2 |3000

Up to 8 attachments (including images) can be used with a maximum of 190.8 MiB each and 286.6 MiB total.

furyjk98 avatar image furyjk98 commented ·

Hi @JohnC , thank you for your response.


I have a 150Ah | 25.6V LFP battery, which has a maximum charging limit of 70 Amps set by the manufacturer. So the MPPT controller is running at its max charging amps, which is 50 Amps.

Now, the MPP Sweeping it does is pretty normal, and I do not have a problem with it. However, in the video, you can see that whenever I increase the load, the MPP voltage starts increasing, and keeps tracking less Watts than it was able to harvest at a lower voltage.

I have seen this behavior after the batteries get full in Float mode, where it adjusts its voltage from VOC to MPP to power the extra load that is needed based on the voltage drop.

Since it is bulk charging, and the batteries are not full, the MPPT is supposed to harvest the highest power that is available at that point of time. But it keeps tracking higher voltage which is not the optimal MPP for the panels, and gets fewer Amps.

You can see the below behavior from 12:29. The power harvest is more when there is less load and it becomes unstable as soon as the load is applied.
1709471527404.png

0 Likes 0 ·
1709471527404.png (183.6 KiB)
JohnC avatar image JohnC ♦ furyjk98 commented ·

@FuryJK98

You say "I have a 150Ah | 25.6V LFP battery, which has a maximum charging limit of 70 Amps set by the manufacturer. So the MPPT controller is running at its max charging amps, which is 50 Amps."

That's a nominal 1280W. So it's not pushing 50A. And if it was actually restrained at 50A it wouldn't be scanning for mpp. What's happening on the battery side with V, A and W is very relevant to what shows on the pv side.

0 Likes 0 ·
furyjk98 avatar image furyjk98 JohnC ♦ commented ·

Hi @JohnC , thank you for getting back to me.

The MPPT's limit would at 26V would be 26V x 50A = 1300W if that amount of solar is available. And the limit for the battery charging is 26V x 70A = 1820W.
So basically the battery can take the full 50 Amps if it comes from the charge controller.

From the VRM portal, I can see that most of the time the MPPT is hovering around 30A - 33A max, and does not go above that. So I am not being limited by the maximum Amp output of the MPPT
mppt.pngData from the same day of the above video/screenshot

0 Likes 0 ·
mppt.png (113.3 KiB)
Alex Pescaru avatar image
Alex Pescaru answered ·

Hi @FuryJK98

You don't say anything about your panels... From the pictures, seems to be some bifacial 1080Wp ??

Then those aprox. 800W is the limit of them, according to NMOT.

And towards upper limit, the behavior is very dependent on the intensity, because the panels heats up and the efficiency drops...

Alex

3 comments
2 |3000

Up to 8 attachments (including images) can be used with a maximum of 190.8 MiB each and 286.6 MiB total.

furyjk98 avatar image furyjk98 commented ·

Hi @Alex Pescaru,


You are right, I cannot accept anything more than 80% of the maximum power from the panels in the peak hours, since I live in a tropical region and most of the time the sun is at 70 degrees+ in altitude.

However, the issue I am facing is not getting more watts, but inconsistency in tracking maximum power point for the current state of the panels.

I have uploaded a new video (Click Here) where you can see if I completely turn off the load, and bypass the inverter, I get a stable power harvest. However, as soon as I turn on the load in the inverter, it looses that MPP tracking and harvests less power, and it's quite unstable.
inverteroff2.png

And I don't think it's the varying conditions, if it was, the results would have not been consistent. Maybe this started after a certain firmware update which might have gone unnoticed?

I have been a Victron user since December of 2023, and I noticed this bug a couple of weeks back and trying to find out answers for this unusual behavior.

0 Likes 0 ·
inverteroff2.png (104.8 KiB)
Alex Pescaru avatar image Alex Pescaru furyjk98 commented ·
When you go to bypass, where are those 800+W going? Because it seems a very stable consumption.

Maybe when you use the system for mining, maybe the power demand is not so linear and therefore the MPPT is trying to keep up with a variable load.

Also, it seems, indeed, that the tracker is struggling to find the MPP, this is why those ups and downs...


0 Likes 0 ·
furyjk98 avatar image furyjk98 Alex Pescaru commented ·

Hi @Alex Pescaru ,

I agree with your statement, I have seen the up and down behavior when the charger enters the float mode, where it harvests the power that is additionally needed by the load, and usually, the voltage stays somewhere between MPP and VOC of the solar panels.

However, since the batteries are not full, while the load is utilizing most of the power coming from the solar, there is no need for the MPPT to adjust its tracking to harvest less power,

When I turn on the generator, the inverter enters bypass mode, where any power coming from solar goes directly into the battery. Of the 892 Watts that is being harvested from solar, 840.87 watts is going into the Battery.

0 Likes 0 ·
furyjk98 avatar image
furyjk98 answered ·

Guys, I got an update.

Link to the video:
GAMMA+ MPPT
Victron MPPT 100 | 50

I tested this behavior on another MPPT controller to see if it is unstable while the load is on, and for recording the data I used a DC bi-directional meter and an IP camera.

The MPPT was tracking the MPP irrespective of the battery voltage, and there were no ups and downs and +5v behavior in the MPP tracking voltage like it happened in Victron.

I don't know how many others have noticed this. It's very easy to recreate this bug. Just have to look at the trends section in real time and change the loads and check for the Voltage increase and drop in Amps/Watts.

2 |3000

Up to 8 attachments (including images) can be used with a maximum of 190.8 MiB each and 286.6 MiB total.