question

vitaminus avatar image
vitaminus asked

Replicating vrm graph and getting underlying data

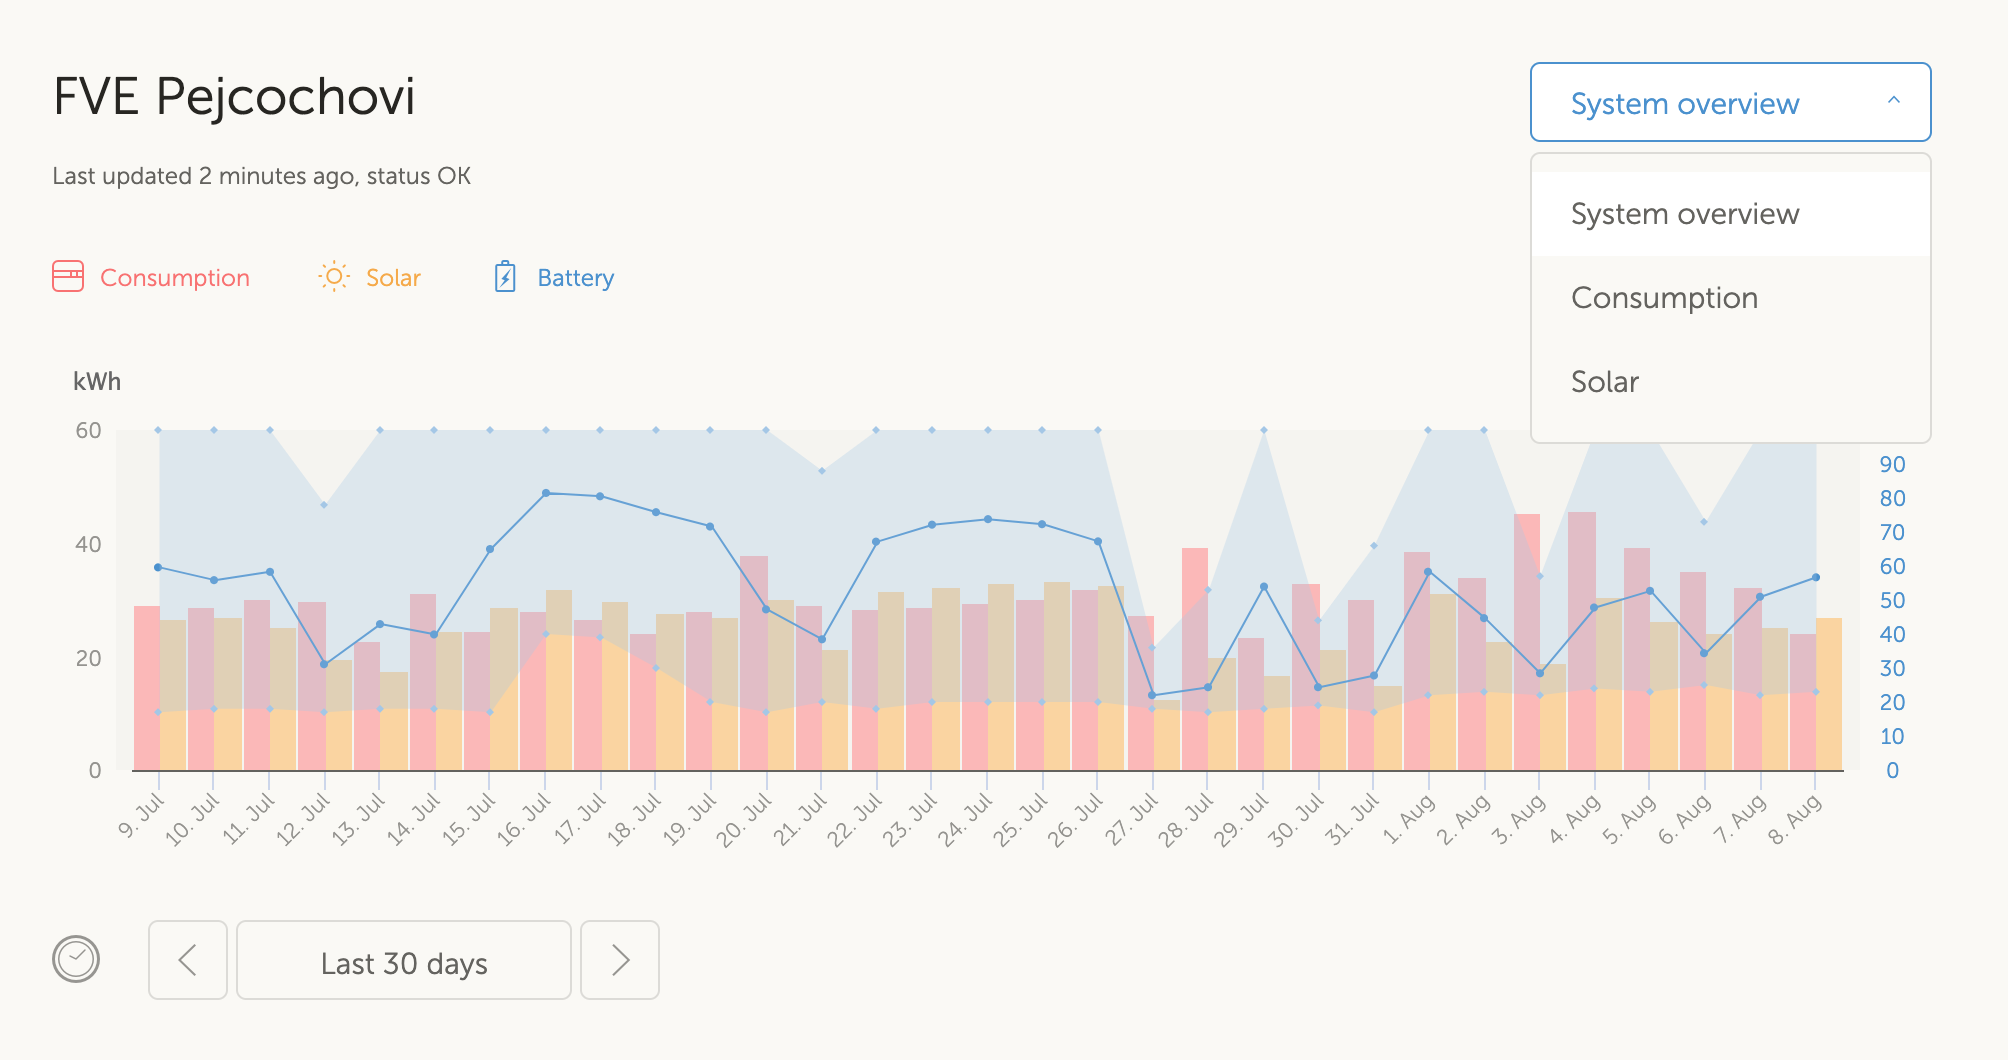
Hi, Im trying to replicate the graph, which is available at vrm portal. I want to implement it in my total house dashboard in Grafana, toghether with water, gas and other consumptions.

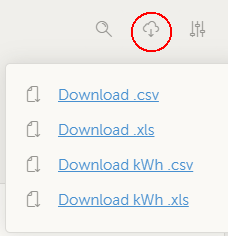
I was successfull in catching mqtt stream and filtering out ACTUAL data for battery SoC, AC load, PV yield etc..., which is great! Its a very nice substitute for remote console. Path for the actual data looks like this for example: N/<myid>/system/0/Ac/ConsumptionOnOutput/L1/Power

Its very difficult to replicate the historical data though. Could you share, how you compile the graph and how you get the data? It would be a great help.

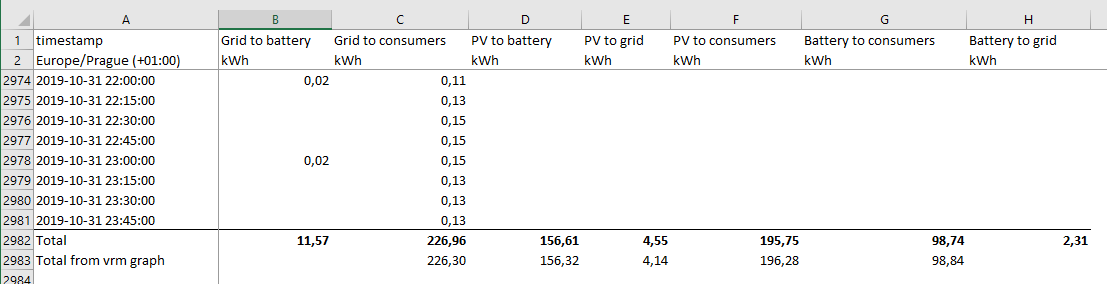
If I subscribe to this message, N/<myid>/solarcharger/256/History/Daily/0/Yield, I get slightly different numbers then in vrm graph. Even if I check some days back (Daily 1, Daily 2 etc) its always different. Also, I cant find data for the total AC consuption of the installation, total power to battery, from battery, direct use....

Thanks!

Vit

VRMMQTT
2 comments
2 |3000

Up to 8 attachments (including images) can be used with a maximum of 190.8 MiB each and 286.6 MiB total.

I have moved this question to the modifications space.

0 Likes 0 ·
vitaminus avatar image vitaminus commented ·

Hi, nobody has a clue? :-) I thought this would be the easiest one but it turns out to be the most tricky one... All data are in influx and grafana except these.

0 Likes 0 ·
2 Answers
nigelfxs avatar image
nigelfxs answered ·

Have you looked at the "Download kWh" data that you can download from the Advanced page? This may give you some more info on how the totals are calculated.


Have you looked at the following topics (the equipment IDs may be different)?

N/<myid>/solarcharger/256/Yield/System

N/<myid>/vebus/257/Energy/InverterToAcOut

N/<myid>/vebus/257/Energy/AcIn1ToAcOut

N/<myid>/vebus/257/Energy/AcIn1ToInverter

N/<myid>/vebus/257/Energy/InverterToAcIn1


clipboard02.png (6.0 KiB)
2 |3000

Up to 8 attachments (including images) can be used with a maximum of 190.8 MiB each and 286.6 MiB total.

vitaminus avatar image
vitaminus answered ·

Thanks! I downloaded the data you suggested and it was exactly what I wanted! Its still different from the data in my graph - you can have a look at the bottom of the screenshot. The difference si minor though, so I can live with this. It is data for the last month - October 2019.


The trouble is, how to get these data via MQTT to my influxdb and grafana. One option is to to get the increments (as in the screenshot), other would be some constantly growing number and grafana will do the job to show just the increments. Besides topics you are mentioning, I found some more - https://community.openhab.org/t/mqtt-1-x-2-x-interface-to-victron-ccgx/43888/5


However, I can´t make any sense of it. I have no clue what these numbers are. For example this topic:

N/<myid>/solarcharger/256/Yield/System returns - "{"value": 3907.39990234375}" and this number is growing in time. Its probably kWh

N/<myid>/vebus/257/Energy/AcIn1ToInverter - "{"value": 9.2296533584594727}"

N/<myid>/vebus/257/Energy/AcIn1ToAcOut - "{"value": 163.11181640625}"


In this screenshot are data for the overall lifespan of the installation. It was installed in April and during this time 1 321 kWh was drawn from the grid. A number which is nowere to find in any topics.


The most important number for me is "Grid to consumers" as it drives my utility bill and I want to have it shown in openhab and elsewhere.


Thanks!


vrm-data.png (17.4 KiB)
vrm-data-all.png (7.9 KiB)
1 comment
2 |3000

Up to 8 attachments (including images) can be used with a maximum of 190.8 MiB each and 286.6 MiB total.