I noticed this morning that my graph on VRM does not show the "charge (grid)" consumption in the scales.
For reference, I was off-grid until 2 am this morning and used the Grid to charge my batteries from roughly 60% to 100%. The charge ended at approximately 3:30 am. I am running ESS.
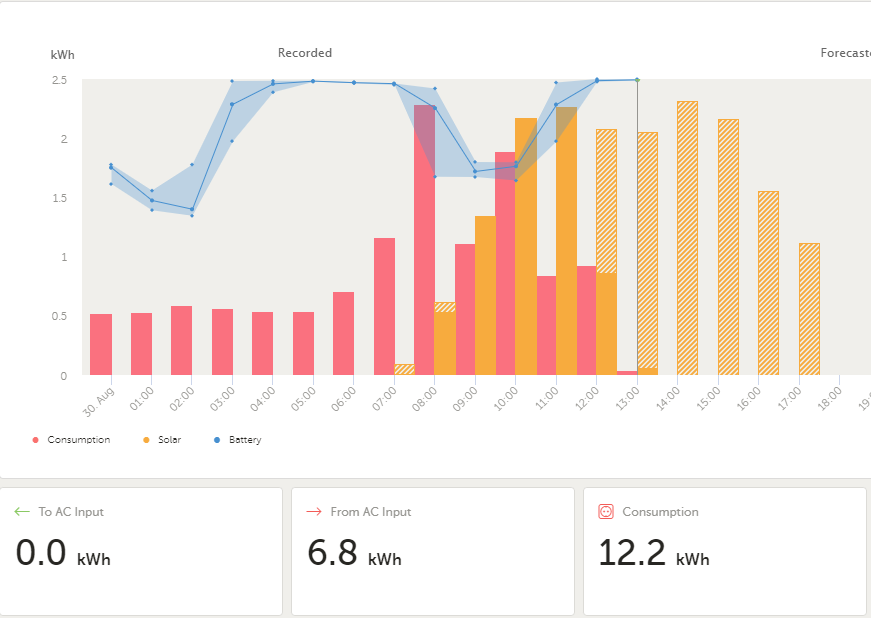
As shown in the picture below (image 1), the RED consumption is normally a combination of solar and grid-in. Obviously no solar production between 2 am and 4 am, but the red bars stays flat at 0.5 kWh between 2am and 4am.
If I make a guesstimate, I consumed 2.3 kWh (grid) to top up the pack but it seems that it is not registered on the Grid - in consumption as the red lines stay flat.
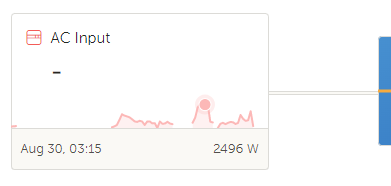
Also, if I check the top icon display (as shown in image 2 below), it did registrar that it consumed 2.5 kW for just over one hour.
I am just checking if this is the case that VRM might have glitch? Unless "AC input" (top display icon in VRM) is not the same as "from AC input" bottom display icon.
Image 1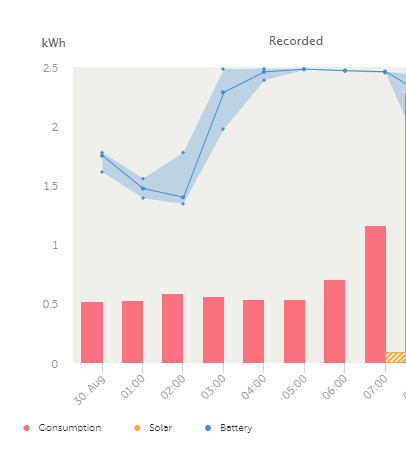
Image 2