I've recently purchased a campervan fitted with an Orion Smart 12v/12v-18A Isolated, Smart Solar MPPT 75/15 and a non-Vitron mains charger. I’ve only recently found out that I can connect to my Vitron components using Bluetooth so it’s all a learning curve for me!
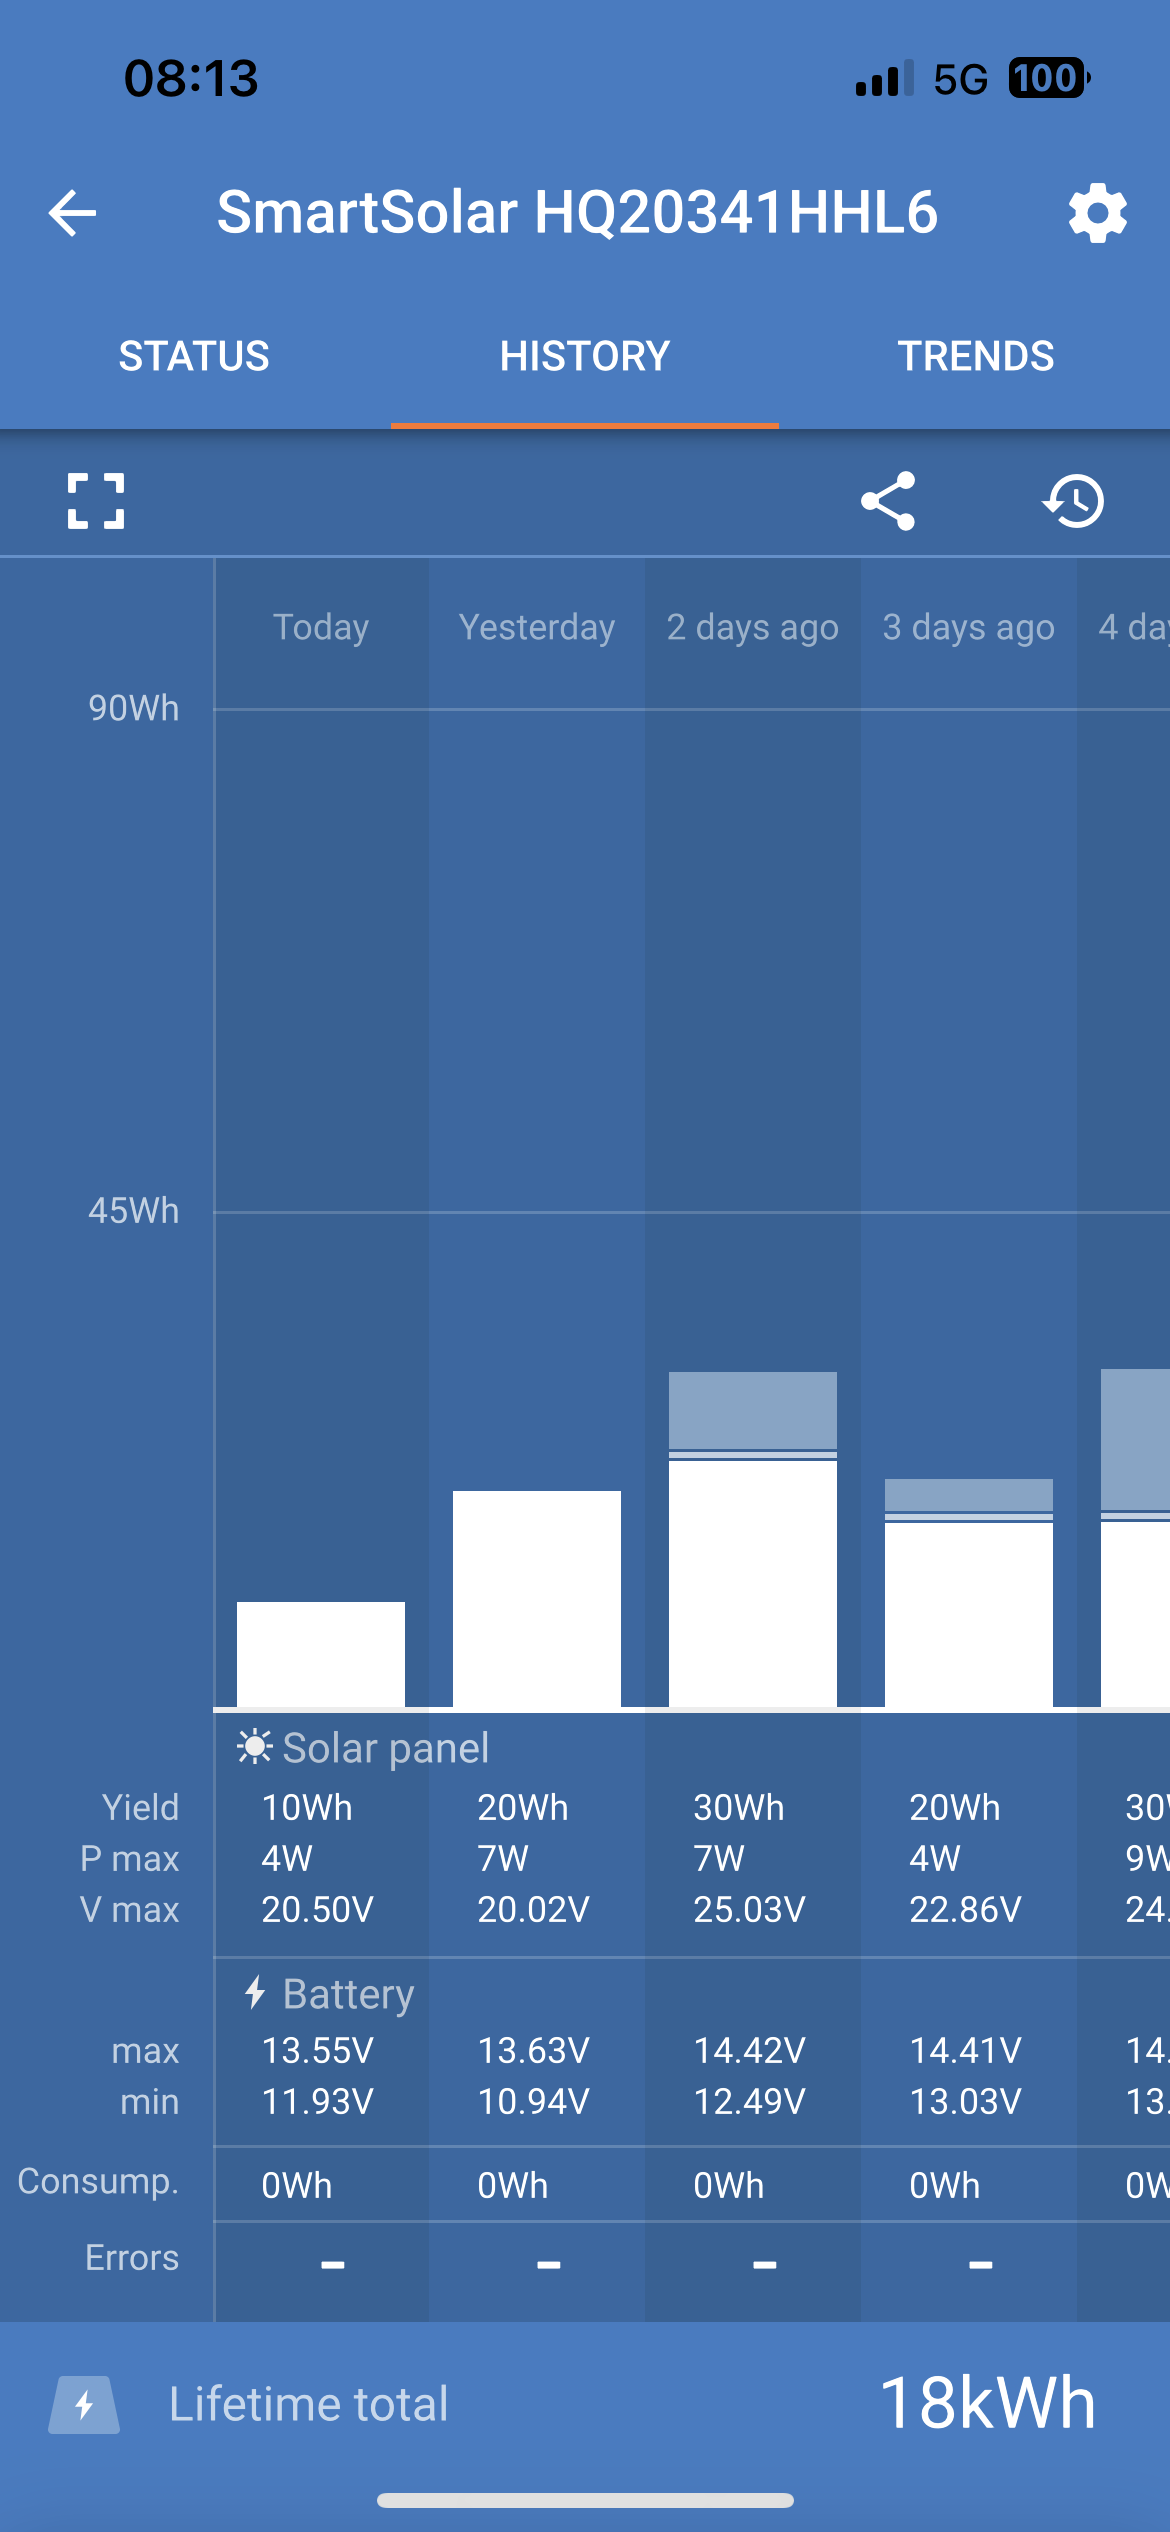
The scenario outlined on the attached graph is that the van is usually parked up with no load on the leisure battery. On Friday ('2 days ago'), I made a long journey and connected to 240v hook-up and turned on the fridge, expecting the 240v charger to maintain the charge in the battery. Saturday night and the fridge was struggling for voltage despite the van being hooked up.
Turning the hookup mains on and off reset the 240v charger and it started charging the battery.
However, it was a sunny weekend and the 12v Dometic fridge may have been working harder than the solar could cope with but, although I don’t know the actual wattage power of the solar panel, if the voltage was dropping on the battery, should the panel have stepped up output? What would that have looked like on the graph?
To me, there was obviously an issue with the mains charger but I'd be interested to understand whether my solar panel is past it's best, too small or there's potentially another factor that was limiting it's ability to maintain enough charge to support the fridge.