question

markusn avatar image
markusn asked

ESS DC efficiency very low

Good Day! I set up my ESS roughly 1 1/2 months ago. It looks like this:

1 MultiPlus-II 48/5000/70-50
1 SmartSolar MPPT RS 450-100 with roughly 4kwp connected to one of its MPPTs
1 Pylontech US5000.

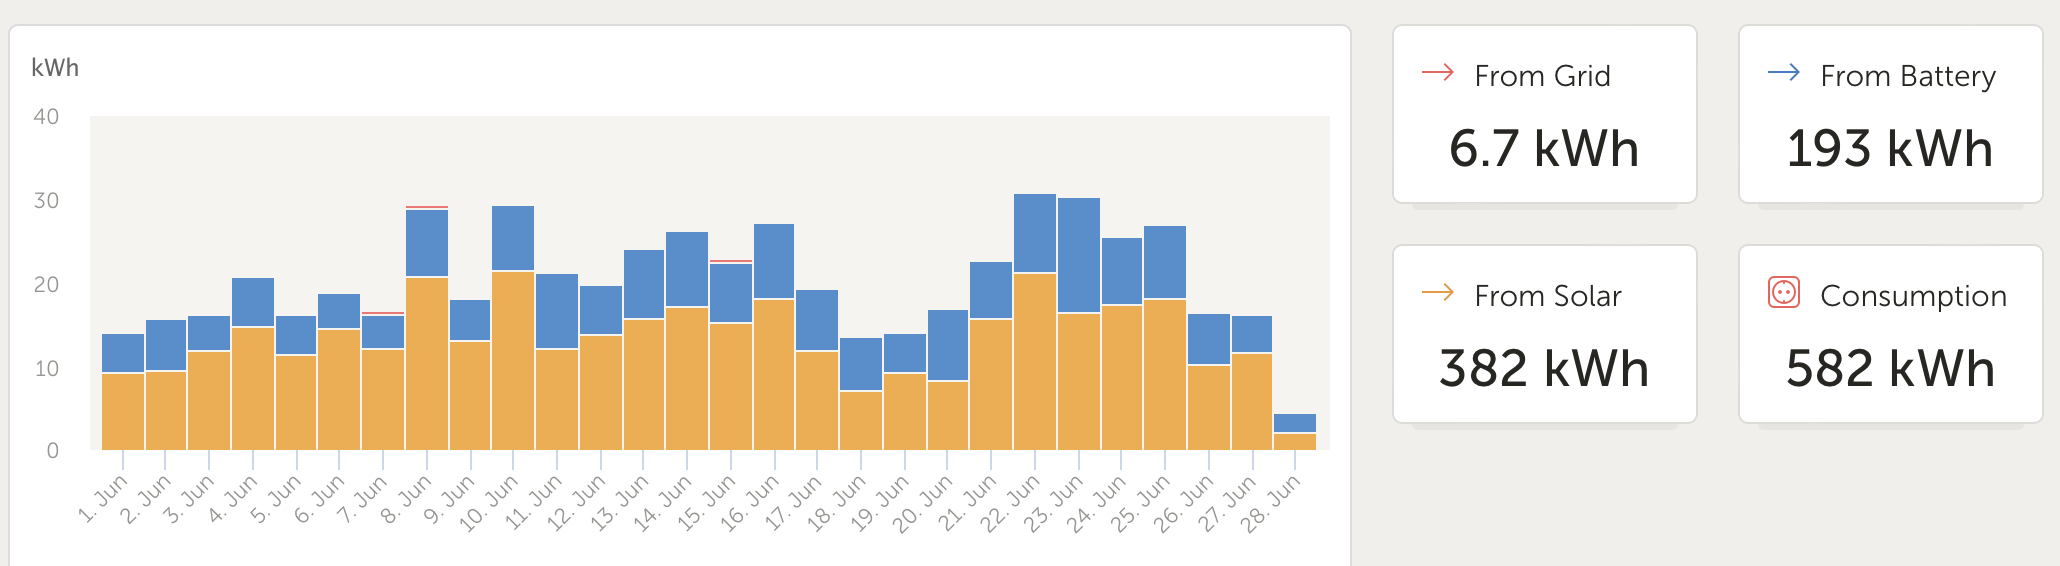
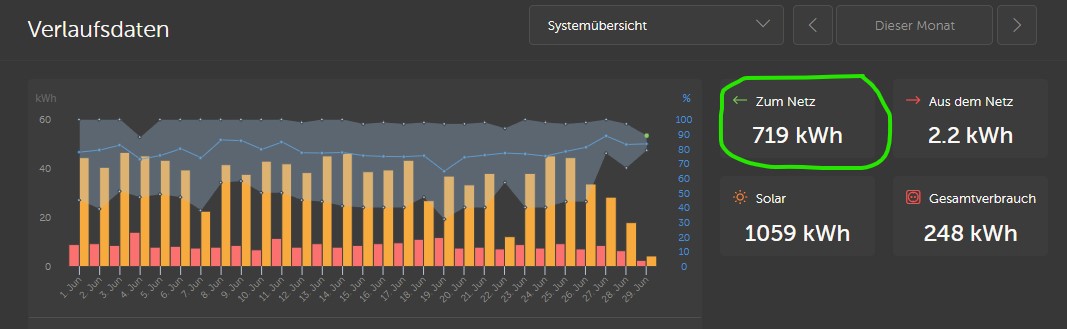
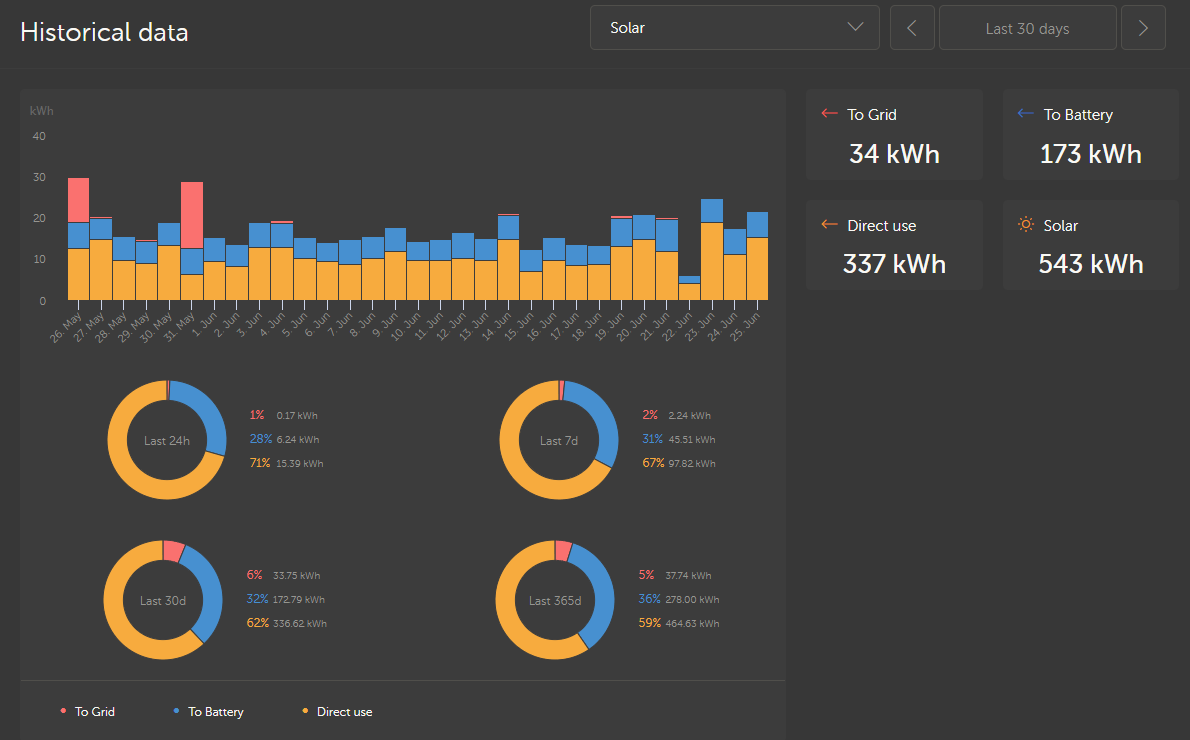
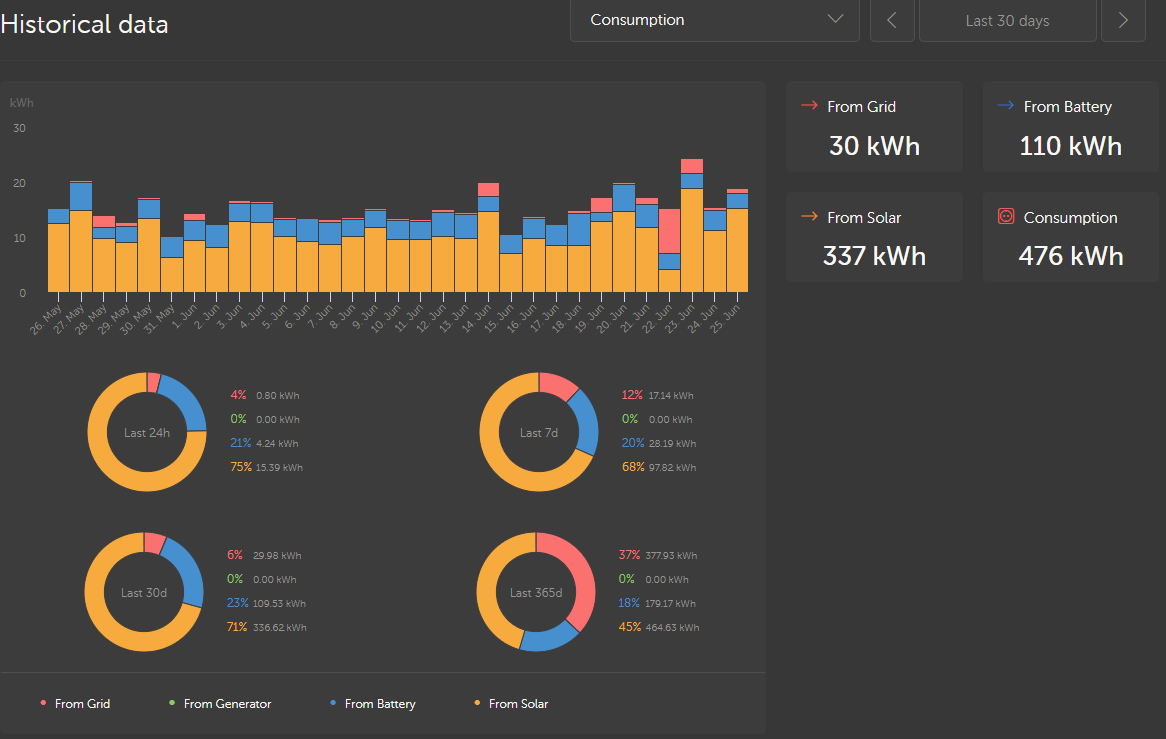
I did not opt for a shunt or any additional battery monitor. No AC-coupled PV. MP2 is connected via AC-In only. Everything is working fine so far, in the last 30 days I consumed 476 kWh, from which only 31 were bought from the grid. Now I was curious about the efficiency of the whole system, especially when it comes to the battery. Now, the Pylontech BMS does not seem to offer any history (charged/discharged kWh), so I have to take the numbers that I get from Victron.


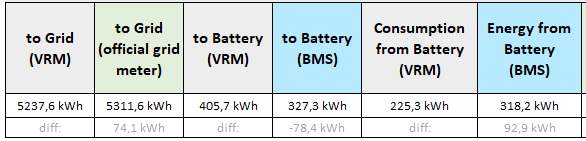
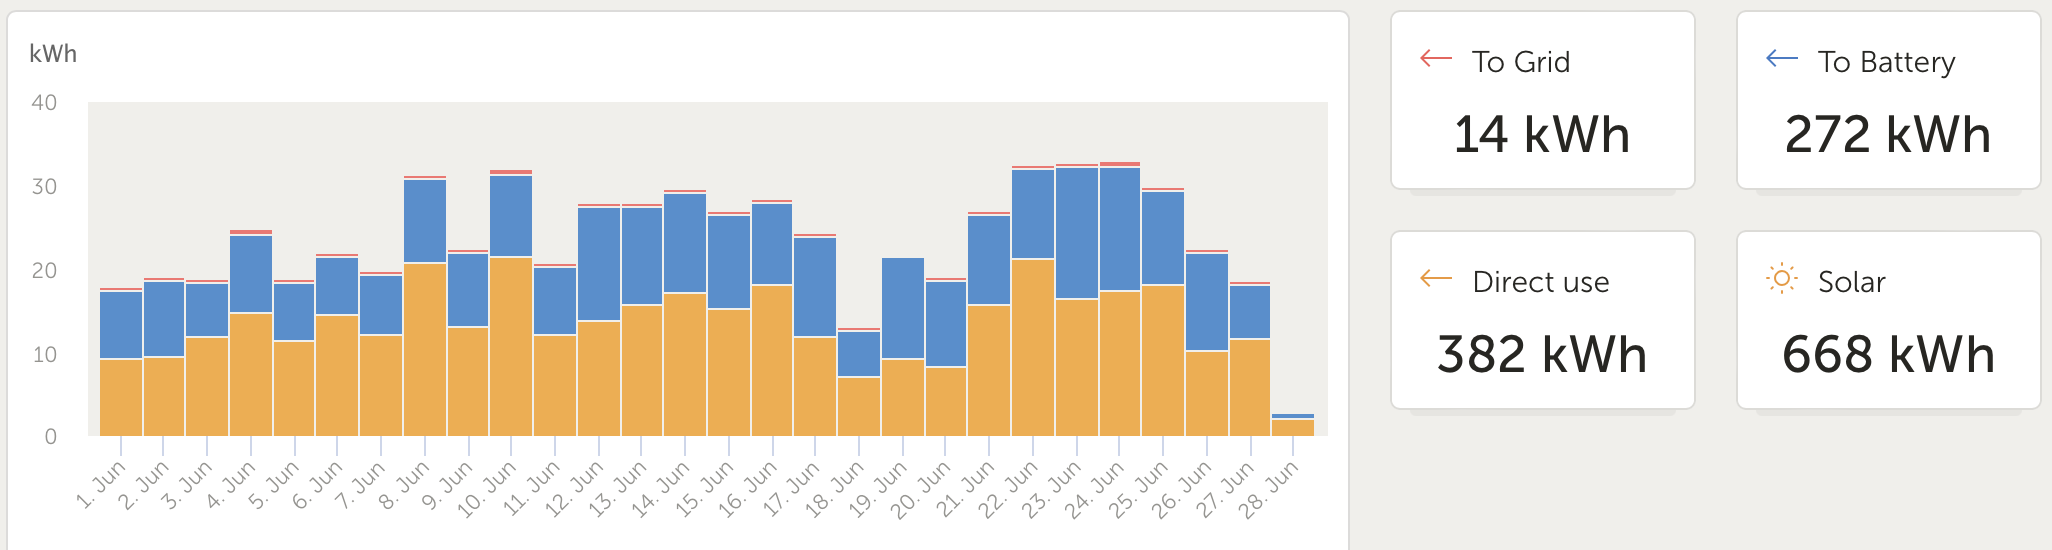
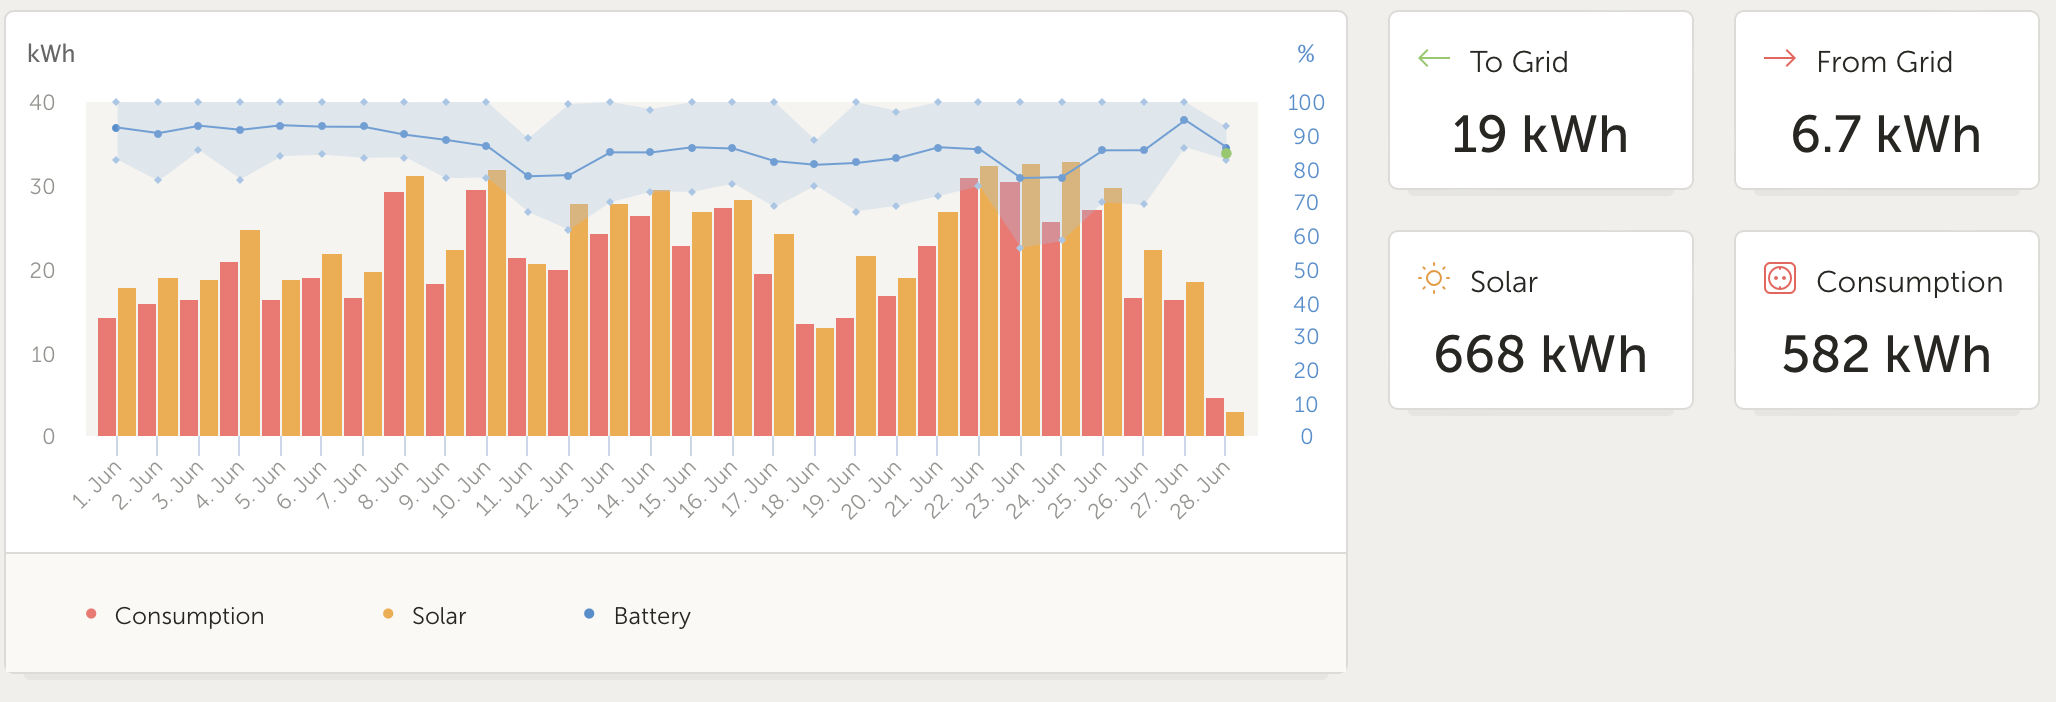
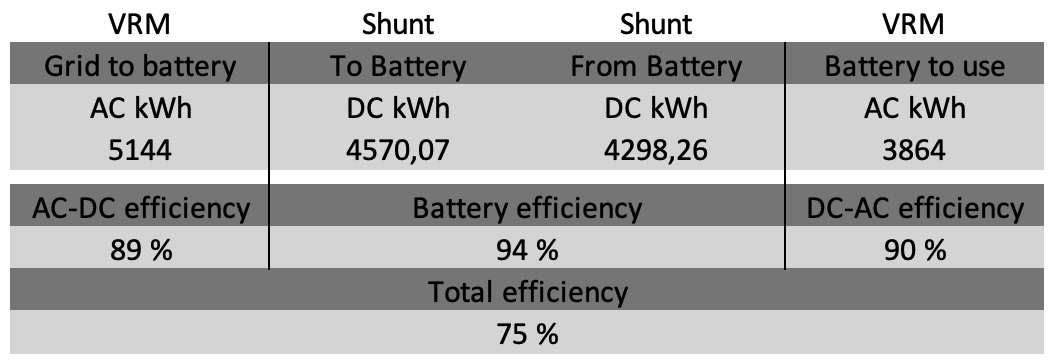
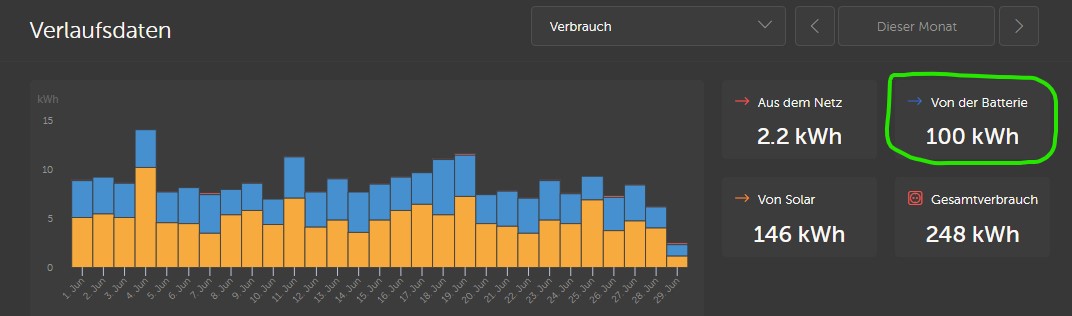
According to the VRM, during the last 30 days 173 kWh where charged into the battery, and 110 kWh were discharged. That would equate to less then 64% efficiency, which would be very low for a DC coupled system.

solar.pngconsumption.png

Am I looking at the wrong numbers? Are those just estimates, and the real values might be very different?

Greetings
Markus

ESSPylontech
solar.png (53.2 KiB)
consumption.png (56.6 KiB)
1 comment
2 |3000

Up to 8 attachments (including images) can be used with a maximum of 190.8 MiB each and 286.6 MiB total.

nickdb avatar image nickdb ♦♦ commented ·
What is your total "to grid" number in the overview.

Most common error when interpreting dashboard numbers, is failing to use the data from all three display tabs, including the overview, which gives part of the picture.

1 Like 1 ·
7 Answers
t81s avatar image
t81s answered ·

This apperntly bad DC efficiency also bothered me for a while. To check the VRM numbers, I captured all relevant mesuremwnts from the Venos OS, via Modbus, into a database.

From this data I can say the efficiency is much better than what the VRM data is showing. I have the strong suspicion that all the system loses are going into the VRM measurement “to Battery”.

But that is only true for the Venus OS version 2.x.

Since Venus OS 3.0 the VRM measurements “from Battery” and “to Battery” are matching with the data I captured. Now the losses seam to be added to the “Consumption” measurement.

1 comment
2 |3000

Up to 8 attachments (including images) can be used with a maximum of 190.8 MiB each and 286.6 MiB total.

markusn avatar image markusn commented ·

Hmm. I am running 3.0 on my cerbo for at least a week now. For the last 7 days, it looks even worse. 47 kWh charged, 26 discharged. Less then 55% efficiency, yay.

0 Likes 0 ·
pedaaa avatar image
pedaaa answered ·

I also see the same issue.

Therefore i am currently observing the issue, by integral calculating the BMS data.

So i can compare, what energy the BMS thinks goes in and out of the battery VS. what VRM thinks.

And there is a HUGE difference!!


for example i found out, that VRM does not count any engergy that is fed into grid from battery.

I usually have a lot of energy fed into grid from battery, as a i use a negative gridsetpoint of -150 to -300W, just to have minimal energy import from the grid.


so this is the data of the last ~30days:

1687809544331.png


As you can see... there is super big difference between VRM and BMS data...

Also i have data from my official grid meter, on which i get charged. So i consider this as the absolut correct value.


So...

VRM does miss 74,1kWh "into Grid"

On the other hand, VRM counts way too much energy into battery.

My assumption is, that VRM just adds this missing 74,1kWh to the "to Battery" value.


So, if i subtract these 74,1kWh from 405,7kWh, i get 331,6kWh, which is pretty close to the BMS calculated value of 327,3kWh.

And if i compare this with the 318,2kWh that the BMS thinks went out of the Battery, this would lead to 96,0-97,2% efficieny in/out of the Battery. This seems somehow realistic, isn´t it ?


But ultimately... VRM does count very wrong!!

Maybe someone from Victron can say something about this?

Maybe @Guy Stewart (Victron Community Manager) does know more about this?


additional information:

I did use Firmware V3.00-37 for capturing this data.

I will update now to latest "official" release of V3.00, and continue to observe


1687809544331.png (10.3 KiB)
2 |3000

Up to 8 attachments (including images) can be used with a maximum of 190.8 MiB each and 286.6 MiB total.

janieronen avatar image
janieronen answered ·

There is my example figures from the VRM for this year. I have beaten my batteries quite hard some days so inverters have been charging max current and therefore not optimal efficiency. System idea is also heat my workshop during winter with efficiency losses and at summer I use more optimal charge settings. I am happy with 90% charge and discharge figures :)


Please look your efficiency loss more closer as there is multiple steps when looking roundup efficiency. screenshot-2023-06-27-at-03327.png


2 comments
2 |3000

Up to 8 attachments (including images) can be used with a maximum of 190.8 MiB each and 286.6 MiB total.

pedaaa avatar image pedaaa commented ·
looks like you are not feeding in very much to grid, isnt it?

I think the more you feed in, the greater the VRM numbers drift off?!

0 Likes 0 ·
janieronen avatar image janieronen pedaaa commented ·
True. Only 133kWh fed to grid this year so its possible Grid-Feed mess up calculation some how.
0 Likes 0 ·
pedaaa avatar image
pedaaa answered ·

has anyone else here checked the "to battery" vs "from battery" efficiency?


i would be interessted in your numbers, if you have an ESS and also feed into grid

1 comment
2 |3000

Up to 8 attachments (including images) can be used with a maximum of 190.8 MiB each and 286.6 MiB total.

integer63 avatar image integer63 commented ·

My ESS (3 phase 10k) is not yet connected to the grid so is running solely on solar and battery for about 3 months now. As you can see the efficiency would be about 74% :-( Which can't be the case with Pylontech batteries connected:

from-batt.png

to-batt.png

0 Likes 0 ·
from-batt.png (35.1 KiB)
to-batt.png (33.7 KiB)
nickdb avatar image
nickdb answered ·

When you are trying to work this out, you need to add the "to battery" from both the solar and the grid tabs in the dashboard.

You can then compare this to the "from battery" in the consumption tab.

On an ESS, mine equates to just on 20% losses, bearing in mind the built in metering isn't 100% accurate.

Also, the "to grid" usage in the solar tab, is not equated directly to PV or battery, so something may being lost there as the system unlikely tracks it down to that granularity.


1 comment
2 |3000

Up to 8 attachments (including images) can be used with a maximum of 190.8 MiB each and 286.6 MiB total.

pedaaa avatar image pedaaa commented ·

i don´t charge anything from grid into battery, so there is nothing to add.

Its even the other way round, if you look it my figures. VRM counts way too much into battery. That values can´t be true. They are WAY OFF!

I have good comparison, because i have the data directly also from the BMS, so i clearly see, what is acutally going into the battery.

That is clearly not just inacurate metering. There is some wrong calculation build into VRM, or its moving "missin" energy to wrong columns or similar.

Especially if there is much feed into grid involved.


0 Likes 0 ·
caesium avatar image
caesium answered ·

The VRM numbers for "From Battery" and "To Battery" seem way off to me.

Here's what I have shown for this month so far:

screenshot-2023-06-28-at-094543.png

screenshot-2023-06-28-at-094555.png

And just for completeness the Overview and Grid too:

screenshot-2023-06-28-at-094619.png

screenshot-2023-06-28-at-094607.png


So I see 193kWh from vs 272kWh to, an apparent 71% efficiency. My ESS is set to about -30W setpoint so I avoid importing as much as possible, the grid is basically idle and has been all month.

However, I also have a BMV-712 and this shows completely different numbers from VRM. For same time period as above (I log all this to InfluxDB/Grafana so can pull out any time range at will) I'm seeing 251kWh into the battery (DIY LF280K stack), and 246kWh out. That's a far more palatable 98% efficiency.

Obviously the BMV figures are DC, it has nothing else to measure. I absolutely believe the BMV-712 figures, they're on par with what I'd expect. The VRM figures I'm guessing are perhaps showing AC figures, so after conversion losses both ways, which explains some of the loss of efficiency?


7 comments
2 |3000

Up to 8 attachments (including images) can be used with a maximum of 190.8 MiB each and 286.6 MiB total.

janieronen avatar image janieronen commented ·

Agree with you that VRM energy calculation at historical data partition includes AC-DC and DC-AC conversions. How ever all figures can be found from exporting kWh from Advanced page. That gives exactly same figures than my home assistant energy calculation from actual power measurements.

screenshot-2023-06-28-at-123203.png

0 Likes 0 ·
pedaaa avatar image pedaaa janieronen commented ·

which widget parameters are you exactly using for gathering these data?


are you using these VE-Bus Systems data, and count it daily, or how do you do?

1687951301823.png

0 Likes 0 ·
1687951301823.png (23.9 KiB)
Alexandra avatar image Alexandra ♦ pedaaa commented ·

Are you all forgetting the VE bus does not have a shunt to measure power being processed by it?


If you want accuracy you need shunt measuring in all directions.


Pylontec batteries are not very efficient have seen that in practice. Even in offgrid set ups. Where there is no to and from the grid

1 Like 1 ·
janieronen avatar image janieronen pedaaa commented ·

@Pedaaa I do take DC data from Lynx shunt, not VE-bus and grid & AC consumption metering purposes I have two EM24 meters. When adding solar I am planning to use additional smart shunt for these. Connection is modbusTCP from Cerbo GX and request data every 3 seconds from these specific devices and calculate energy based current power value. Home assistant have Riemann Sum calculation for quite accurate energy calculation based power over time. Then have utility meters to sum up daily figures in example.


That match to advanced page export "Download kWh.csv" within 1%. You do not need to source data to advanced page to get all values exported. You will get these fields automatically:

timestamp, Solar Yield (delta), Grid to battery, Grid to consumers, PV to battery, PV to grid, PV to consumers, Battery to consumers, Battery to grid, Genset to consumers, Genset to battery,Gas.

0 Likes 0 ·
pedaaa avatar image pedaaa janieronen commented ·

ah OK, i have an EM540 for grid metering,

and on the DC-side, i use BSLBATT Batteries, that communitcate their Battery measurements via BMS-CAN to the Cerbo.

No smartshunt.

But i am not sure, if VRM uses this BMS-CAN data at all, or if it only uses its internal VE-Bus estimations? But thats a good hint -> maybe this causes such a big deviation?

Possibly adding a smart shunt would then help for better accuracy?!

But it would be bad on the other hand, as there is already somehow exact BMS data available, and VRM maybe just does not use it?

0 Likes 0 ·
pedaaa avatar image pedaaa pedaaa commented ·

also, i will doublecheck with the "Download kWh.csv" data. Maybe this also gives some more ideas what is happening here

1 Like 1 ·
pedaaa avatar image pedaaa pedaaa commented ·

OK... i have done now the .csv download, and did comparison.

But the Data shown in Excel is exactly the same, as shown in VRM.

Only one thing is different:

There is also a column called "Battery to Grid" and this shows pretty accurate the missing energy. This is almost exactly the same as from my other data sourced.


Also, i have to admit, i never noticed, that the "to grid" value from Overview-Tab actually DOES INCLUDE "Battery to Grid" already...

Never really doublechecked this before, as i always looked at the Solar-Tab "to grid" value. Which does not include "Battery to Grid"


So far so good...

But still my "PV-to-Battery" values are way to high!!

Either i have really high losses through my DC-cables (might be??), or the VRM measurement is somehow inaccurate?!


Can anyone here confirm, how VRM is calculating this "PV-to-Battery" data, if no smart shunt is used??

Is it looking also at some BMS-CAN data at all? Or is it simply using internal estimation?


0 Likes 0 ·
cacer avatar image
cacer answered ·

@Pedaaa an i talked about this wrong VRM-counting since a few weeks,

because i also got very bad/wrong batteryefficiencys.


it seems that VRM is definatly not counting energy that is pushed to the grid from battery.


if you just compare energy to battery with energy from battery, there is clearly a calculationproblem in VRM:

here an extreme example, with massive grid feed in from battery :

in june VRM tells me i used

100 kWh from battery and

290 kWh to battery.

-> 34,5 % efficiency


VRM says:

623 kWh feed in from solar, but

719 kWh feed in in the overview.


if i add (719 - 623 =) 96 kWh to the 100 kWh "from the battery", it looks more normal:

196 kWh from battery and

290 kWh to battery

-> 67,5 % efficiency

this is looking more real.


ubersicht-2023-6.jpg

verbrauch-2023-06.jpg

solar-2023-06.jpg


1 comment
2 |3000

Up to 8 attachments (including images) can be used with a maximum of 190.8 MiB each and 286.6 MiB total.

pedaaa avatar image pedaaa commented ·

yes, i got the same conclusion.

you definitly need to add those 96kWh to the 100kWh.

then everything makes sense again.


But.... there is still more to consider:

I guess these 96kWh (=battery to grid) also already include the DC-to-AC conversion losses through the multi.

So the basic to battery / from battery efficiency would look a little bit better, than it seems.

But we possibly need a smart shunt, to get "real" values


I have at least the additional BMS data, that i can include in the calculations.

Then i get these numbers for June:


from MPPT RS to Battery: 82,2% DC charging efficiency

in Battery / out of Battery: 97,0% battery efficiency

Battery to AC: 96,2% DC-AC efficiency

Total: 76,7% DC to DC to Battery to AC efficiency


This starts to look "somehow" realistic, but think BMS/VRM data still drift off a bit here.

I assume MPPT RS to Battery data should look better in real life and DC to AC data should look worse in real life

0 Likes 0 ·