question

Drew McIntyre avatar image
Drew McIntyre asked

Charging Rate is Restricted by MPPT Controller

Greeting,

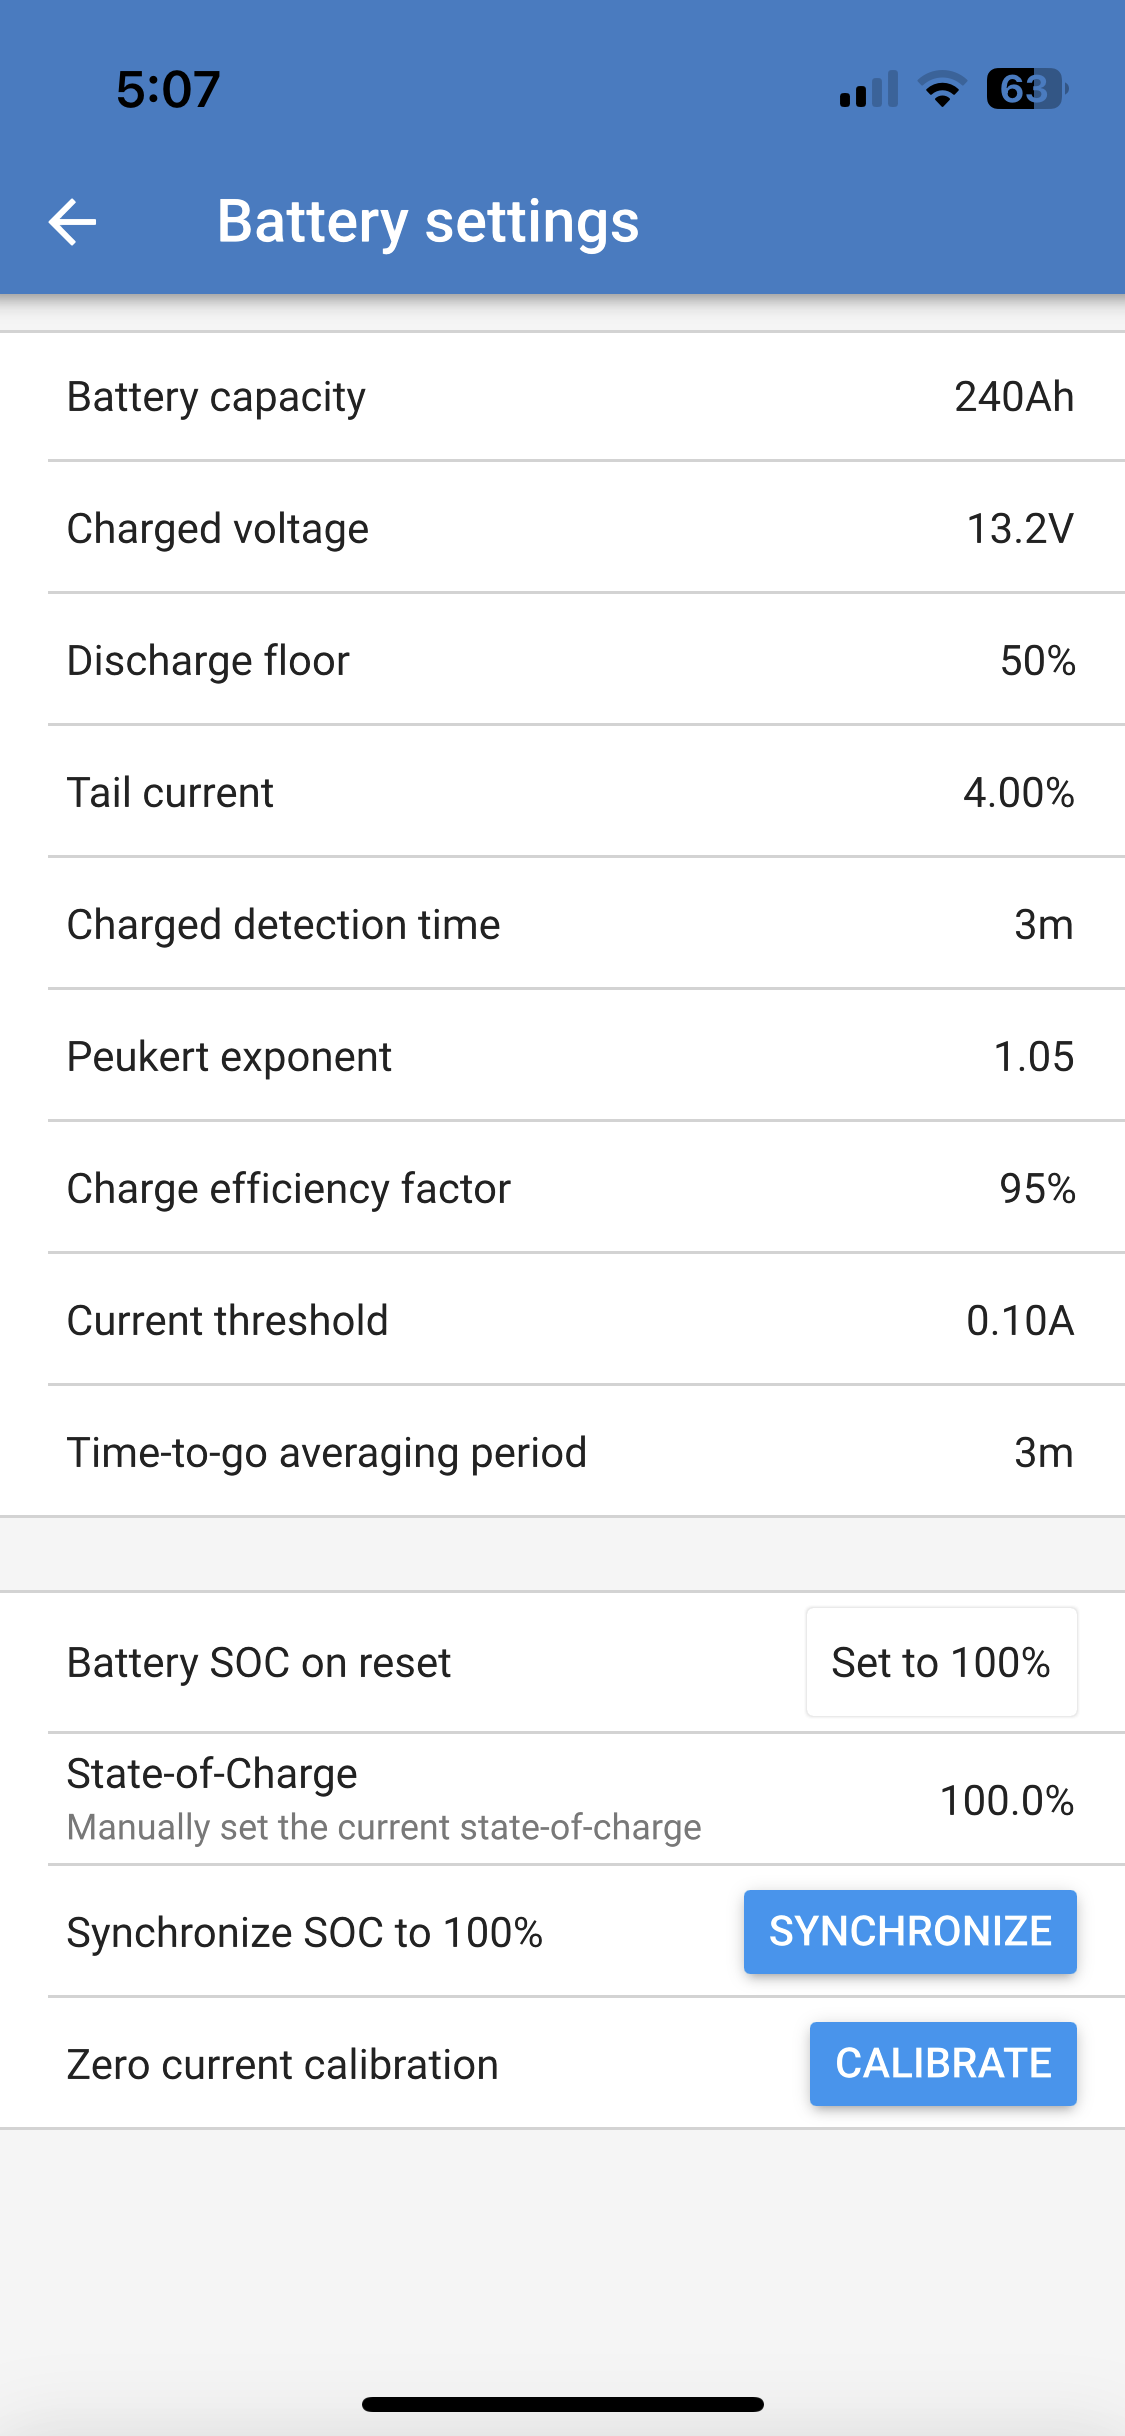
I have been successfully RVing with my trailer that has 2-100 W PV panels, 1- MPPT 150/30 charge controller (with Smart Battery Sense wireless V and T sensors) and 2- 12 V lithium batteries.

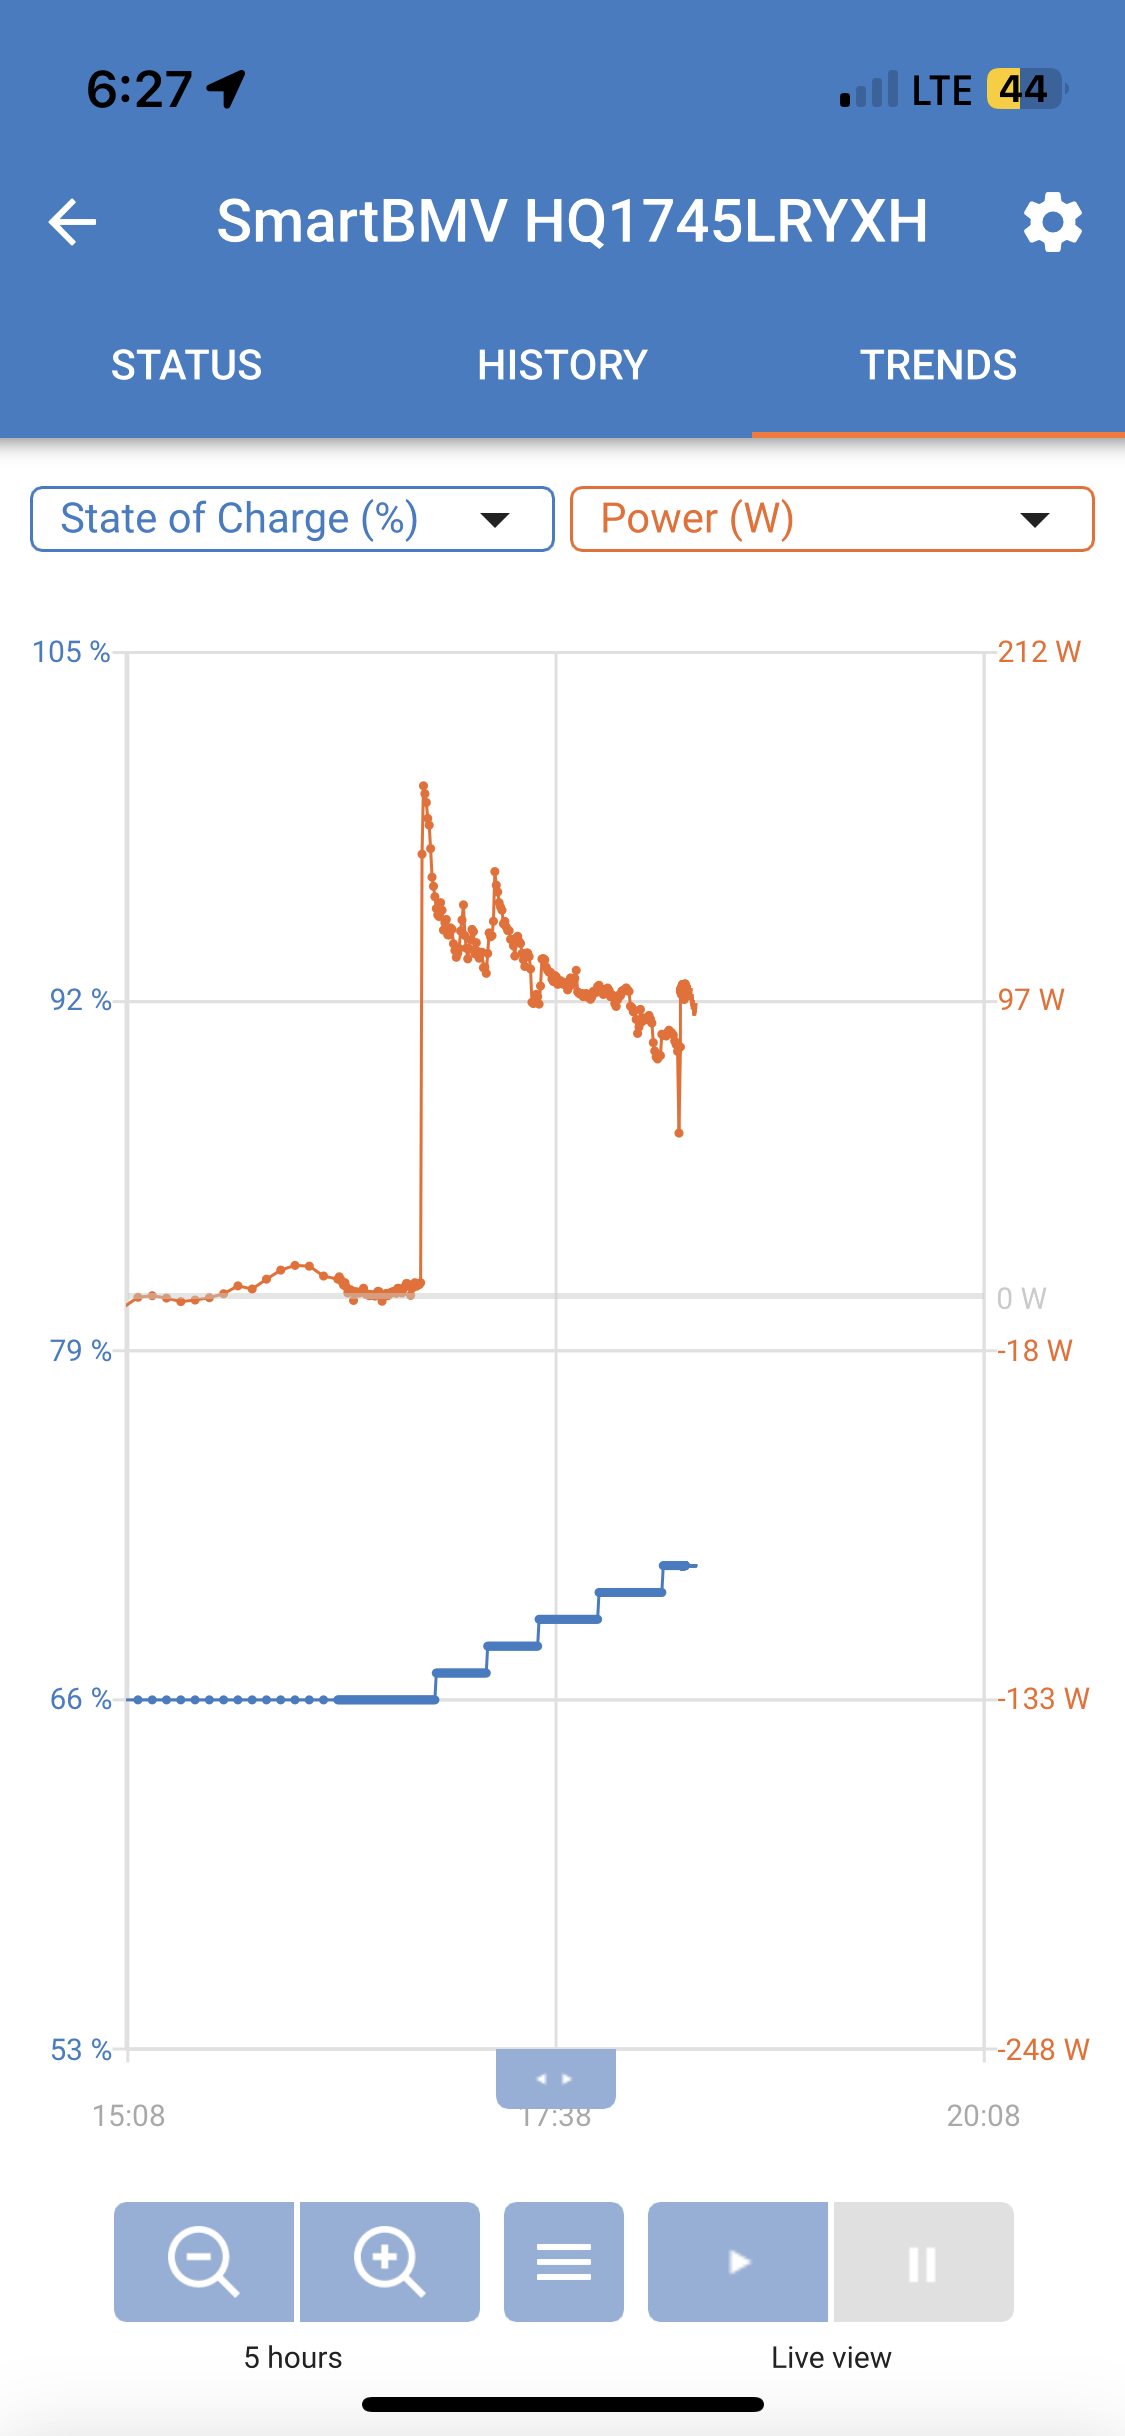
During our last RV camping trip I needed to run our portable 2200w generator due to trees shading the PV panels. The batteries were at 66% capacity.

The problem:

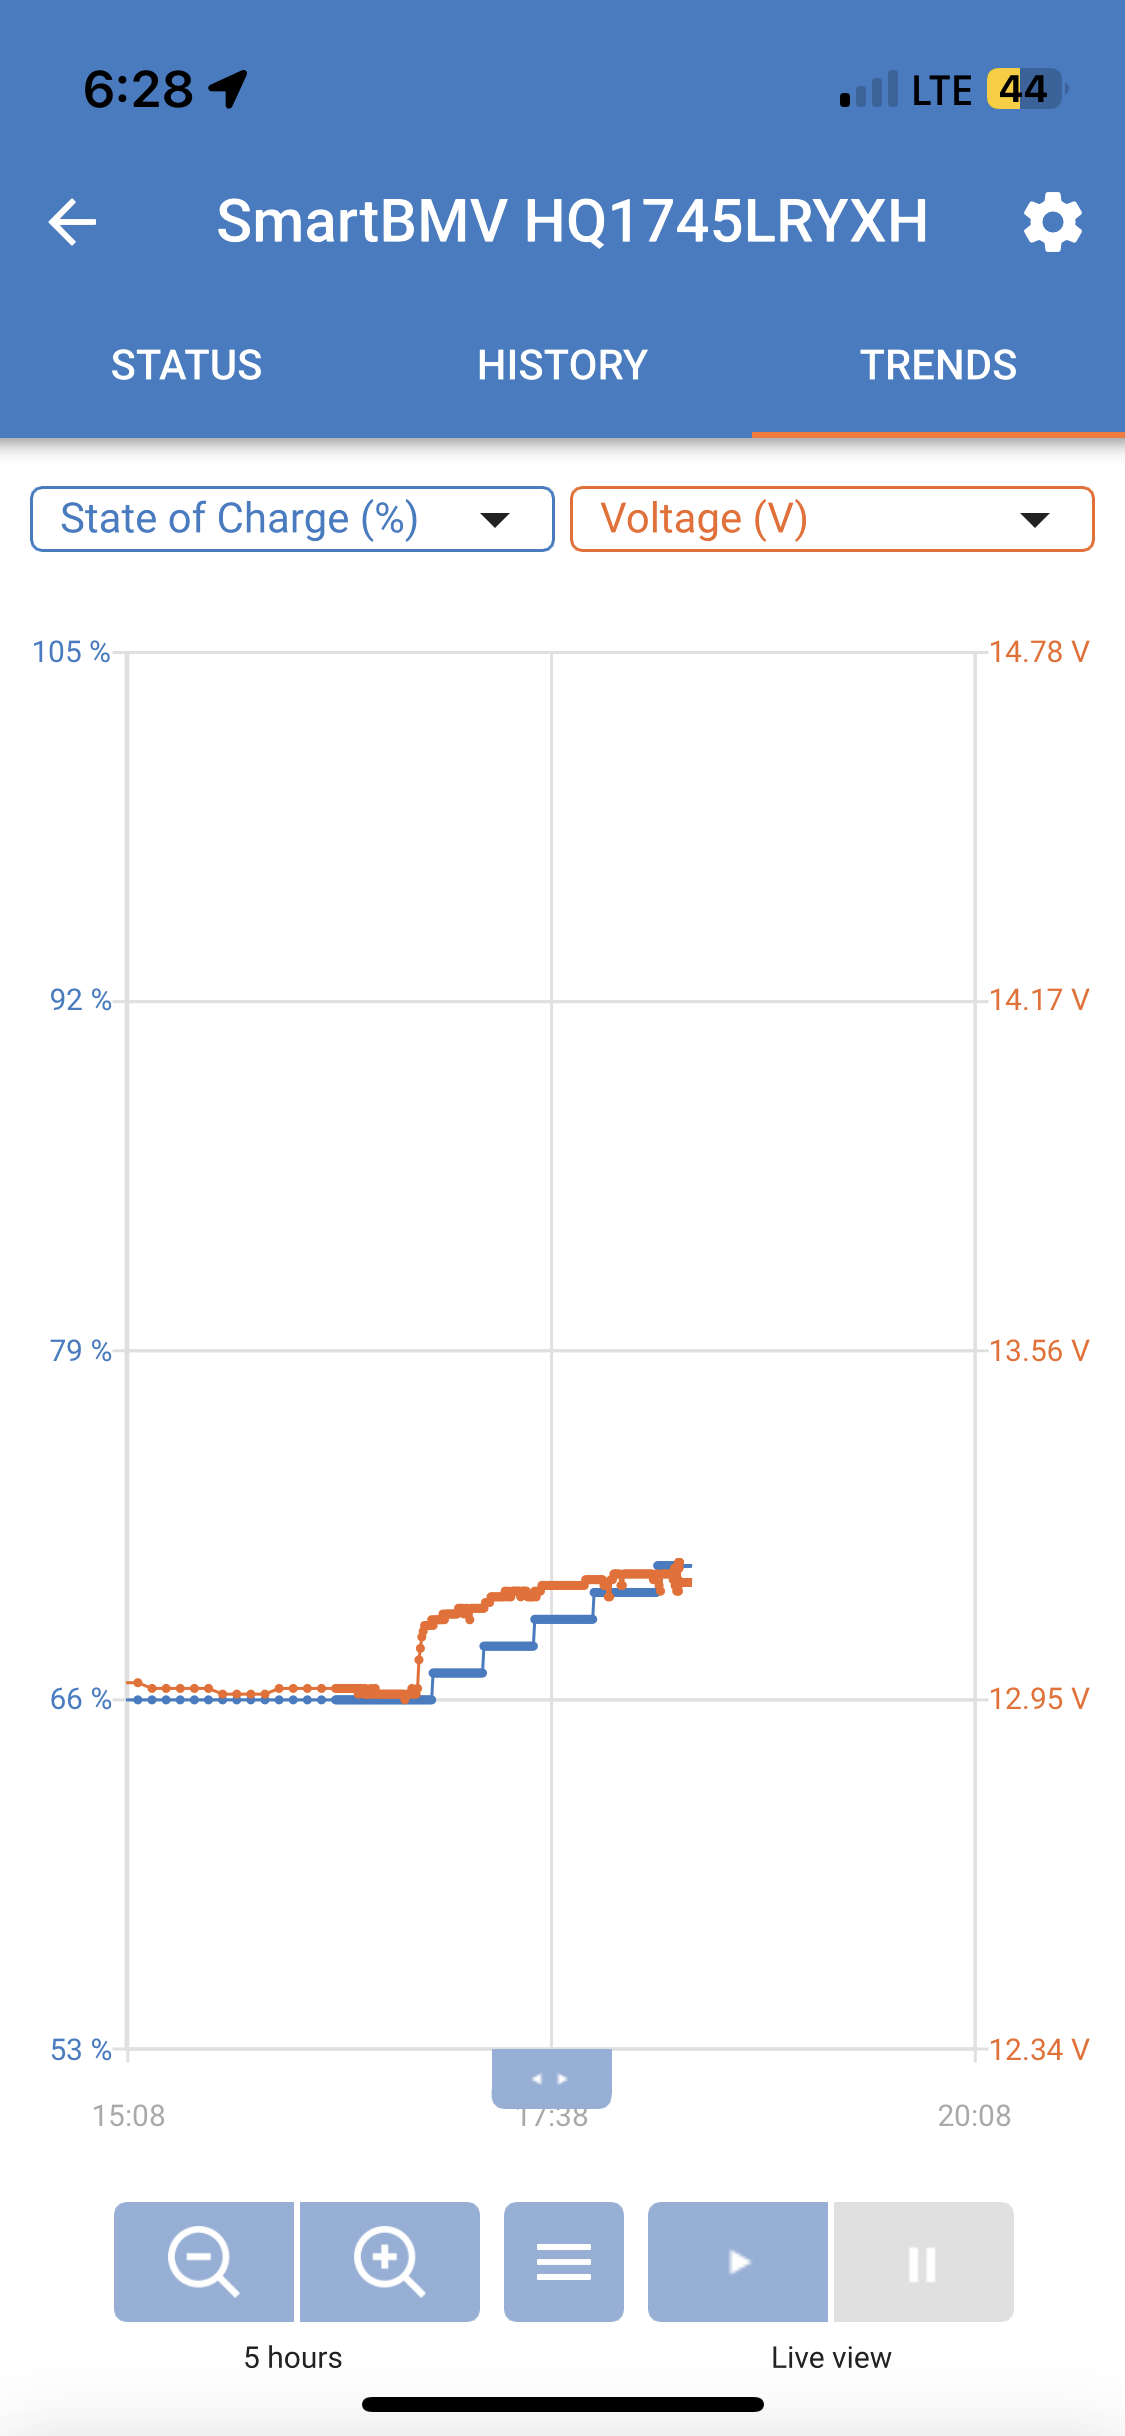
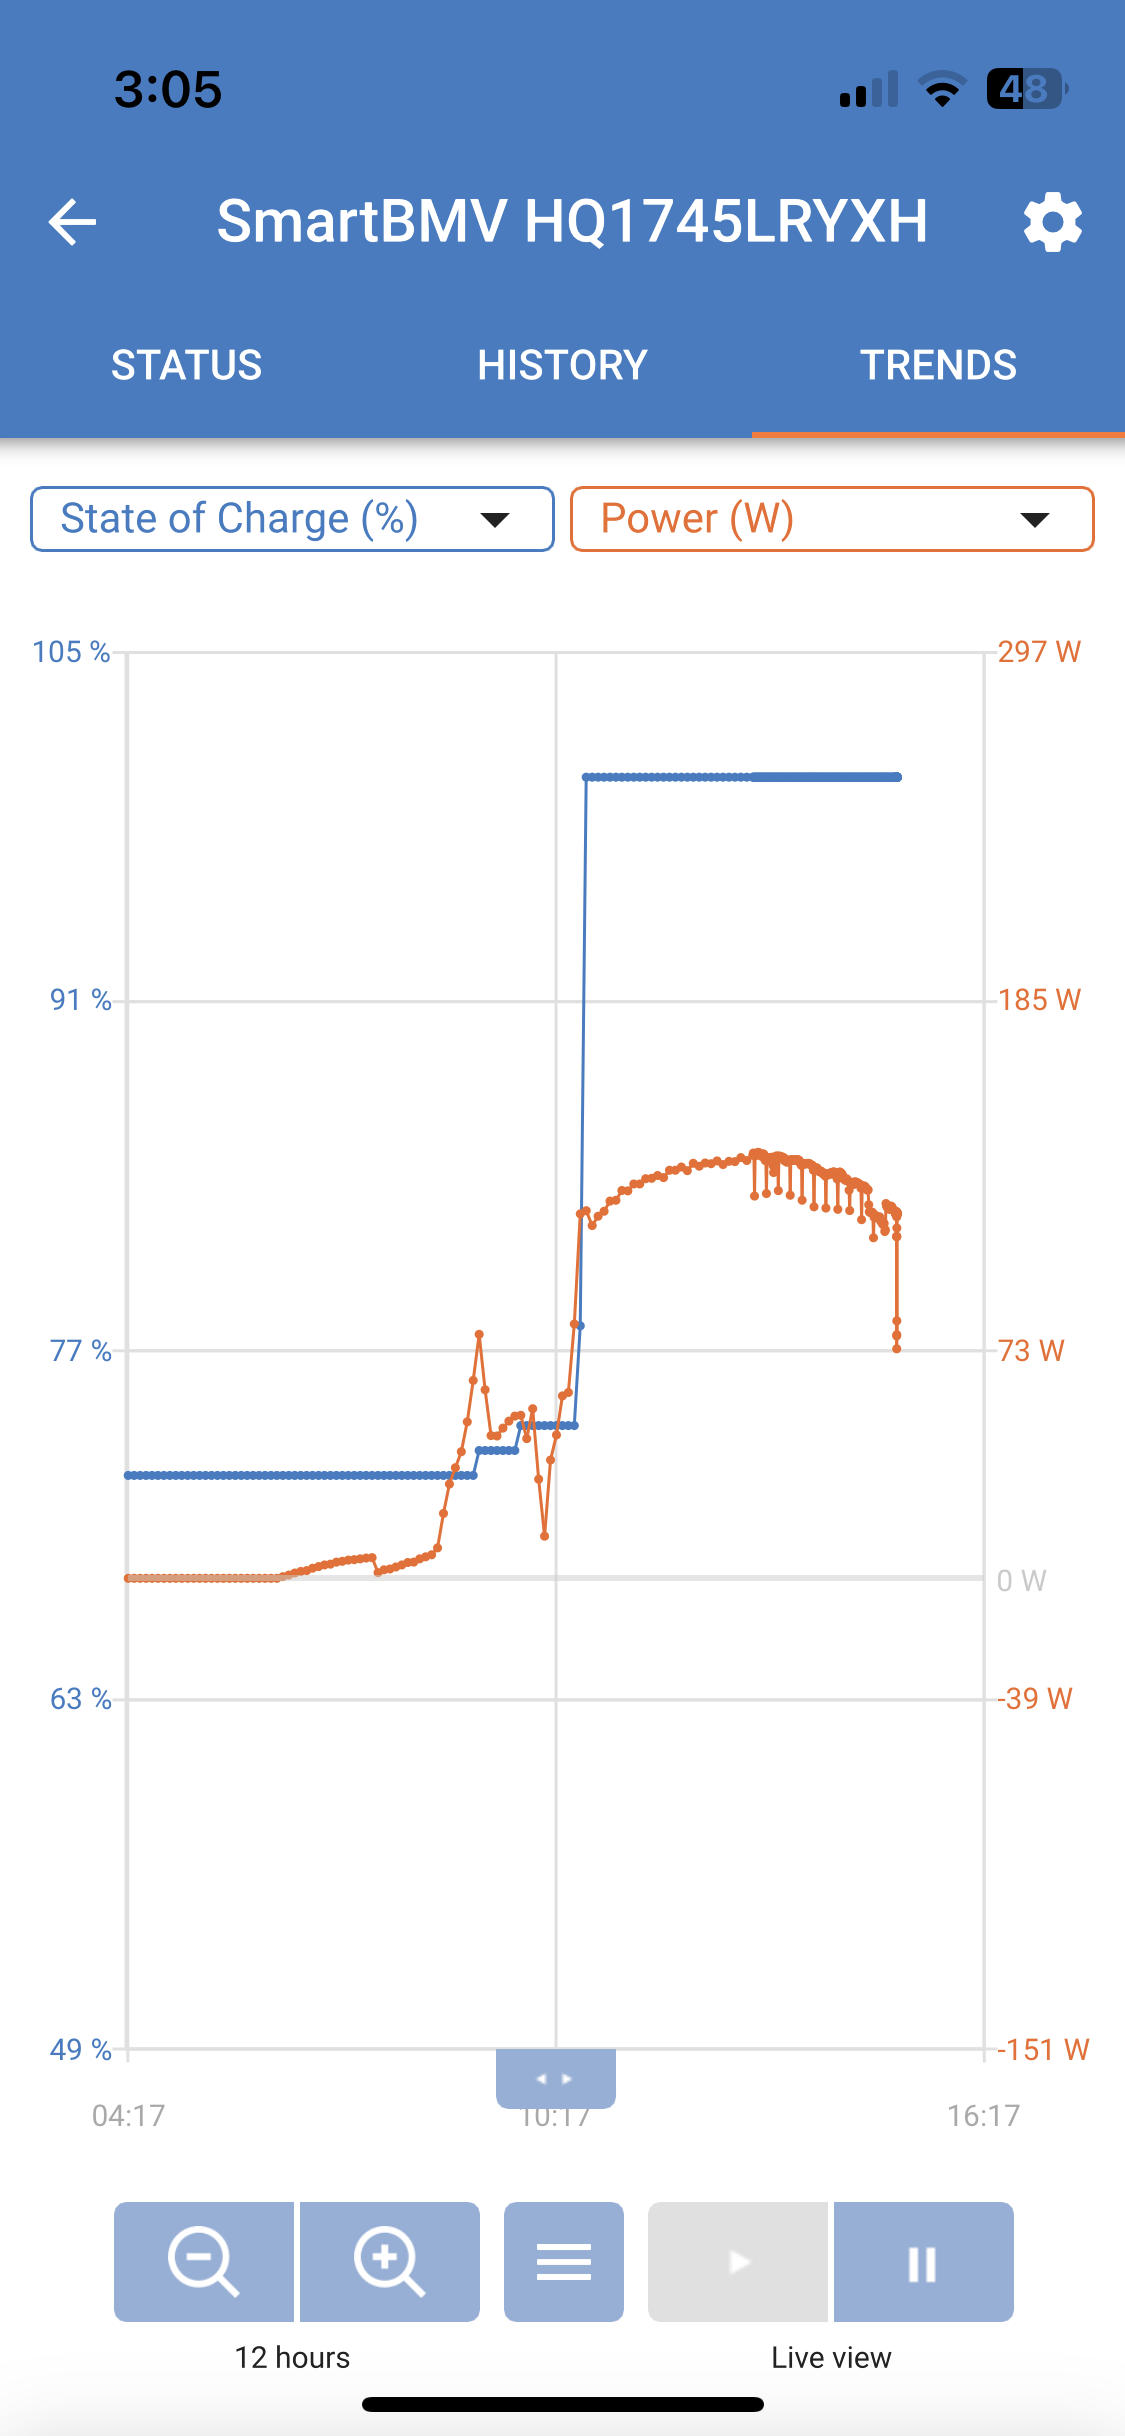
With a generator producing anywhere from 180 to 100 W over a 2+ hour period the battery charge went only from 66% to 70%. The trending feature shows that a small charge occurs in very short intervals and then flat lines for about 20 minutes and then repeats the same pattern. When graphed it looks like stairs.

Any ideas on what might be causing this problem would be greatly appreciated.

PS: I noticed the same stair step trend when I went back to PV charging.


Drew


MPPT Controllers
2 comments
2 |3000

Up to 8 attachments (including images) can be used with a maximum of 190.8 MiB each and 286.6 MiB total.

klim8skeptic avatar image klim8skeptic ♦ commented ·
@Drew McIntyre what are you using to determine Soc?

Might be worth mentioning battery voltages, and post a few screenshots from the mppt and SBS.


2 Likes 2 ·
Drew McIntyre avatar image Drew McIntyre klim8skeptic ♦ commented ·

Thanks for your suggestion. I have included some screenshots below. Also, what does Soc stand for?


img-1718.png

img-1717.png

0 Likes 0 ·
img-1718.png (221.8 KiB)
img-1717.png (244.7 KiB)
2 Answers
kevgermany avatar image
kevgermany answered ·

SOC - State of Charge.

What's the capacity of your batteries?

Is the vertical line in the first graph when the generator started charging?

A graph of current Vs state of charge for the same period would really help.

Are there other loads during the period of the graphs.

Screenshot please of the BMV settings (from cogwheel, top right in you screen shots) as well as the ones previously requested.

1 comment
2 |3000

Up to 8 attachments (including images) can be used with a maximum of 190.8 MiB each and 286.6 MiB total.

Drew McIntyre avatar image Drew McIntyre commented ·

I have 2 12.2V, 120Ah Lithium Batteries

Yes, the vertical line was when the generator was plugged in

Sorry, I didn‘t screen shot % charge vs amps

There were no other loads during charging

Addition screen shots below- thanks for your help!

img-1715.png

img-1749.png

img-1750.png

img-1751.png

img-1752.png

img-1753.png

0 Likes 0 ·
img-1715.png (317.5 KiB)
img-1749.png (247.5 KiB)
img-1750.png (212.3 KiB)
img-1751.png (162.5 KiB)
img-1752.png (164.6 KiB)
img-1753.png (280.7 KiB)
pwfarnell avatar image
pwfarnell answered ·

Isn't the stair steps just the rounding of the SOC value to whole numbers, so the graph is showing 66%, 67%, 68% etc even though the SOC is steadily increasing. The steps are very uniform and I am sure if you measured them against the 66% to 79% lines you would find that they are 1% steps. The charging power remains continuous. I do not think this is anything of concern.

3 comments
2 |3000

Up to 8 attachments (including images) can be used with a maximum of 190.8 MiB each and 286.6 MiB total.

Drew McIntyre avatar image Drew McIntyre commented ·

Greetings, maybe the stepping pattern is typical but it took 2 hrs of generator running with no RV loads to charge batteries from 66 % to ~ 70%. In the past I could fully charge the batteries in this time or less.

To add some intrigue, see the below snapshot which is when my RV returned from the trip and fully recharged the next day in the sun using the PV panels. It looks like it went from a regulated stepping charge to unconstrained charging at about 72% SOC.


img-1746.png

0 Likes 0 ·
img-1746.png (257.2 KiB)
pwfarnell avatar image pwfarnell Drew McIntyre commented ·

Some basics here. You have 240 Amp hour (Ah) of batteries. If these were discharged to 66% SOC that would mean that you have used 82Ah and have 158Ah left. To recharge your batteries you need to add 82Ah back, that means a current of 82A for 1 hour, 8.2A for 10 hours or 1A for 82 hours. Let us assume that you are getting a solar power of 150W which seems reasonable based on your graphs and the charge voltage is 14V, so your charge current is 150/14 = 10.7A. This means you need 82/10.7 = 7.7 hours for a full recharge.


Secondly, the battery monitor going to 100% is erroneous because your settings are completely wrong and my guess is you have not actually been fully charging your batteries. On your battery monitor you have charged voltage set to 13.2V and tail current at 4%. The tail current of 4% is 240 * 4/100 = 9.6A. So whenever your battery voltage is above 13.2V AND simultaneously the charging current is below 9.6A the battery monitor will go direct to 100%, which is almost always in your case even before they are actually full.

What you need to do is set the charged voltage to 0.1 to 0.2V below the absorption setting on the MPPT, something like 14.0V and set the tail current to 1%. Change the charge efficiency to 99%. This will mean that the battery monitor only synchronises to 100% when the batteries are actually full.

See the Victron video

https://www.youtube.com/watch?v=mEN15Z_S4kE&t=2s

When you are charging from the generator what charger do you have because that should charge quicker if it is sized correctly. As you have a 2200W generator you could easily power a 100A charger. If your charger is small then it may also be triggering the synchronisation to 100% before the batteries are actually full.

2 Likes 2 ·
Drew McIntyre avatar image Drew McIntyre pwfarnell commented ·
Thanks for your timely and detailed response. The settings were determined by my RV supplier so I will now update per your suggestions. Still not really sure why I’m having this issue now and it never surfaced over the last two years. Regarding the charger, my power converter has an output of 55 amps.

Again, really appreciate your efforts to help me and I look forward to implementing your recommendations.

Cheers!


0 Likes 0 ·