question

kinzigsegler avatar image
kinzigsegler asked

Solar Irradiance shown on VRM data export

Hello,

I am using a Multiplus 2 GX working fine.
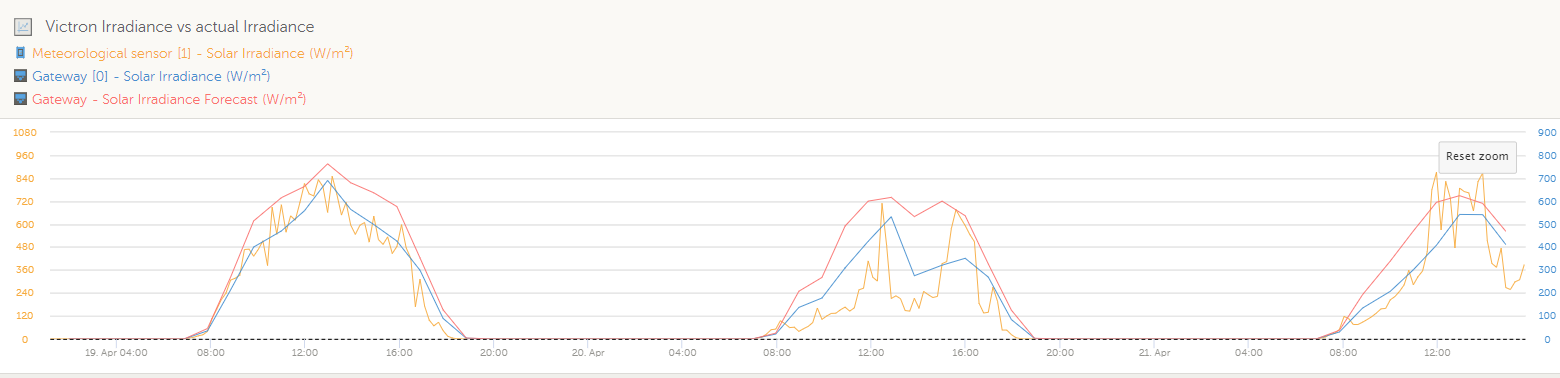
Since some days I noticed two new columns at the VRM data export table: 'Solar Irradiance' and 'Solar Irradiance Forecast' which both shows values on each full hour. I am not using any irradiance meter.
So what is the base for this nice service?
Shows it values optimised for my geographical position or just a value for Central Europe?
Is it possible to read out this data live on the VRM (adwanced) dashboard?

Thanks for your informanition


multplus 2 gx
2 |3000

Up to 8 attachments (including images) can be used with a maximum of 190.8 MiB each and 286.6 MiB total.

3 Answers
PeterM avatar image
PeterM answered ·

Could some please define these two new terms , also just noticed it - particularity the forecast one - is it the value expected for the next hour , next day same time ? Where is it sourced from ? Position Granularity of the data ?

2 |3000

Up to 8 attachments (including images) can be used with a maximum of 190.8 MiB each and 286.6 MiB total.

PeterM avatar image
PeterM answered ·

I managed to plot the Victron Irradiance and forecast with my measured irradiance ( tilted 23 deg ) below using the custom widget .


1682092292802.png


1682092292802.png (67.9 KiB)
2 |3000

Up to 8 attachments (including images) can be used with a maximum of 190.8 MiB each and 286.6 MiB total.

thanar avatar image
thanar answered ·

OK, also chiming in here... Anyone knows how these values get calculated, or which source data are they based on?

2 comments
2 |3000

Up to 8 attachments (including images) can be used with a maximum of 190.8 MiB each and 286.6 MiB total.

thanar avatar image thanar ejrossouw commented ·
Happy there’s a proper reply on this old question, even a year later.
0 Likes 0 ·

Related Resources

Additional resources still need to be added for this topic