Hi,
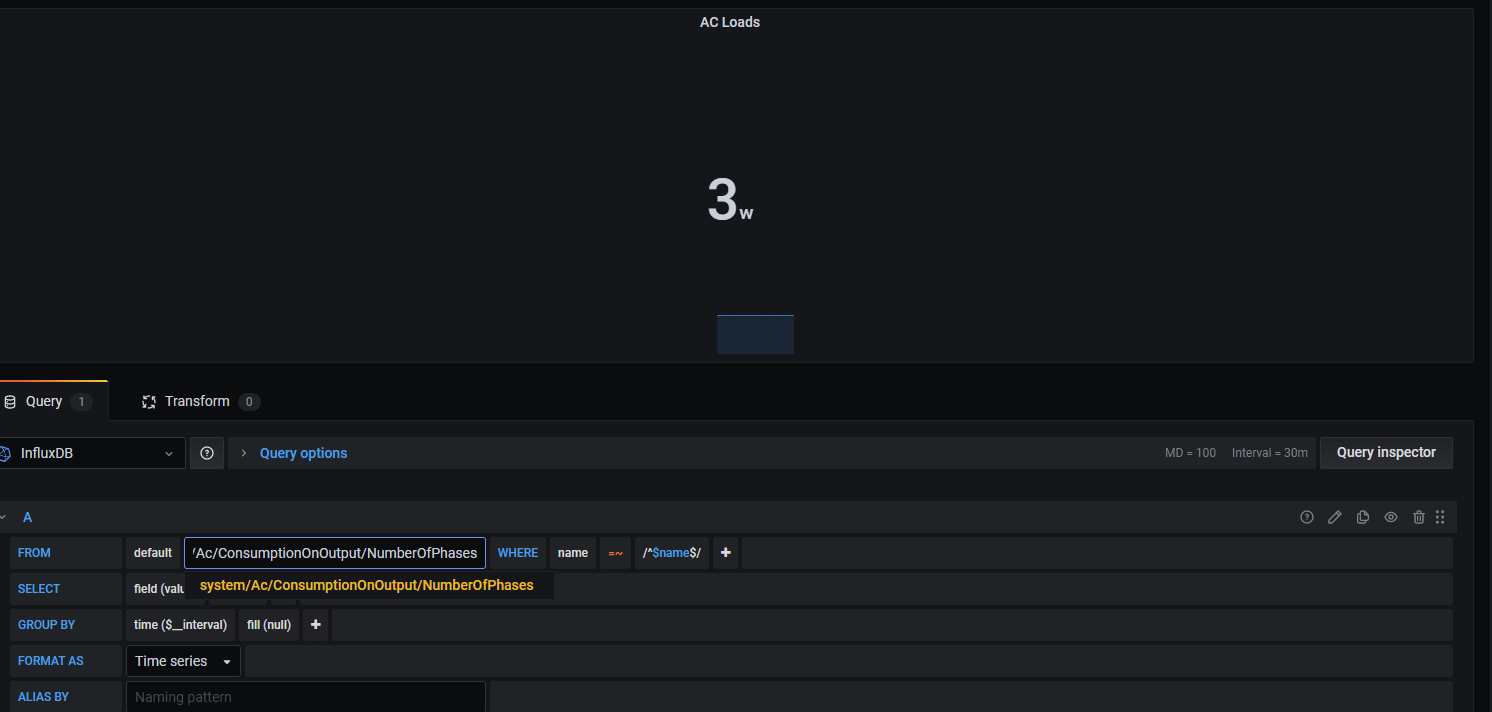
I have a problem how to display data from 3 phase system ? ac loads or pv production ? The formula NumberOfPhases dosn't work or I 'm doing some mistake, anyone can help with that ?
Hi,
I have a problem how to display data from 3 phase system ? ac loads or pv production ? The formula NumberOfPhases dosn't work or I 'm doing some mistake, anyone can help with that ?
...ehhrr..not quite sure where your problem is, here...but in a three phase system, the "(total) Number of Phases" is "3"...comes natural ;-)
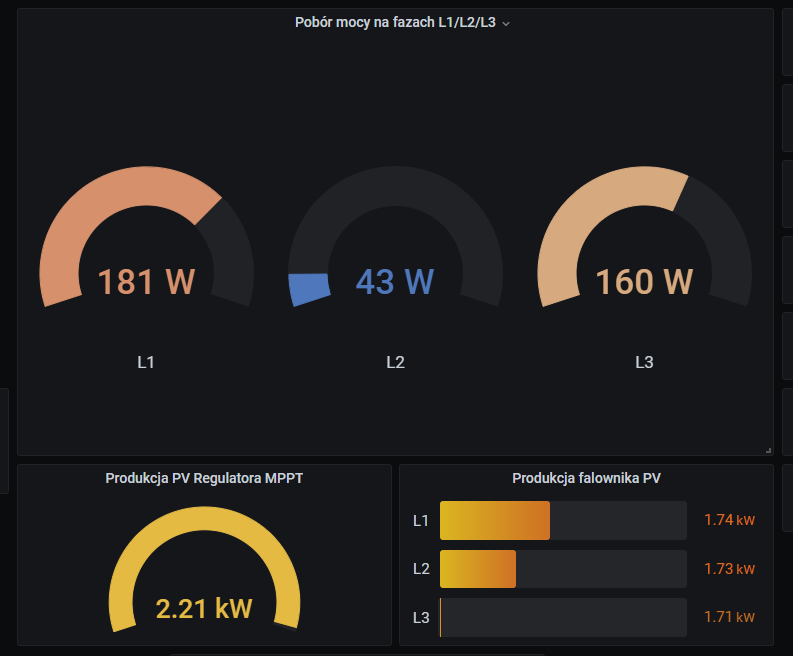
The values for Curent and Power, for each individual phase, can be found under:
..../Ac/Consumption/Lx/Power and .../Ac/Consumption/Lx/Current (change Lx to L1/L2/L3 respectively)
I tried this and still doesn;t work, whet put this formule it shows no data :
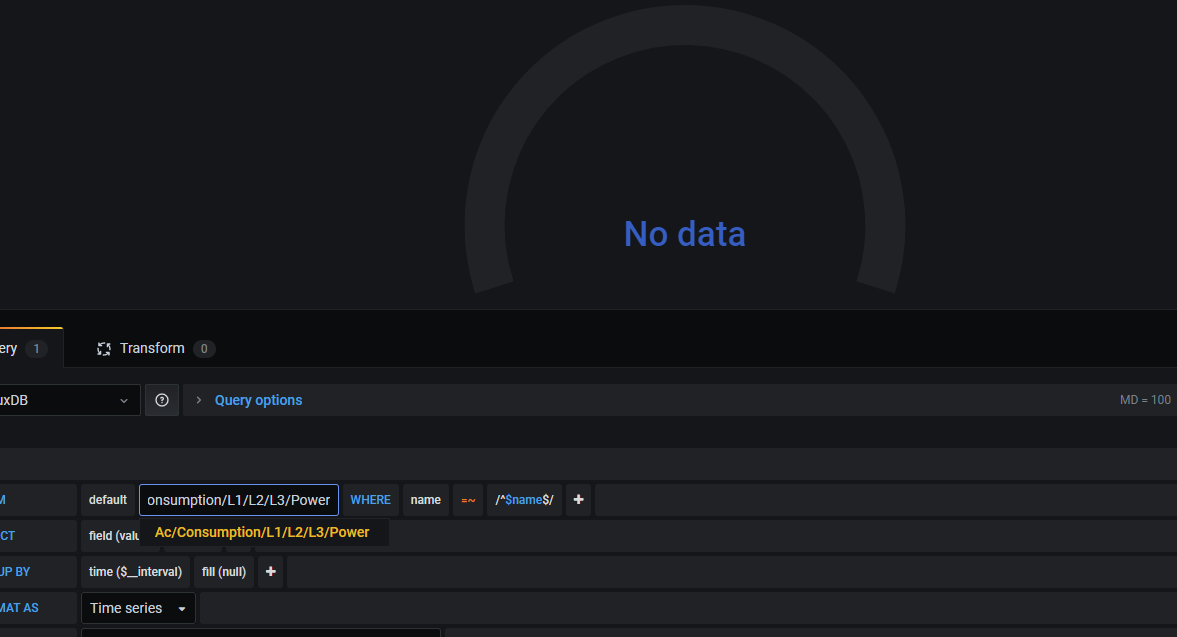
it is either L1, L2 or L3 in the path...not "L1/L2/L3" ... try this for L1: ....Ac/Consumption/L1/Power
Note: I don't know your complete path, do not copy the leading "dots" in my example string.
If that doesn't work, I can't help as I am organising my datasets / measuremenst in influxdb differently, so my example queries wouldn't help you.
Do you have a grid meter? Than use: https://github.com/victronenergy/venus/wiki/dbus#grid-and-genset-meter
Otherwise, there is more than one way to do that in grafana, depending on the Version deployed, for an exampe that might help ,see: https://community.grafana.com/t/summing-2-series-results-to-a-single-value/46696
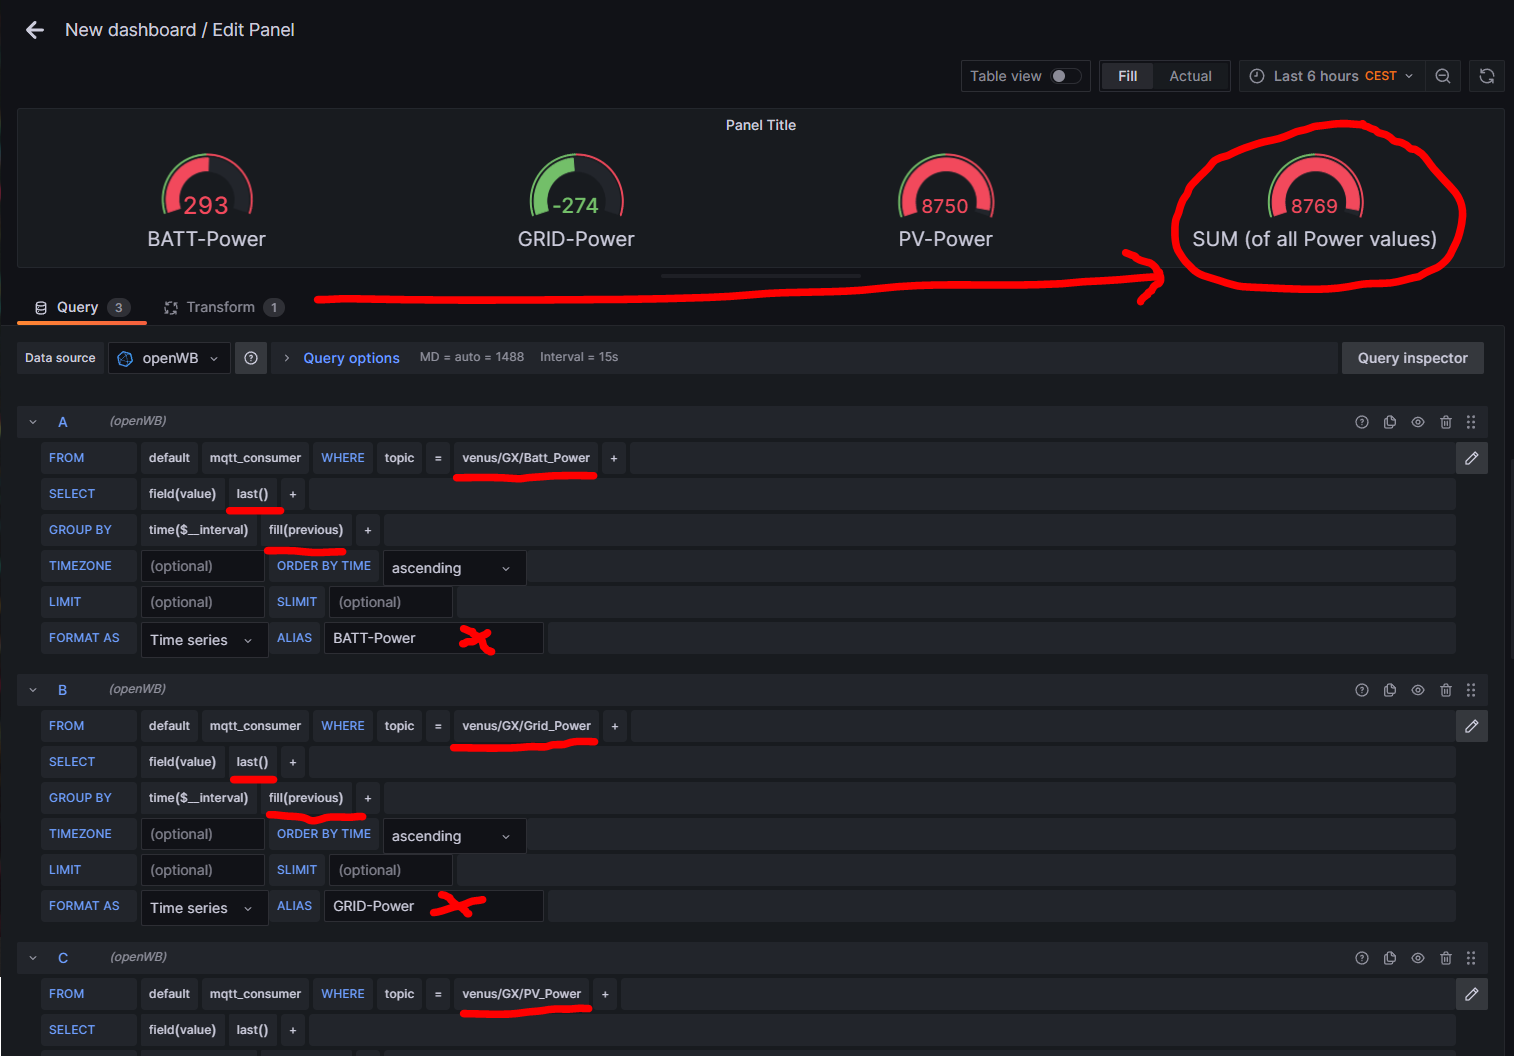
You didn't read the other response...use a transformation to combine these three field into a single one.
Here's a quick example, combining all Power Values (Battery, Grid, PV) from my site into the SUM (of all power values) - just as an example, as technically it does not make much sense, doesn't it:
I short:
...then create a simple transformation of type "add field from calculation" like this:
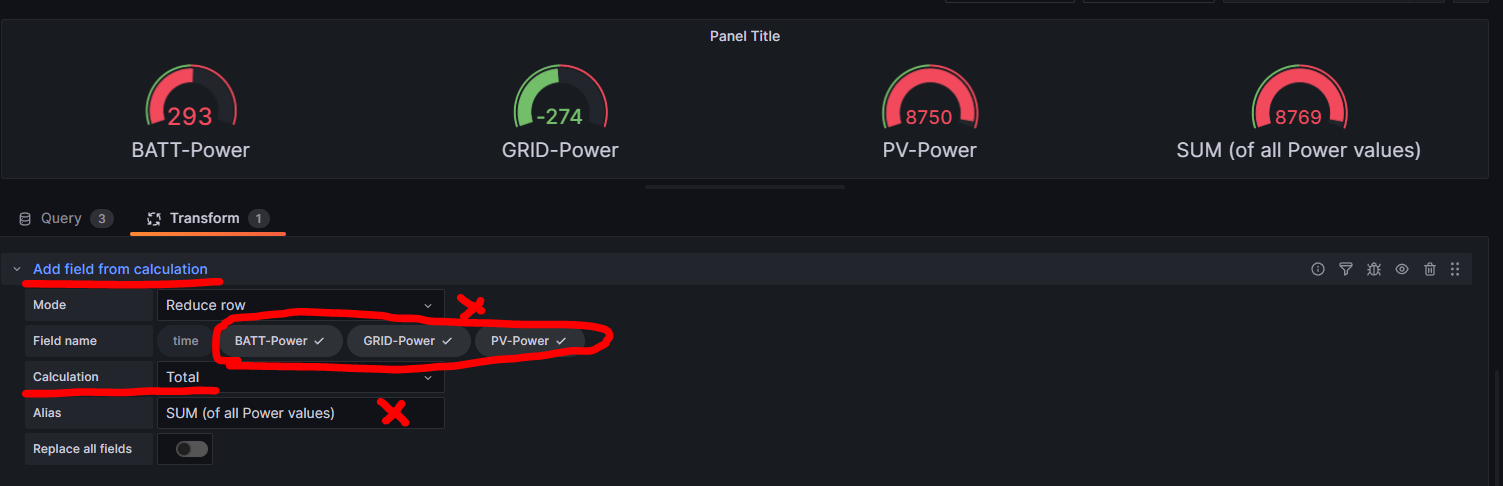
in short:
now, use your existing queries for L1, L2 and L3 accordingly.
Hope this helps.