Hi. I have a Quattro with MPPT 150/85s, CCGX and BMV702. When I was using other equipment I fed all generation and usage statistics to pvoutput.org which is a great way to monitor installations year to year and long term. Is there an easy way to feed statistics from my Victron installation to pvoutput.org. If it is very technical I will need a detailed explanation of the steps. I can't programme.
asked
Feed to PVOutput.org from Victron
Hi Incagarcilaso,
I would like to know if this is possible myself.
But it is definitely belonging in the modifications space, so I have moved it there.
Hi @Guy Stewart (Victron Energy Staff) Yes, wasn't sure where to put it and couldn't find relevant tags. Thanks for moving it to the right spot.
I think it's possible using the MQTT protocol in the CCGX but I need to know the process.
@Guy Stewart (Victron Energy Staff) All I have been able to find is this:
https://github.com/izak/dbus-pvoutput
However, it could be developed further. Not within my scope but maybe someone else would have a go at refining and developing it for different system configurations.
As I said on another forum, I wrote this shortly after Christmas and I'm sure beer or perhaps good red wine was involved. It was a small personal project and definitely not up to standard. It works, but ideally it should be rewritten to log system values to pvoutput instead of doing its own thing as this does now. There is also zero support for PV-inverters.
I see. There is something then but it is not completely finished or refined. Well please let us know if and when there is a chance to have this as a workable option. I'd be reluctant to implement "as is" because I don't want to run the risk of any errors on the CCGX while I am away from the system. Thanks for the feedback.
Based on Izaks script I build my own python to export the modbus data into PV Output, this runs on a synology, collect data every 5 sec. from victron and send the summery every 5 min to PVO
Very Cool @stenis
Is there any possibility to get the script bundled into a docker container to something else that is easy for other people to run without too much knowledge required?
Hello, I have taken the liberty of using your script with me. However, when I run it, I get an error that I don't understand and therefore unfortunately can't fix. I have tried it under Alpine Linux and Debian. Each with Python 2.7 and 3.11.
The error that occurs here is always the following:
modbus:~# python vic2pvo.py
Traceback (most recent call last):
File "/root/vic2pvo.py", line 71, in <module>
v1= int(x[0])
ValueError: invalid literal for int() with base 10: '\n'
If it is somehow possible, I would very much like to use. Thanks
I'm using a reduced version of this script on my Raspberry. It is scheduled every 5 minutes.
Maybe this one is working.
You need to change die IP-Adress of your GX-Device, the API-Key plus SystemID from PVOutput and the path where the script is stored.
Everything else should work.
#!/usr/bin/env python
# -*- coding: utf-8 -*-

import time
import sys
import requests
import decimal
import os
import textwrap
import subprocess

from datetime import datetime
from pymodbus.payload import BinaryPayloadDecoder
from pymodbus.constants import Defaults
from pymodbus.constants import Endian
from pymodbus.client.sync import ModbusTcpClient as ModbusClient

PVOUTPUT = "https://pvoutput.org/service/r2/addstatus.jsp"
APIKEY = "abcxyz" # get API Key from settings
SYSTEMID = "12345" # add new system and take this id
LOKALPATH = "/home/pi/vic2pvoutput/" # path of stored script
VENUS_IP = "192.168.178.12" # Ip of the Venus GX

clear = "\033[K\033[1K" # Eliminates screen flashing / blink during refresh

client = ModbusClient(VENUS_IP, port='502')

def modbus_register(address, unit):
    msg     = client.read_input_registers(address, unit=unit)
    decoder = BinaryPayloadDecoder.fromRegisters(msg.registers, byteorder=Endian.Big)
    msg     = decoder.decode_16bit_int()
    return msg

dateTimeObj = datetime.now()
ts = dateTimeObj.strftime("%d-%b-%Y %H:%M:%S")

now = datetime.now()
start = datetime.now()

print(ts, 'Start')

try:
    v1 = modbus_register(784, unit=226) *100
except OSError as err:
    print("OS error: {0}".format(err))

try:
    v2 = modbus_register(789, unit=226) /10
except OSError as err:
    print("OS error: {0}".format(err))

dateTimeObj = datetime.now()

print(ts, float(v1), int(v2))
print(clear,f" PV Yield Today.......... {v1:.0f} Wh", sep="")
print(clear,f" PV Watts................ {v2:.0f} W", sep="")

payload = {
    "d": now.strftime("%Y%m%d"),
    "t": now.strftime("%H:%M"),
    "v1": int(v1),                # PV Energy
    "v2": int(v2),                # PV Power
    "c1": 1
}

print(clear," Payload................. ", payload)

try:
    requests.post(PVOUTPUT,
        headers={
            "X-Pvoutput-Apikey": APIKEY,
            "X-Pvoutput-SystemId": SYSTEMID
        }, data=payload)
except:
    print("Fehler beim Upload")

print(ts, 'Ende')
Thank you very much for your support. But unfortunately this script does not run either. I have installed the missing module pymodbus and get the following error:
modbus:~# python ess2pvo.py
Traceback (most recent call last):
  File "/root/ess2pvo.py", line 16, in <module>
    from pymodbus.client.sync import ModbusTcpClient as ModbusClient
ModuleNotFoundError: No module named 'pymodbus.client.sync'
I have of course entered my personal settings such as ID, API key and the IP address of the Cerbo. Is there another module missing here that I don't recognise?
Please try it with python3.
My version is:
pi@raspberrypi:~ $ python3 --version
Python 3.7.3
I only have version 3 on my Alpine Linux.
modbus:~# python --version
Python 3.10.10

modbus:~# python3 --version
Python 3.10.10
I think that should fit, right?
Okay :-)
I'm not a Python expert, but I think that not all needed modules (like pymodbus) are installed (No module named 'pymodbus.client.sync')
Well, I'm no expert either, but I'm pretty sure that "pymodbus.client.sync" is not an extra package. It must be a component of pyModbus, which I have installed.
Okay, I will now set up another machine with Ubuntu. Let's see if it runs there.
@Izak (Victron Energy Staff) excuse my question but treat me as an average user. How the heck do I put your script on my CerboGX? I would love to export to PVOutput. I had a Voltronics setup which I used to export to PVO from and love the centralised peer stats on that site. Southern Africa has a Group and its nice to add to the PV story.
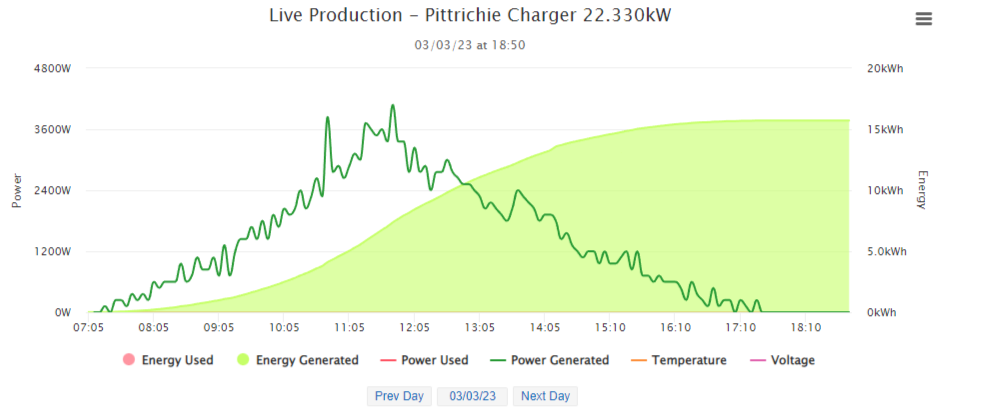
Hi I currently output my data to PVOutput with node red, no actual code just node red, pretty easy to do, i have my original PV and my new solar chargers on separate accounts,
i Use OS large node red and export data to another PI running lots of other stuff but you don't need to do that
on the function node i have removed my key and sid info so you will have to put your own on that
msg.url="https://pvoutput.org/service/r2/addstatus.jsp?key=XXXsid=XXX&d="+msg.d+"&t="+msg.t+"&v1="+msg.v1
this is my Solar charger info 3x SmartSolar MPPT RS
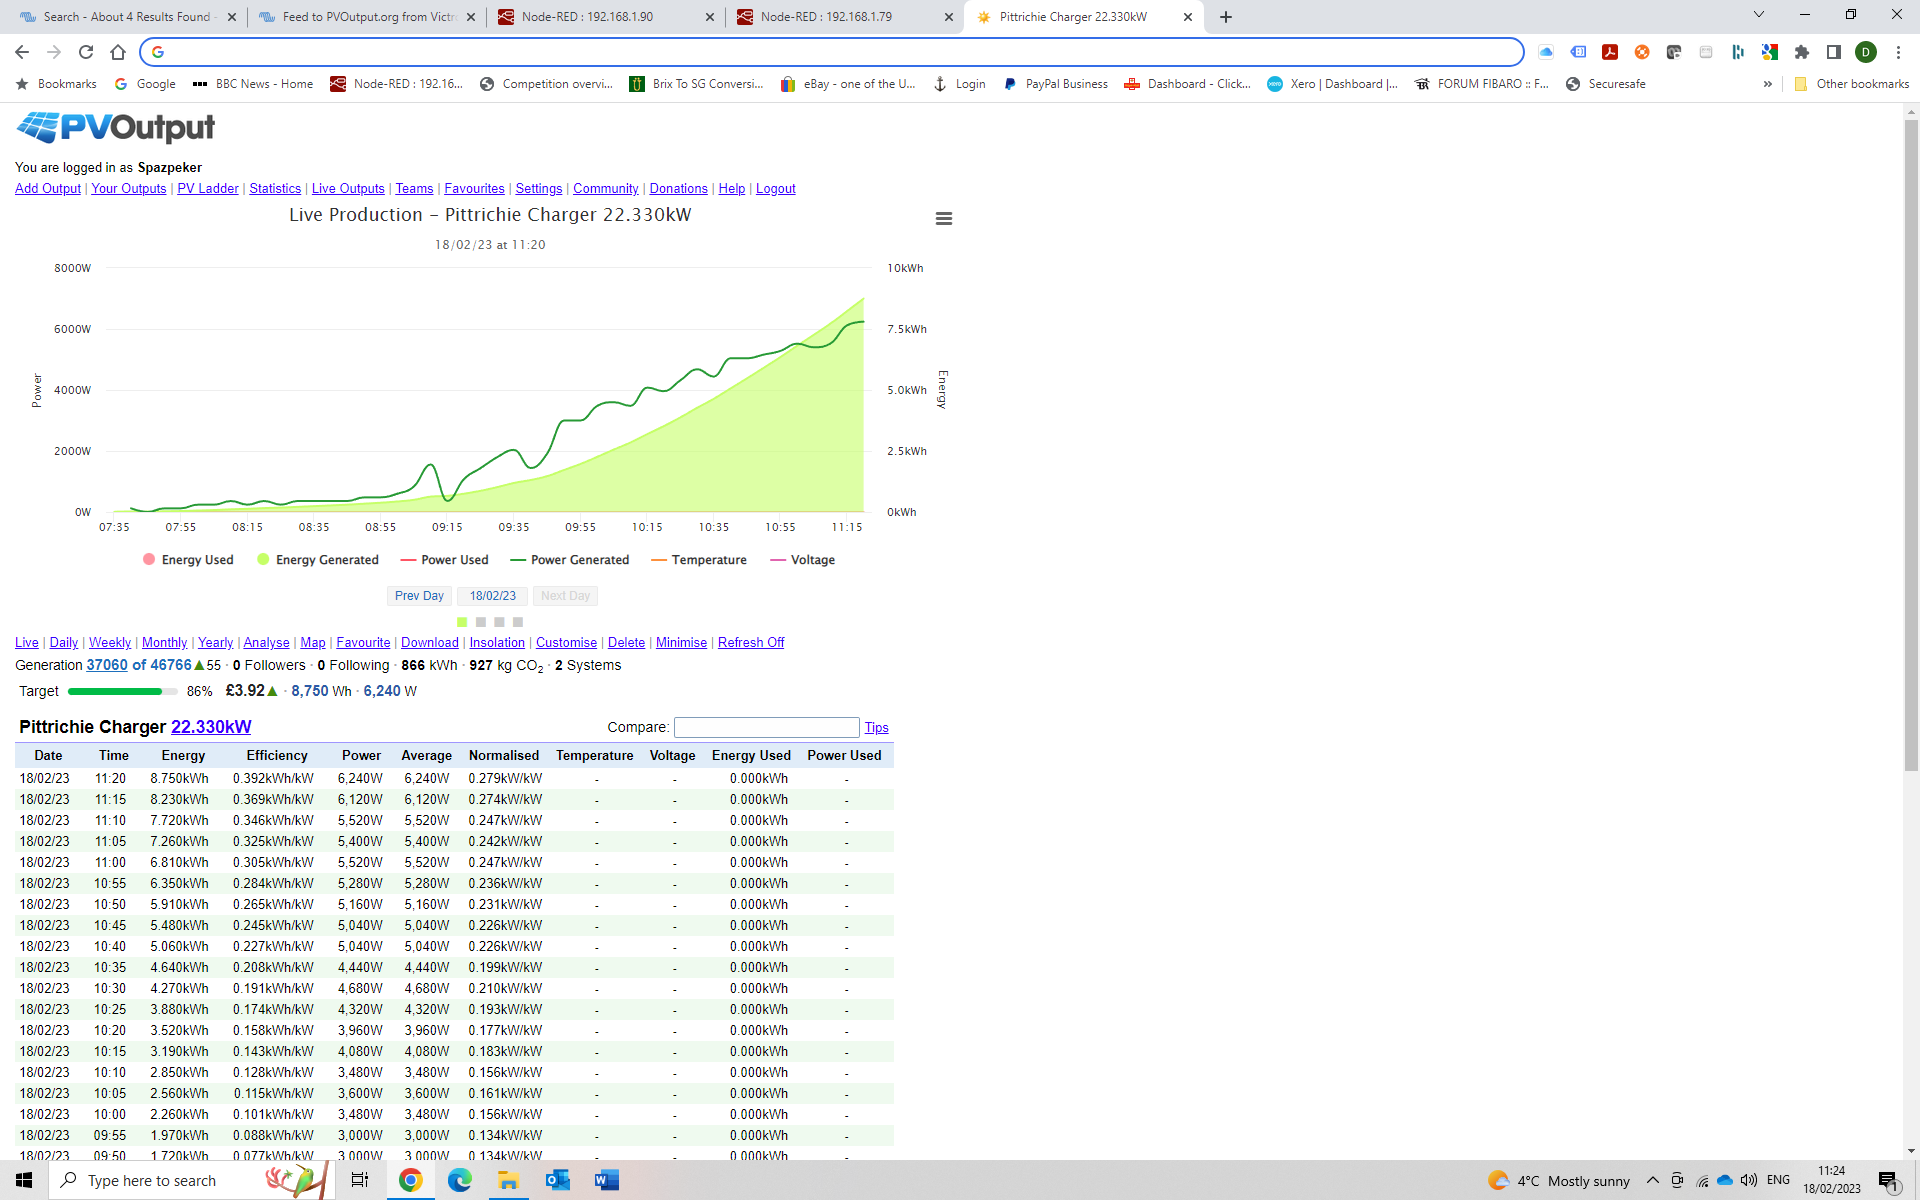
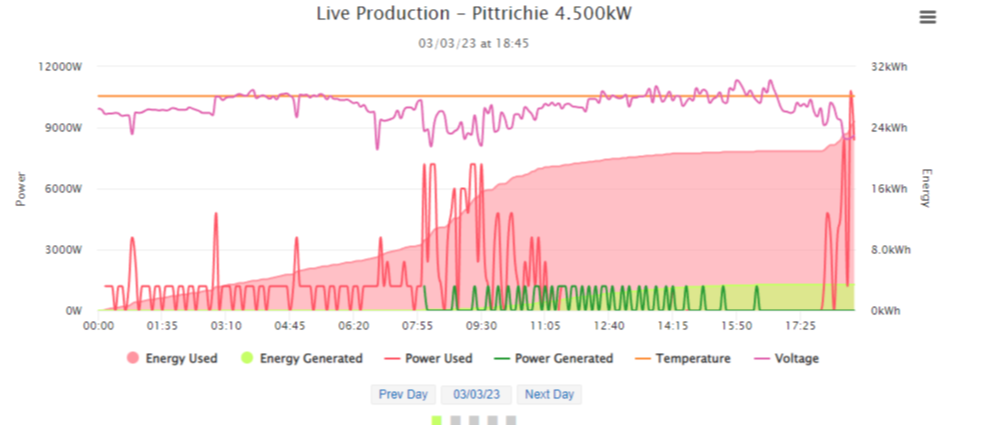
my original solar PV has more data
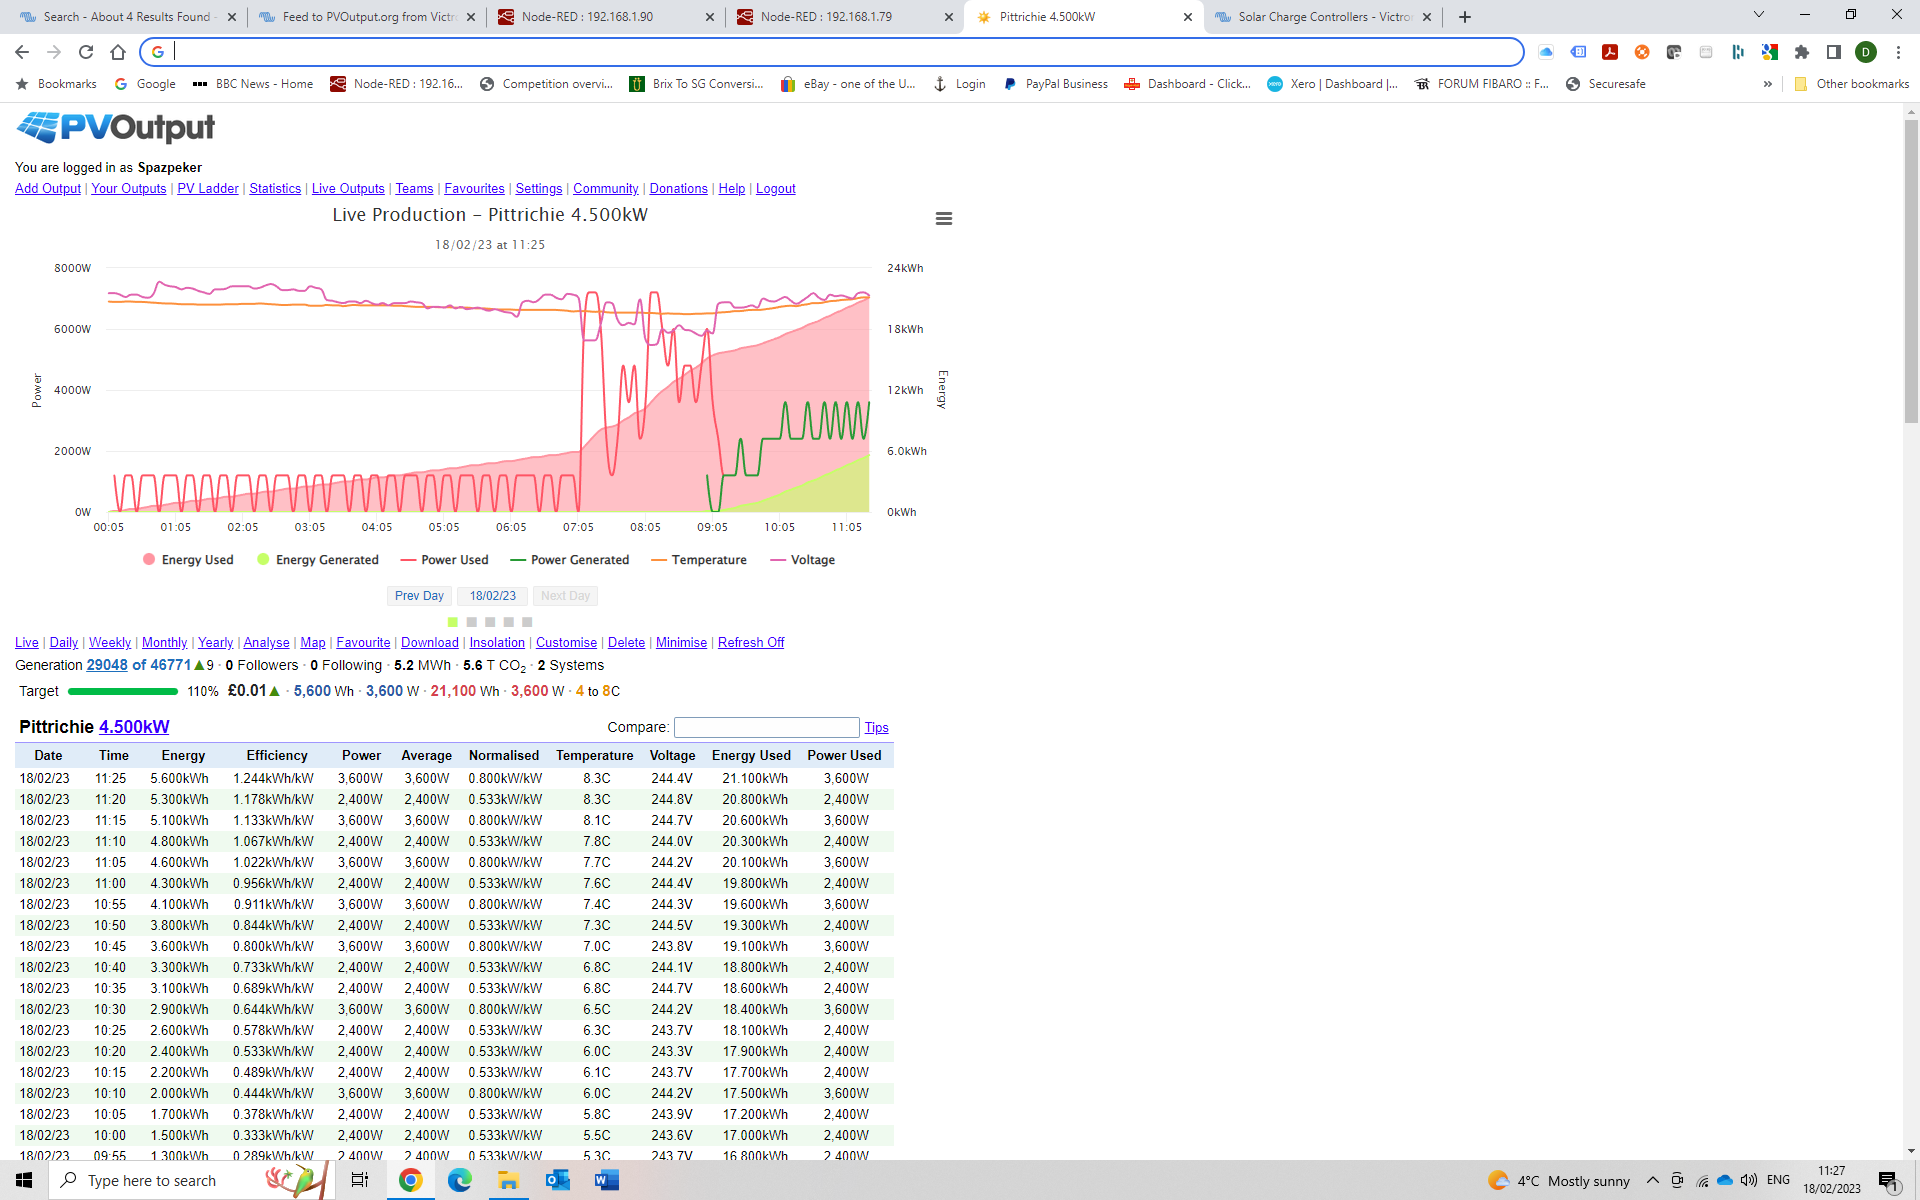
pretty much same as before on the function node
var mtime = flow.get("time");
var mdate = flow.get("date");
var mvoltage = flow.get("volts");
var mtemp = flow.get("outside");
var etoday= flow.get("etoday");
var etotal= flow.get("etotal");
var gtotal = (etotal*1000)
var Etotal = flow.get("energy_in")
var Esold = flow.get("energy_out")
msg.d = mdate
msg.t = mtime
msg.v1 = gtotal
msg.v3 = (((Etotal-Esold)+etotal)*1000).toFixed(2)
msg.v5 = mtemp
msg.v6 = mvoltage
return msg
works great for me and no real code so easily copied
This is great, just what I'm looking for, but I will need a little help to implement the required changes please, as I'm new to Node Red and json.
I have two MPPT controllers (west & east), ET112 energy meter on my existing PV (SolarEdge) which is on AC OUT 1, and the Quattro is used as the energy meter, as the entire house is on AC OUT 1, and its set up as an ESS system
I'd like to upload total generation from all PV systems to a single PV Output account, I think your flow does this.
I installed the Moment library, and I've added my key & SID to the single function in the PV Output flow.
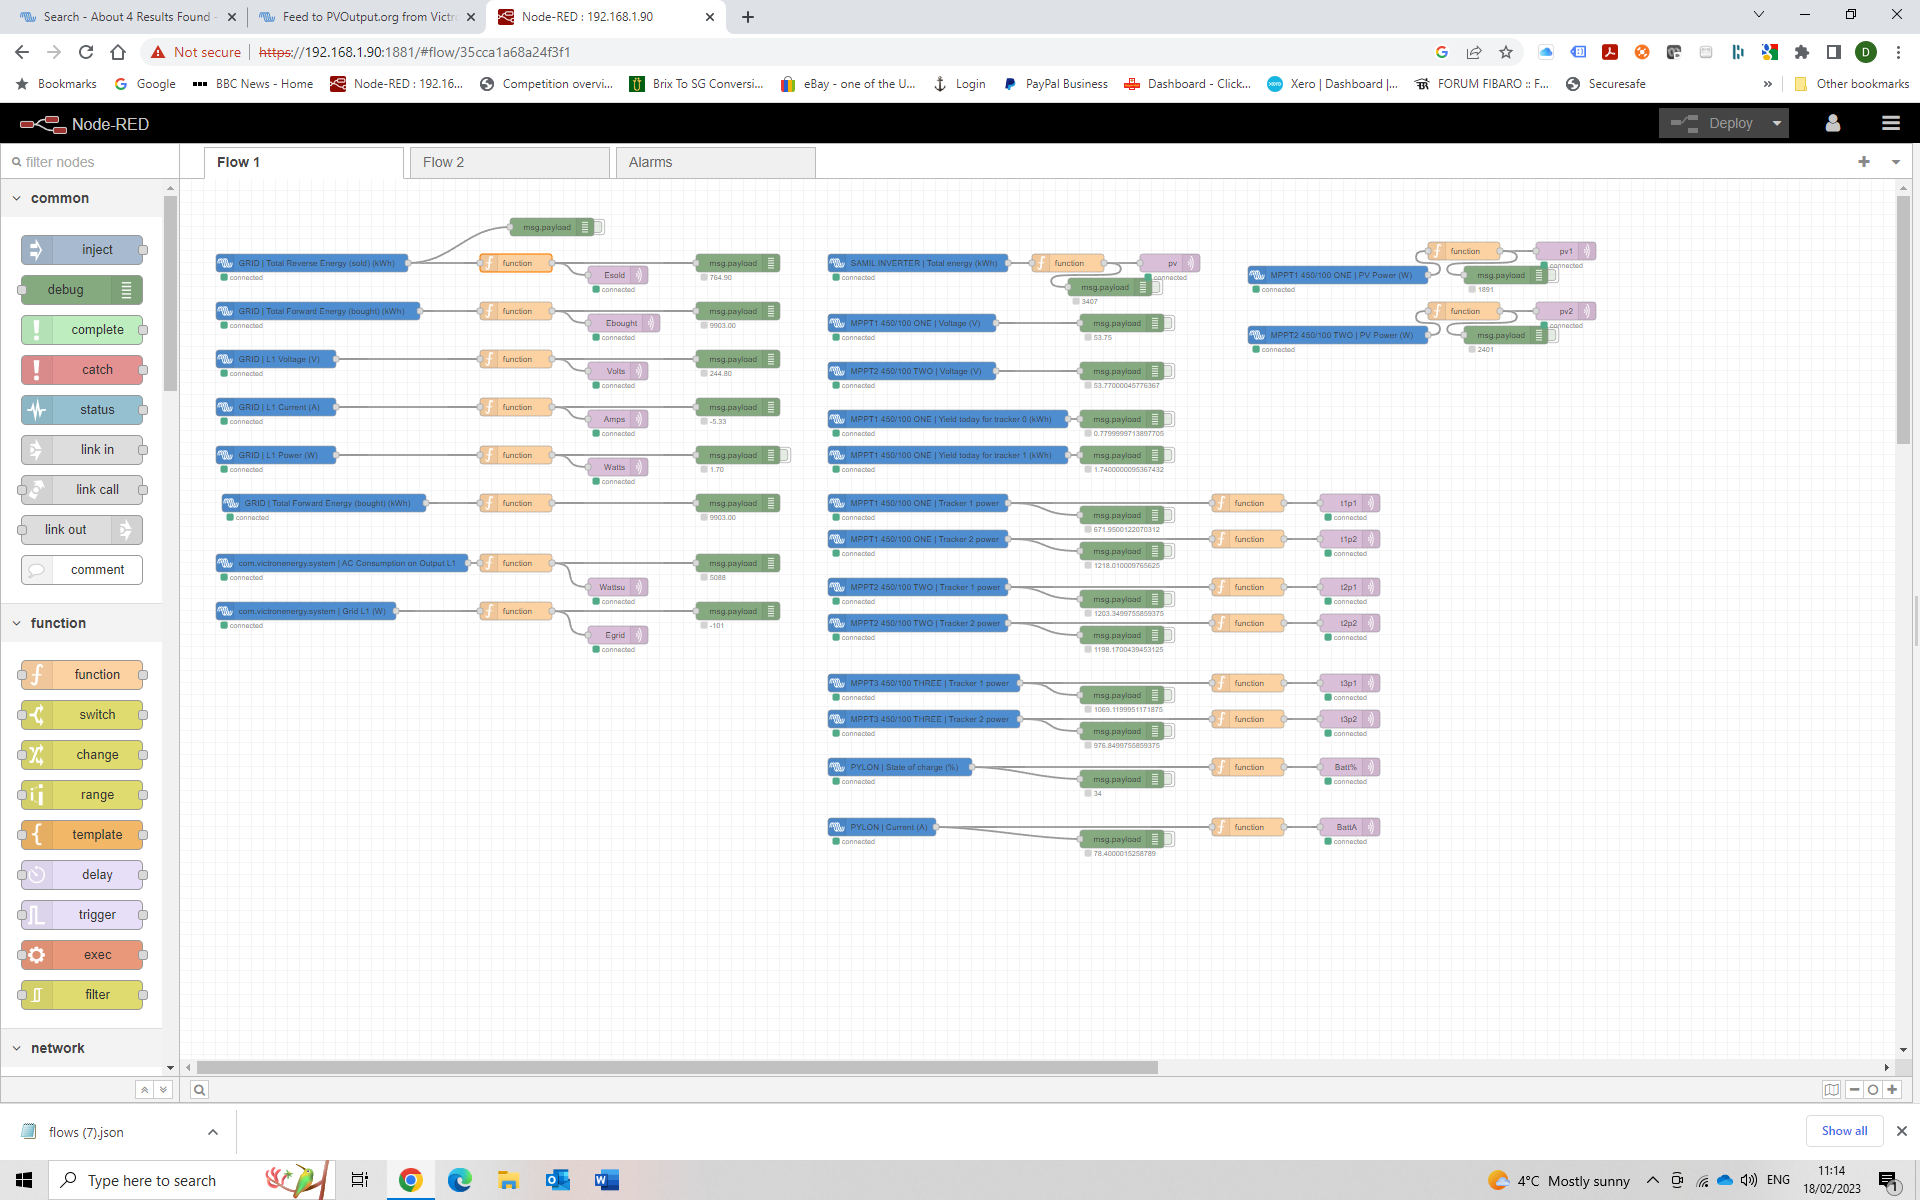
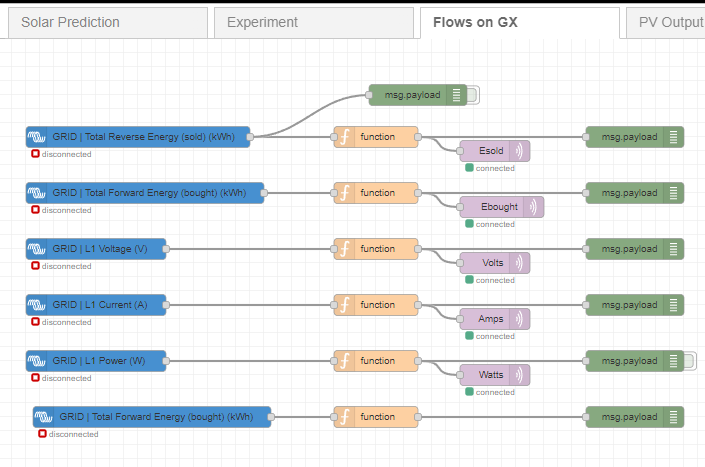
Looking on the "Flows on GX" I can see I need to change the following, which I've done.
- MPPT1 to my "West MPPT"
- MPPT2 to my "East MPPT"
- MPPT3 I presume I can just ignore/disable as I might add a third MPPT
- SAMIL Inverter I need to change to my SolarEdge Inverter
- PYLON I presume I need to change to my Lynx Shunt
I'm stuck on the following, can't seem to find what I need to change them to.
- GRID| Total Reverse Energy (sold) (kWh)
- GRID| Total Forward Energy (bought) (kWh)
- GRID| L1 Voltage (V)
- GRID| L1 Current (A)
- GRID| L1 Power (W)
- GRID| Total Forward Energy (bought) (kWh)
Victron-input-system has a blank measurement, not sure if its supposed to be blank?
In your post above you've got like a list of variables after the text "pretty much same as before on the function node " what's the relevance of this list, is it something I have to enter somewhere?
Thanks.
Just to follow on from above, and to add information for others that may need to adapt this to their systems.
There is an error in the URL (in the function node connected to the timestamp node on the PVOutput flow), which can easily catch people out as it did me at first, there is a missing & after the first XXX where you place your key.
https://pvoutput.org/service/r2/addstatus.jsp?key=XXX&sid=XXX&d="+msg.d+"&t="+msg.t+"&v1="+msg.v1
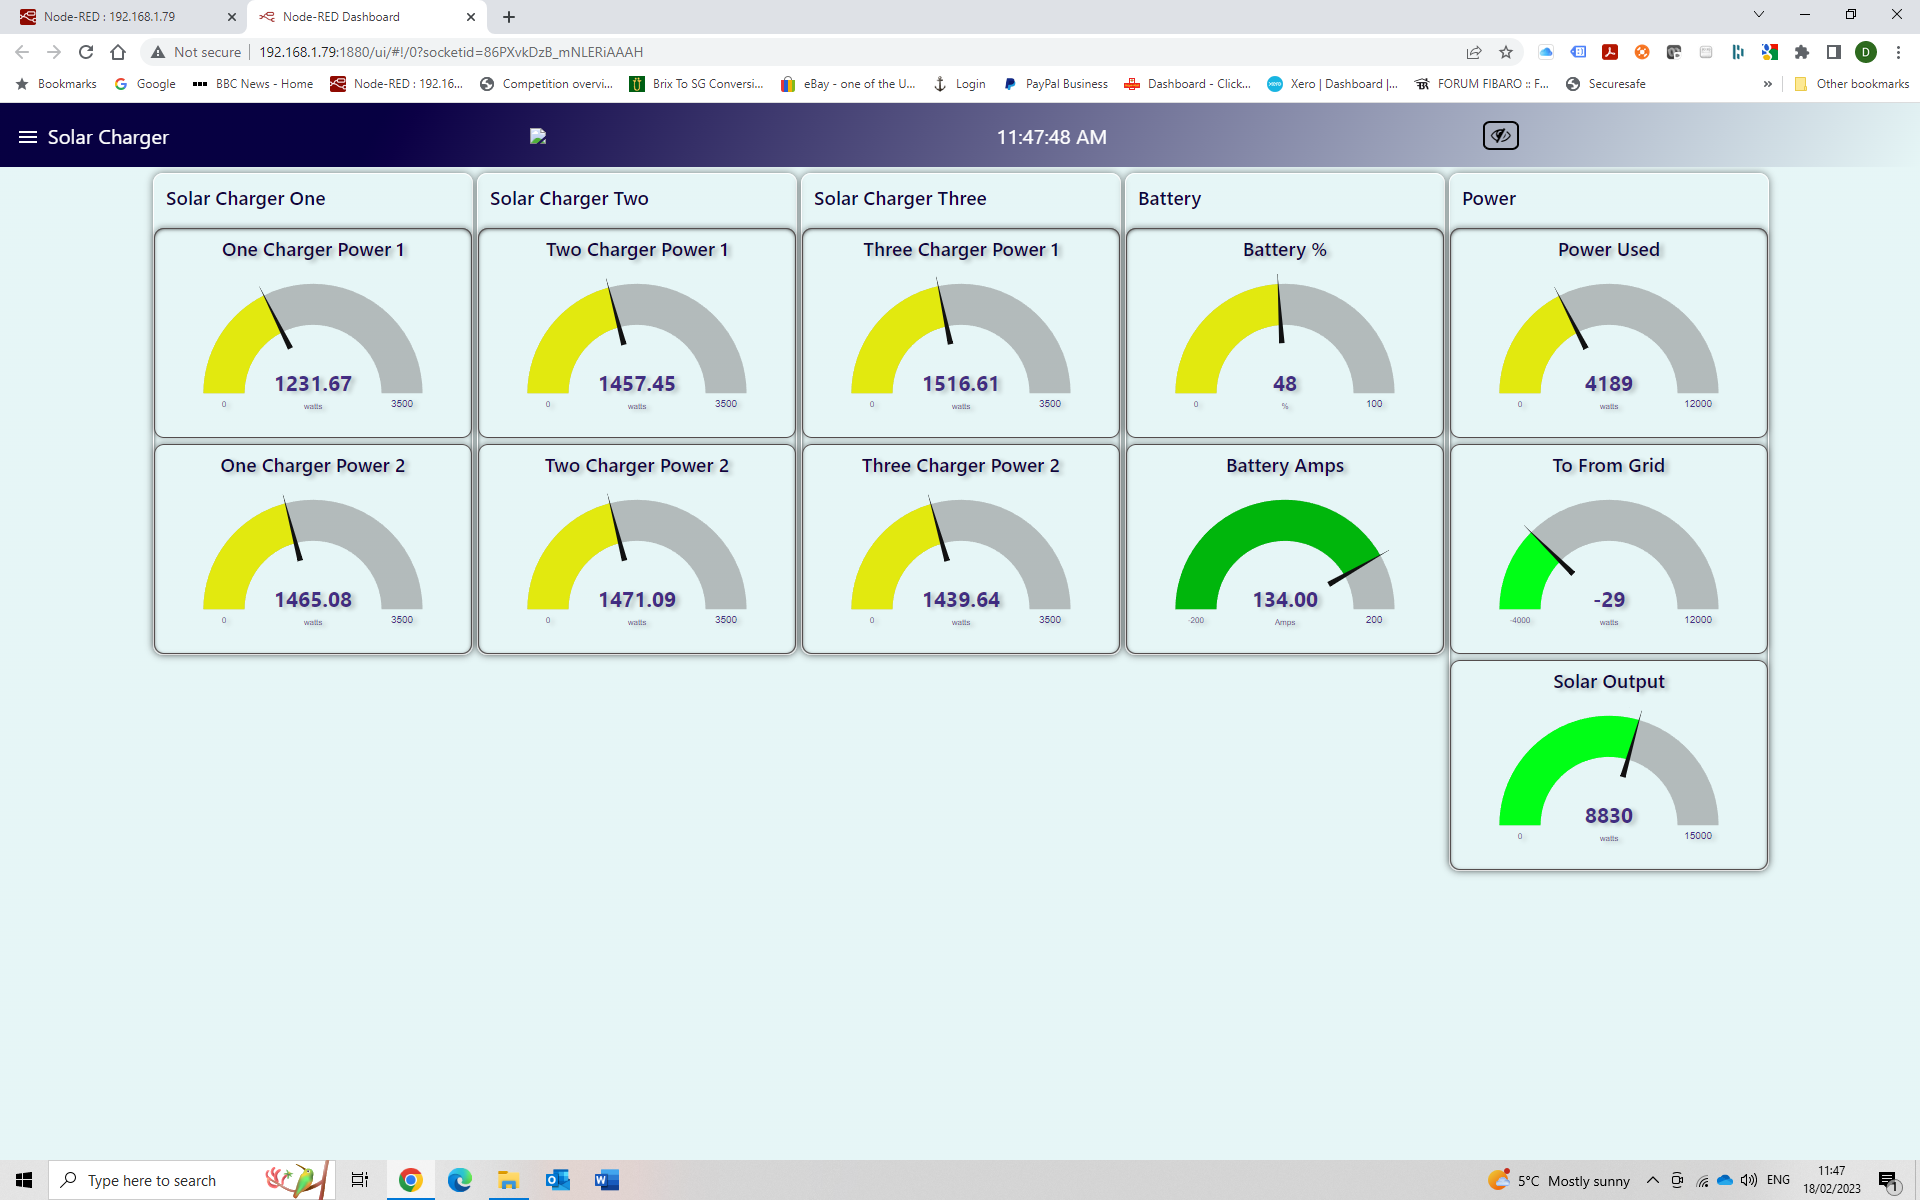
I've now got the battery and power gauges working. I noticed the mqtt out's and in's said connecting, double clicking one of them, and clicking the pencil next to the server name revealed an IP address not on my network, so I changed it to local host, and those gauges started working. Hopefully my PV Output will now start working as well.
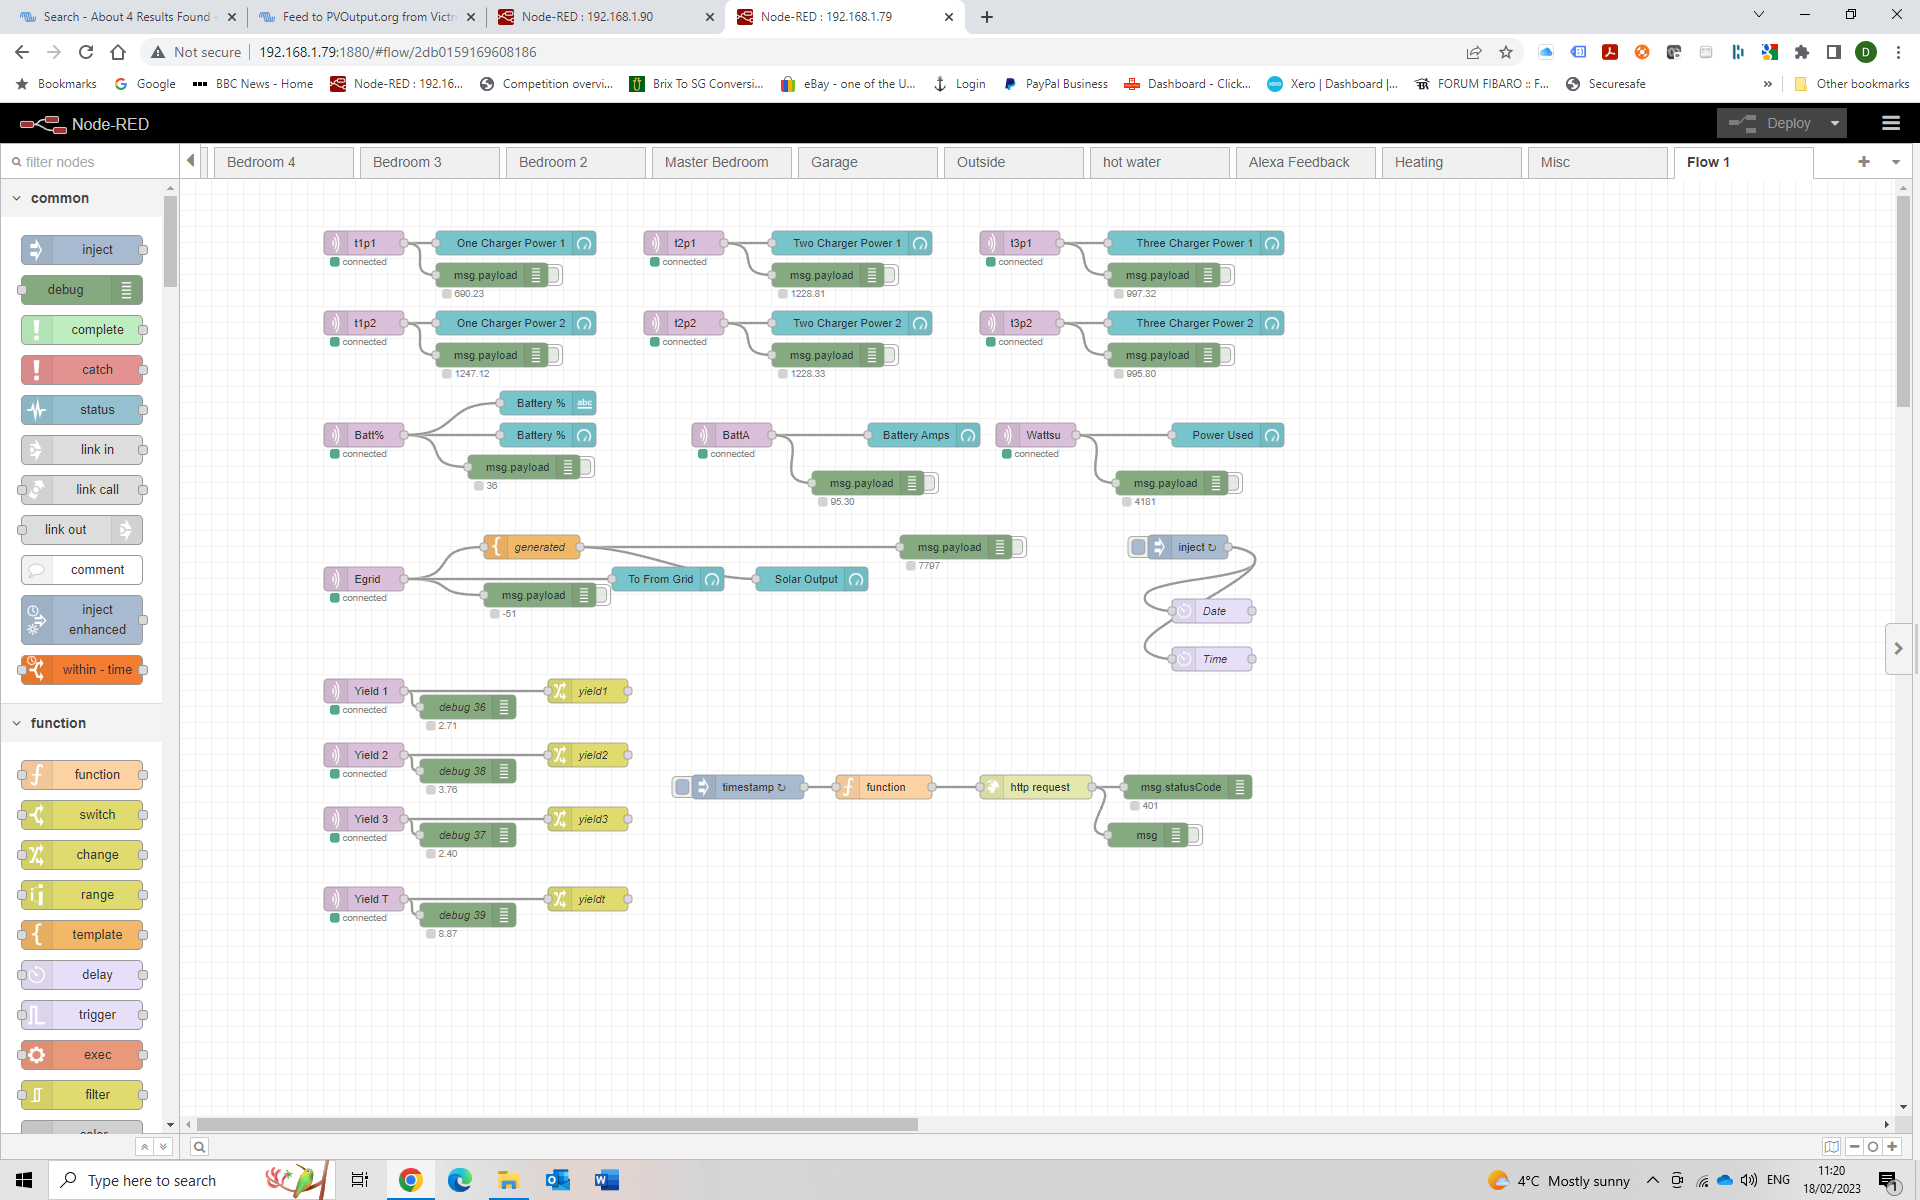
I've also realised that the author has MPPT's with dual trackers, so I can do away with the "Tracker 2" bits, and the charger gauges aren't working because its dark outside.
Still need to figure the stuff out mentioned in my previous reply, although I think they can be deleted (shown below) as they don't actually connect to anything on the PV Output Flow, and I therefore suspect this is what @Spazpeker was using to send stuff to his Pi.
I'll update the thread tomorrow when I know whether it works or not.
@Spazpeker I can't see where Yield 1,2,3 and total actually come from, or where 1,2 & 3 get added together to make the total. Also not sure where pv1, pv2 and pv are connecting to, presumably the Pi?
There is another flow that has the yields attached here
the generated is actually the grid meter, the solar output gauge is a error
Thanks, all I need to workout now is how to get today's yield from my AC attached PV inverter, as the PV Inverter node doesn't appear to have today's yield.
i use another ET112 for my PV (i also use a samil python program that sends out my PV data to node red separately from victron)
I have an ET112 on my SolarEdge inverter, and there is a node for this, but its missing the "Todays Yield" value. I have it all working and uploading, what I did in the end was left the SolarEdge system separate on PV Output - its linked by the API. Node Red uploads the Victron data for the PV directly attached to a Victron system. I then created a third system on PV Output, and made the Victron and SE systems subsystems of that system, so it combines both together.
Once I've tidied up the flows, and stripped out the parts not required I'll upload them to this thread.
Thanks for posting, and you're help.
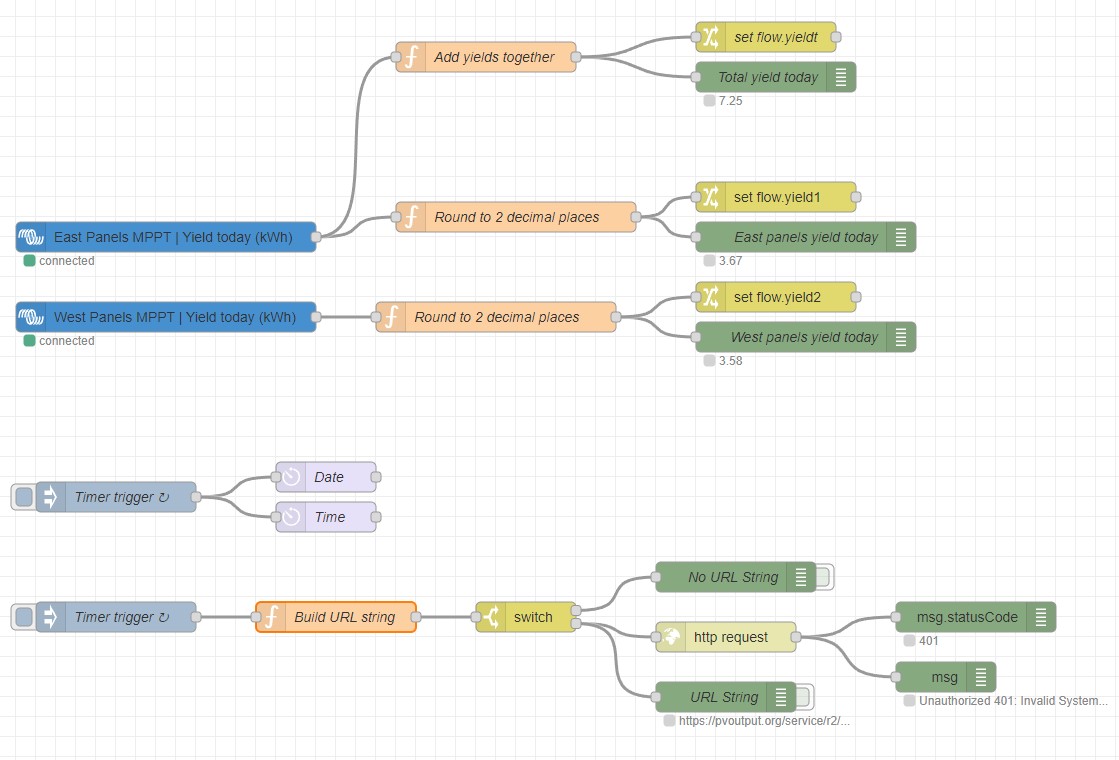
I've stripped out the items from @Spazpeker flows which are not required for uploading to PVoutput, so its much simpler to understand and convert to different systems.
You will need to install the Moment library, via the pallet, search for "node-red-contrib-moment"
In the "Build URL string" you will need to add your PV Output API key and system ID, which is found at the bottom of the settings page on PV Output.
You will need to select your MPPT's / solar chargers, simply double click each of the blue Victron nodes, and select the appropriate charger on the drop down list, and then make sure the measurement is set "Yield today (kWh)".
If you have more than two solar chargers, you'll you need to add more nodes appropriately, and basically replicate what is there, also alter the "Add yields together" function to add in the extra data, but hopefully you can work it out.
If you only have one then you'll need to remove quite a bit, as there's no need to add stuff together to get a total, or I think you may just leave one unassigned, but not sure on that.
Much appreciation and thanks to @Spazpeker for posting the original flows.
Edit: 21/03/2023 I've realised there are some errors in this, as it was combined from two flows. So I've fixed the errors and simplified it some more now I'm starting to understand things better. I've restricted the timer trigger to only work between 04:00 and 23:00, I've also altered the "Build URL string" to use a invalid URL if there has been no solar production yet, saves spamming PV Output unnecessarily.
Ignore the Node "Yield T" shown below as its not in the flow, but is used in the gauges flow.
Edit: 29/03/2023 Minor update, added a switch node, this stops the http request creating errors when there is no upload.
Hello. This is interesting. I had a python script running some months back until I see there was an update and I have to redo it so I stumbled across NodeRed which I would love to try out. I have one 150/100 mppt and a multi II 5kva. I am very new to this but will learn. So this flow above is all needed for PVOutput for one mppt?
You'll need to modify the flow, basically do away with one of the MPPT nodes and it's connected nodes, I'd suggest deleting the top one. You'll then need to modify the Build URL node to use flow.yield2 instead of flow.yieldt.
You'll also need to select your MPPT and make sure it's set to Yeild Today (kWh).
Pretty straightforward, but if you get stuck I'll try and help.
Thanks a mil
@Ronski I think I am getting a hang of things. I take it I can not access the CerboGX node red remotely unless am on the same network as the device? I have been looking at your flows on my laptop with a local install of node-red. I can see the code and the changes as advised above.
I have one question though; why does your zip have two json files?
If you are logged into the VRM, then you can access Node Red remotely, although you may need to allow that from within the Cerbo, it was some time ago I set it all up so can't really remember.
As for the two JSON files, not sure on that one, will have to take a look tonight when I'm home if I remember.
I managed to get the node red doing its think thanks to you. I have some questions:
- Time is indicated as Europe and London, How do I change this to my location (GMT+2)
- How to populate missing paramters such as Voltage, peak etc. Adding another victron mppt node?
I'm pretty sure that the ZIP file had two flows by mistake, one was the original, the other was a modified flow.
I thought you only wanted one MPPT node, if you have two then you shouldn't have removed the second one, but you just need to add the required nodes back, set flow variables and add them together before uploading to PV Output.
The time zone has to be set on PV Output - go to "Settings" and its under general.
To upload the voltage you need to read the voltage and then set a flow variable, call it "voltage", like this.
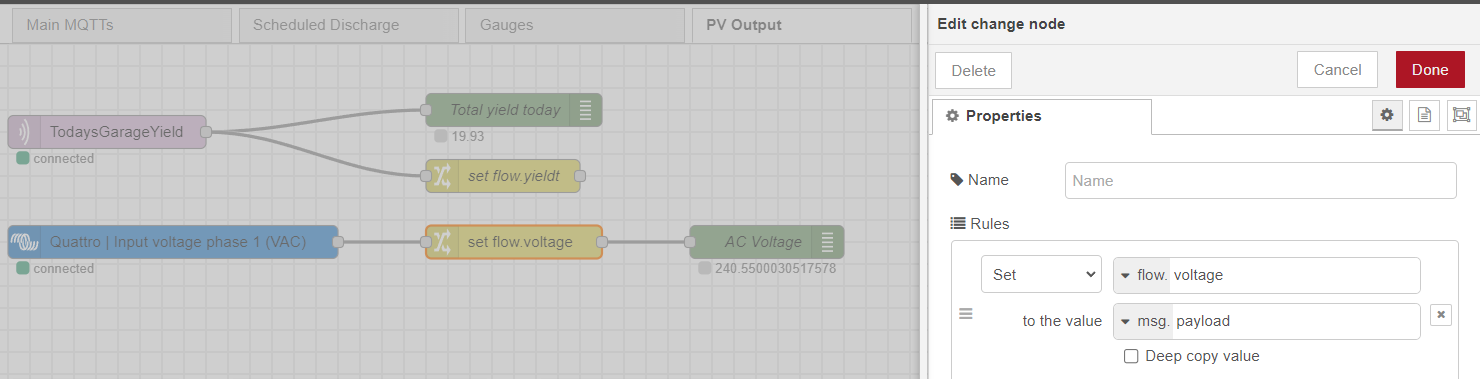
Then in the build URL node you'd need to read the voltage variable in to a local variable in the flow like this:
var voltage= flow.get("voltage")
Then modify the actual URL string to include it like this.
msg.url="https://pvoutput.org/service/r2/addstatus.jsp?key="+PVkey+"&sid="+Sid+"&d="+msg.d+"&t="+msg.t+"&v1="+msg.v1+"&v6="+voltage+"&v2="+PVtotal
There is a full list on PV Output https://pvoutput.org/help/api_specification.html#add-status-service
Thank you so much you have made my Node Red journey easier. I have tons of ideas now. I have checked out the full list of variables on PVOutput and I fully get it now and thank you for the guidance. I am read to experiment,
No for now its just the one Mppt 150/100 but in the near future I am thinking of adding another one and will experiment the summation of yield.
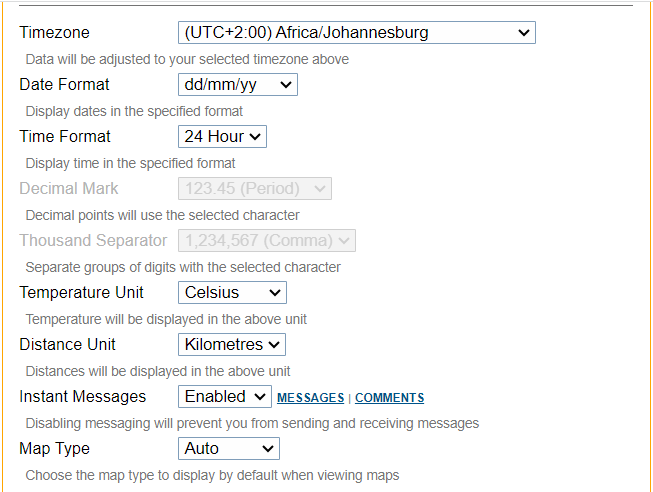 Strangely my time zone is actually set already in PVOutput so I do not know why the system is not correcting the date as outlined to that setting. Anyway for now is that we have data posting which is great.
The date and time are uploaded in the URL, presumably the time on the Cerbo is correct, only other thing you could look at is how the flow gets the current time in the time node. I'm not sure if PV Output uses that time, presumably it does, but myself and others have been caught out with the time zone on PV Output defaulting to Australia in the past.
Node Red is extremely powerful once you get the hang of it, enjoy.
I managed to add the pv voltage and ac consumption outputs. in debug the correct time is shown. However PVO has London time. it could be a bug on their part I do bot know.
I also notice my debug nodes are not showing their output in the flow like your original ones. Its helpful to see what is going on. Any ideas?
There is a checkbox in the debug node properties you need to tick to get it to display the values it receives.
Thanks. I am almost there! I have added pretty much everything I need except temperature. Any ideas where I can get that variable? I am thinking Openwheather? I have an API and location code am just wondering how I include all that in the flow so that can be retrieved and displayed as V5
where do you access the dashboard gauges added by the flows as seen in one of the posts?
Do you not have a spare temperature sensor? I just use one of those for ambient temperature.
There is a specific URL for accessing the dashboard locally, can't remember what it is though. The other way is via the VRM, same way you get to Node Red, but select the lower Dashboard option, although you will need something on your dashboard first of all - plenty of guides on YouTube.
I experimented with the OpenWeather API using the get http function. I am certainly doing something wrong as I intend to create a variable "temp" to store the value in the API output under the Main header "temp". That is where the issue seems to be I think.
My thinking was to connect from the timed Trigger to Http Request where the API is indicated in the URL. Then link this to a Change Node which sets Msg.payload.main.temp to Msg.temp
Then assign the var to v5 which PVOutput uses for temperature. Alas I am not getting any temp populated even though I can see the temp API output and my filtered debug node is showing the temp ok and I know the API is working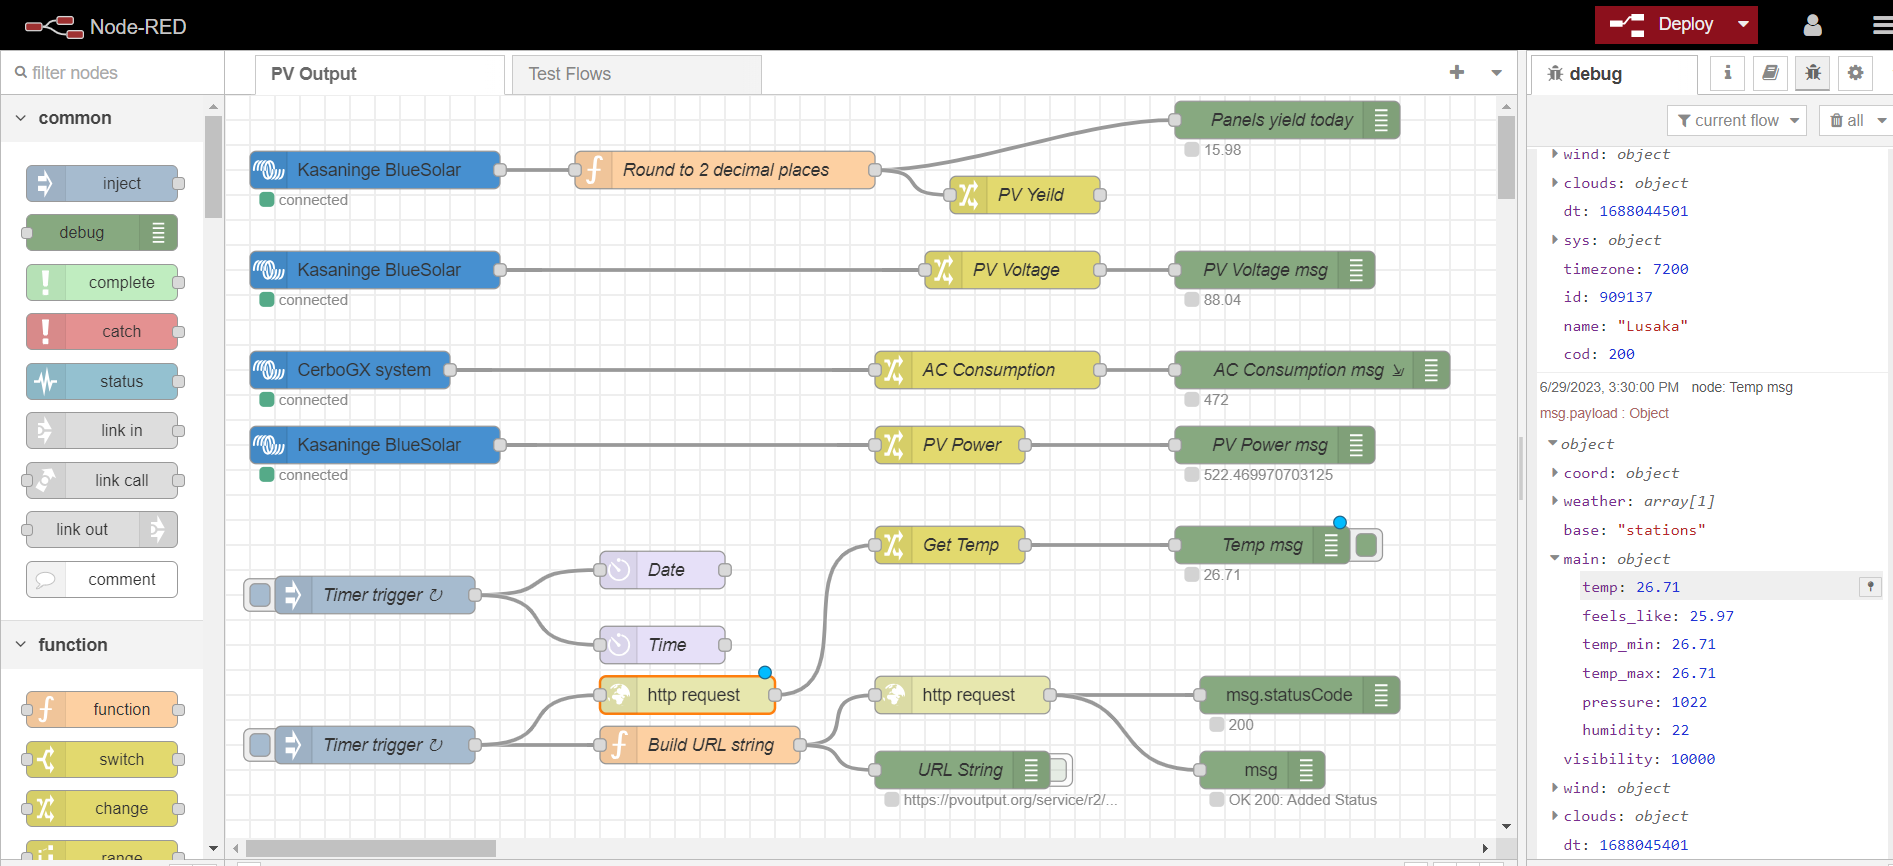
In your change node, you should have Set selected, in the box nex to it click the dropdown and change it to "Flow", and in the next box enter just temp, so you have flow.temp, the line underneath most likely should be msg.payload.
Then in your Build URL node you will need:
var temp= flow.get("temp")
now you can use temp in the actual URL build line.
Hope that helps
To acess your dashboad locally you can use the IP address of the Cerbo like this
https://192.168.1.200:1881/ui/
That is exactly what is there! And in the Debug node there is a display filter of msg.payload.main.temp to display from payload instead of the whole thing which has other weather data.
I even tried setting the flow.temp to get data from msg.payload.main.temp
The var temp = get.flow("temp") and msg.v5 = temp is defined and in the Build Url +'&v5='+msg.v5 is added but PVO is not displaying any temp data.
In my searching I have also discovered that the OWM have a node which I have installed in pallete but alas the API from the weather site is being indicated as invalid when I Deploy. Something I need to figure out. Different challenges-lol.
This is fantastic!!
Now I also need to get my Comsumption data integrated.
The only problem ist, that as soon as I add "V4" I get an error message :(
Did somebody find a solution how to upload Consumption data?
I'm uploading my consumption data and its working fine.
Double check you haven't mistyped something, its very easy to do.
msg.url="https://pvoutput.org/service/r2/addstatus.jsp?key="+PVkey+"&sid="+Sid+"&d="+msg.d+"&t="+msg.t+"&v1="+msg.v1+"&v6="+voltage+"&v5="+temp+"&v2="+PVtotal+"&v4="+ACPower