question

jelle-g avatar image
jelle-g asked

Node red not loading

I am building an energy controller in Node red for Victron ESS that can be used for peakshaving, selfconsumption and Time of Use strategies. I have the code running on multiple installations on either Cerbo's or Multiplus GX devices and they seem to work fine for a while until they don't. Node Red then loads very slowly or not all and making changes to deploy them becomes almost impossible.

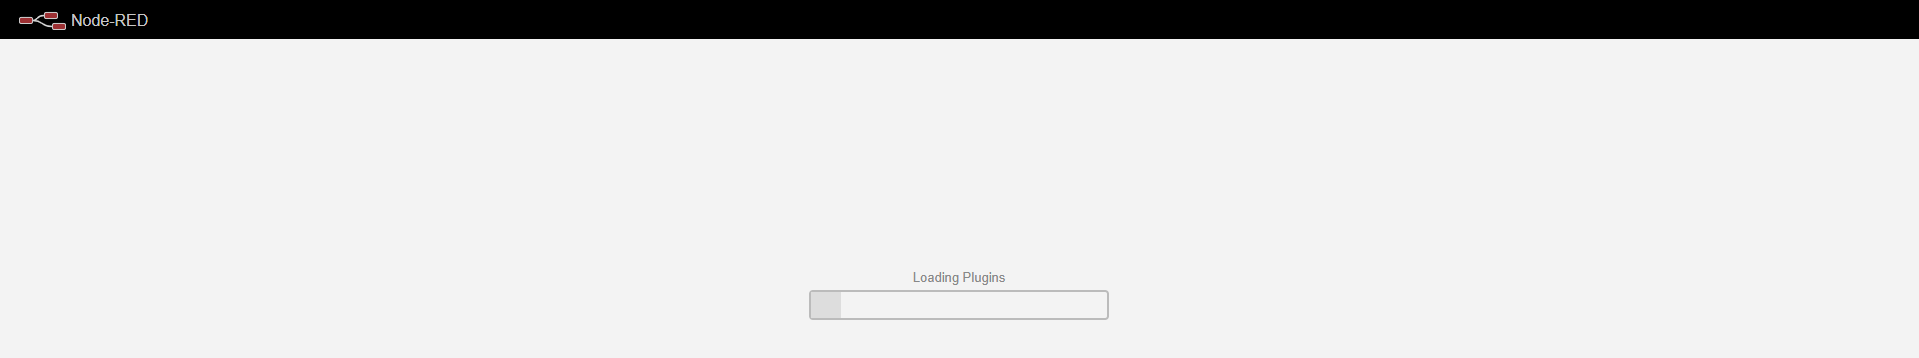
The screen then looks like this, where it often stays or sometimes eventually loads after several minutes.

1669303658726.png


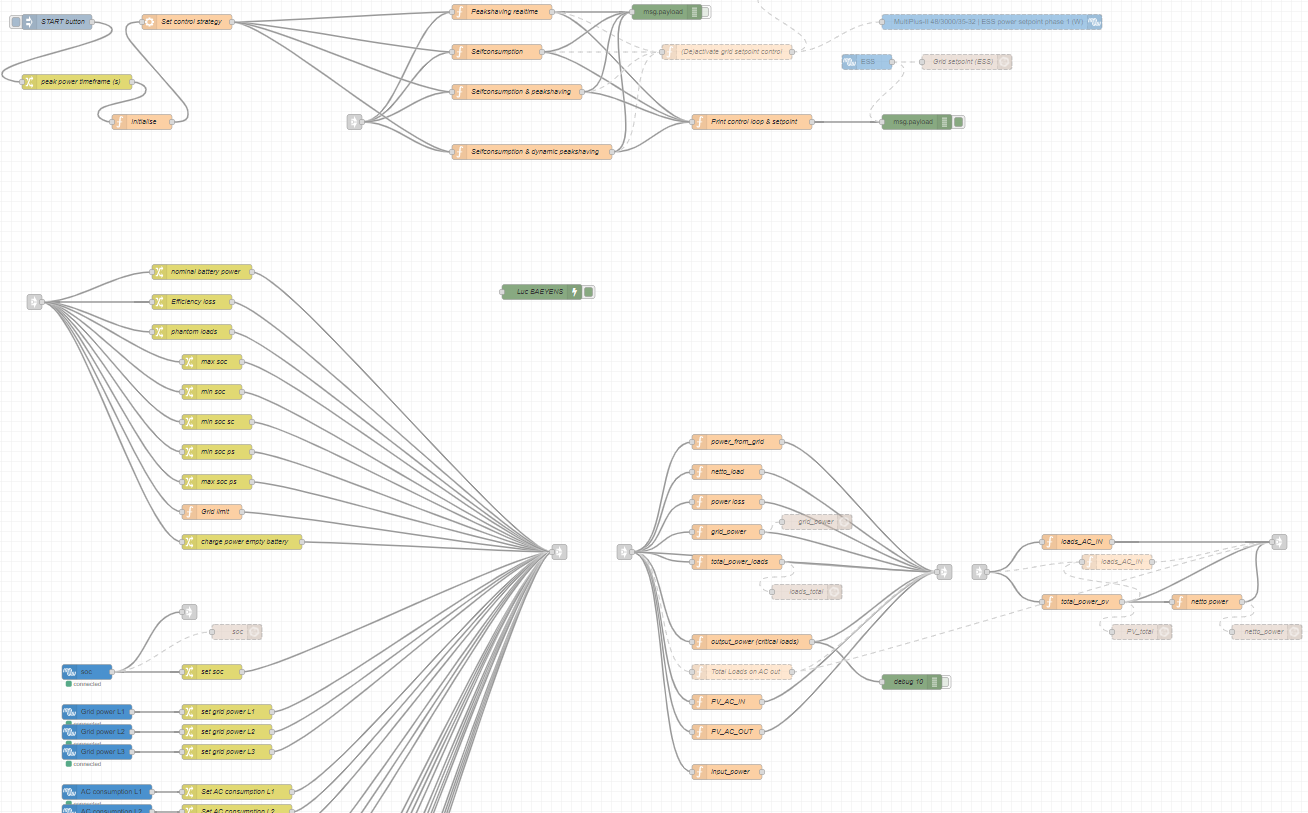
Roughly how it works: I set a few configuration parameters (eg. minimum state of charge), read out about 30 parameters from Victron nodes (battery soc, battery power, consumption, production, grid power...) and use these to make some calculations (eg. total power L1, L2, L3). Then I use all of these in functions that determine how much power should go to or from the battery using the grid setpoint. I also send about 10 datapoints to influx red in the same flow. See image:

1669302606592.png


Has anyone else experienced this and know how to fix it?

I tried restarting the whole system and updated to the latest release firmware but the problem persists. Could this be due to a lack of memory in the GX?


I will also attend the Victron webinar next week in the hope to fin a solution.


Thanks,


Jelle

Node-RED
1669302606592.png (260.1 KiB)
1669303658726.png (6.7 KiB)
2 |3000

Up to 8 attachments (including images) can be used with a maximum of 190.8 MiB each and 286.6 MiB total.

2 Answers
pcurtis avatar image
pcurtis answered ·

I have seen similar effects at times but nothing like so dramatic and my Node-red system is probably more complex than you show. The magnitude of the issue seems to be dependent on the time of day.

I have continuous monitoring of upload and download rates and at times the download rate is reduced with periods without any activity but other internet access is normal and very much faster. This reduction never occurs on my local network, only through the VRM Proxy servers, so I have always put it down to high loads on the particular servers. It has never been a serious enough problem to be worth reporting and has always been quickly fixed.

I also have monitoring within my node-red system including memory and CPU usage and CPU temperature which display on my dashboard and I would recommend you do the same if you have any concerns. node-red-contrib-os and node-red-contrib-cpu from the palette will give a good start. For reference I am using a Raspberry Pi 3B+ on my 'operational' system and CPU use is ~ 10% and memory ~ 28%. There are more details in my profile

2 |3000

Up to 8 attachments (including images) can be used with a maximum of 190.8 MiB each and 286.6 MiB total.

Dirk-Jan Faber (Victron Energy) avatar image
Dirk-Jan Faber (Victron Energy) answered ·

I haven't encountered this on the systems I've tried, but probably am using less complex flows. I would probably try to split up the flows into smaller parts and try to figure out where the cause is. Another tip is that in functions you can use things like: node.warn('.....') to add extra debug logging.

2 |3000

Up to 8 attachments (including images) can be used with a maximum of 190.8 MiB each and 286.6 MiB total.