question

saboken avatar image
saboken asked

One day with my Multi plus II how to read graphs?

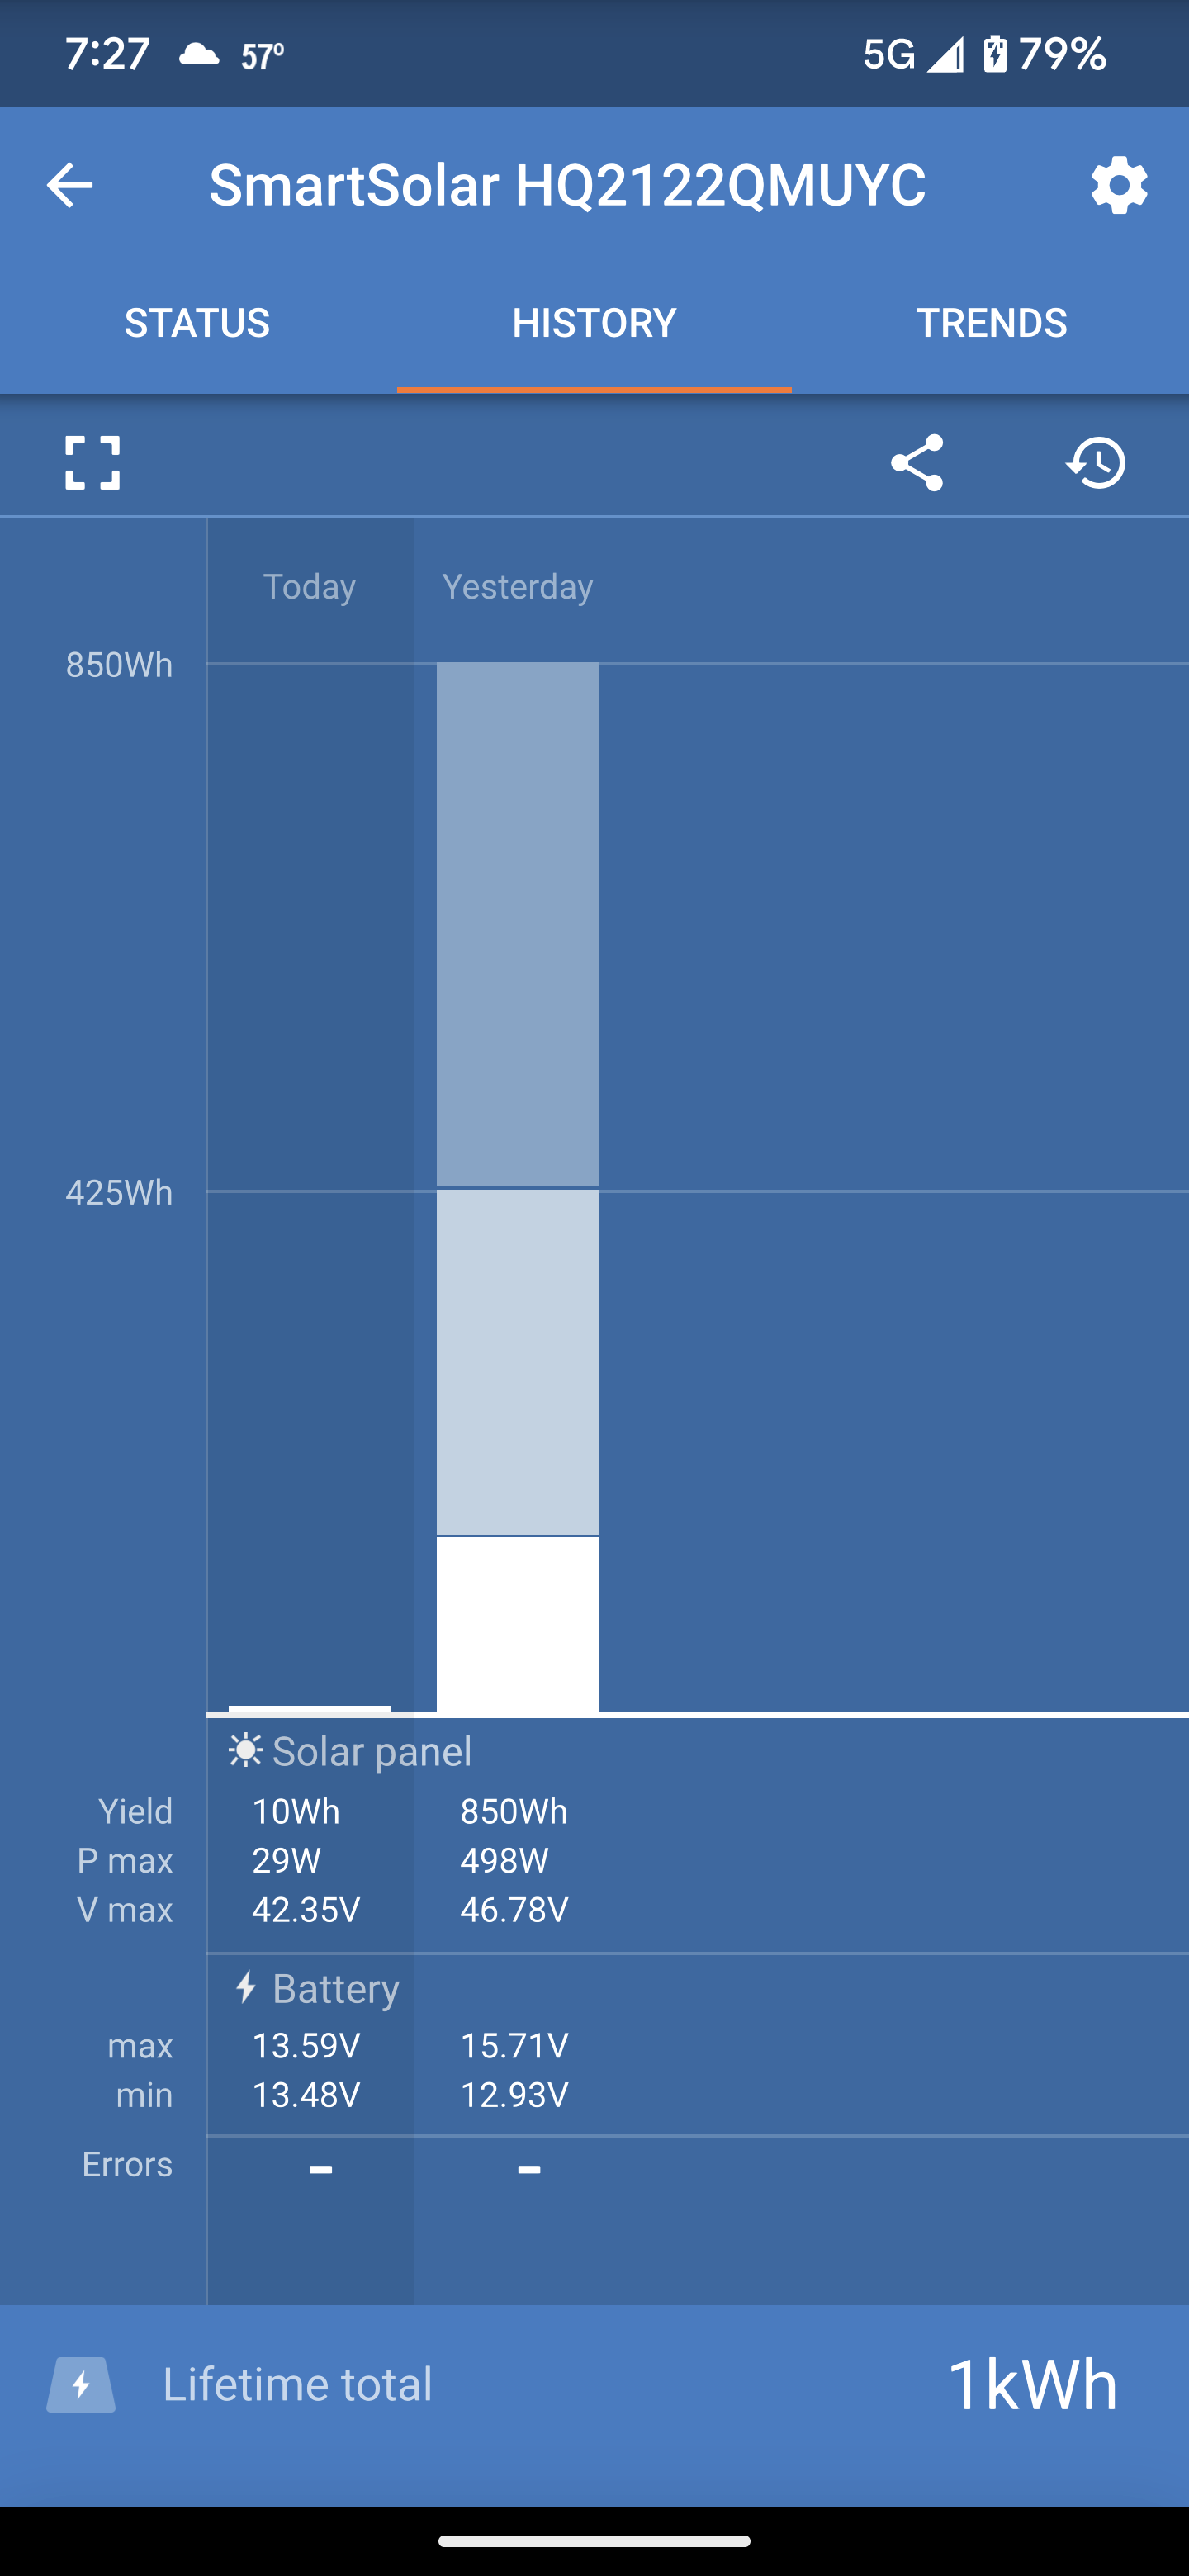
What am I looking at under solar panel yield? Is this P Max V Max , the yield says 850wh my 2 game changers are 540wh combined. Does this mean under the same circumstances I could have fully charged the batteries and had 310wh available through the day above and beyond what the batterys needed if they were fully discharged? Just learning what all this information means.

screenshot-20221030-072745.png

charger
2 |3000

Up to 8 attachments (including images) can be used with a maximum of 190.8 MiB each and 286.6 MiB total.

2 Answers
Alexandra avatar image
Alexandra answered ·

@saboken

Welcome to the interesting world of power generation. The graphs you are seeing are from your mppt only. Not what the multiplus 2 has used or done.

Going to start with all solar panels are rated at 25°C at 1000w/m² (which in real world conditions are not normally the case) but the two figures relate to your solar panels specifications.

P max is usually the maximum power tracked for the day. (So is affected by temperature and irradiance and if you have over or under panelled).

V max is the max voltage seen or used by the charge controller. (Also affected by temperature and tracking.)

But a good way to check of panels and set up are ok.

I am sure other guys here have other interesting uses for the information as well.

2 |3000

Up to 8 attachments (including images) can be used with a maximum of 190.8 MiB each and 286.6 MiB total.

yann avatar image
yann answered ·

Informations means yesterday you got 840Wh from your PV. Some goes into the battery, some may have been used directly.

You can also see you needed 425Wh to charge the battery up to the float stage, that means to almost 95% soc if it's lead acid battery.

2 |3000

Up to 8 attachments (including images) can be used with a maximum of 190.8 MiB each and 286.6 MiB total.

Related Resources

Additional resources still need to be added for this topic