In the manual for SmartSolar MPPT 100/15 there is a graph (see below) showing how the charging voltages adapt according to the battery temperature. So colder battery gives higher voltages, and vice versa. So you would expect linear curves depending on the battery temp, maybe with some overvoltage protection at really low temperatures.
But instead the curves look totally strange. There seems to be some kind of overvoltage protection hitting at -20C, but then at -30C the voltages goes down even lower, to non-compensated values. At the high-temp end it looks even more strange, with a really deep dip down to 12V between 50C and 60C, and then going to non-compensated voltages over 60C. Also there seems to be som kind of hysteresis between 48C and 50C?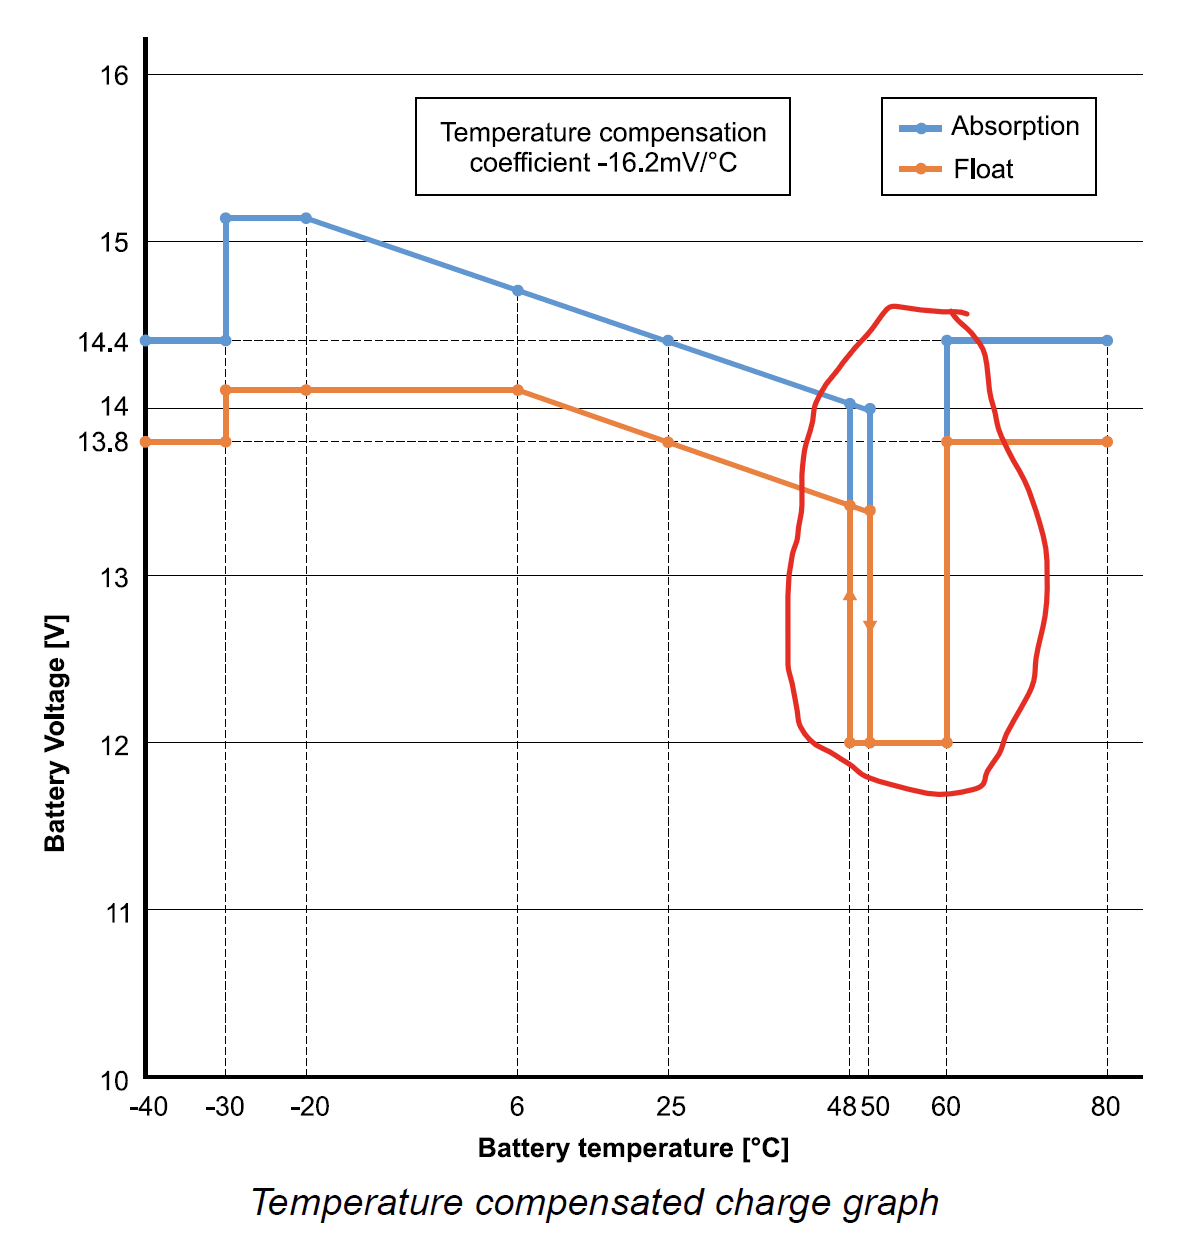 I'm no battery expert, but when the manuals just states "the example uses a -16mV/°C temperature compensation coefficient", and says nothing more about the strange-looking curves, then you really want to know how this is assumed to work?
If I check other sorces, for instance at <https://batteryuniversity.com/article/bu-410-charging-at-high-and-low-temperatures>, I see the curves below, which don't show any dips or other thresholds. Can anyone from Victron maybe shed some light on this (and maybe also add relevant informative text into the manual)?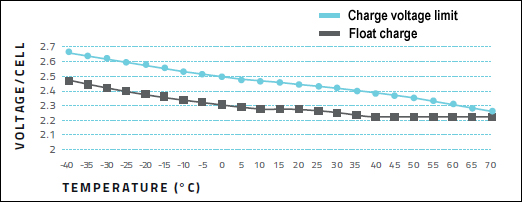
asked