I want ask, if there is any forum where I can see dashboards from node red of other users and chance to discuss / download a code ?
Thanks
Alex
I want ask, if there is any forum where I can see dashboards from node red of other users and chance to discuss / download a code ?
Thanks
Alex
Hi @Alda,
not specifically here in the community, unless someone posts a dashboard. You may want to try the search feature.
The best source is the official Node-Red Forum: https://discourse.nodered.org
Hi @Stefanie
Thank you for your answer. I already made some my own flows on the other HW, but not now I want install a node red to Cerbo GX and not sure if victron nodes are configured out of the box after large FW installation and also visual solutions of other users would be fine.
Alex
What do you mean with 'configured out of the box'?
The large image (Venus OS large with Signal K and Node-RED) does not have an example dashboard or pre-configured Victron nodes.
As said before, there are only a few dashboard examples here in the community, for example: https://community.victronenergy.com/questions/73741/venus-os-large-node-red-and-signal-k.html
I mean when I have running venus os system with cerbo, inverter, battery and MPPT and switch to large FW and insert into node red a victron node to as mppt what is actual produced power, this node knows natively adress (ip adress or adress on modbus) where to communicate (ask) ?
Super. Thanks. One more question. Dashboard from node red runs parallel with original VRM portal ? I'm asking about cpu load. Is any prefered refresh rate for node red communication ?
There is only network communication to the VRM portal. Nothing that put any stress on the cpu. Yes, both run in parallel and no preferred refresh rate. The more running flows you have or the bigger they are, the higher is the load. But I can't tell when it is too much. Try and error ;-)
@Alda I have a Node-RED system similar to what you describe and I am happy to share flows and dashboards layouts but there are a number of potential problems in sharing for specific systems. I have tried to load flows that I found in this community but unless the systems are very similar you get so many warnings of missing or incorrectly configured nodes that I gave up. Fortunately our systems sound similar and I have tried to keep to a standard palette so it might be useful.
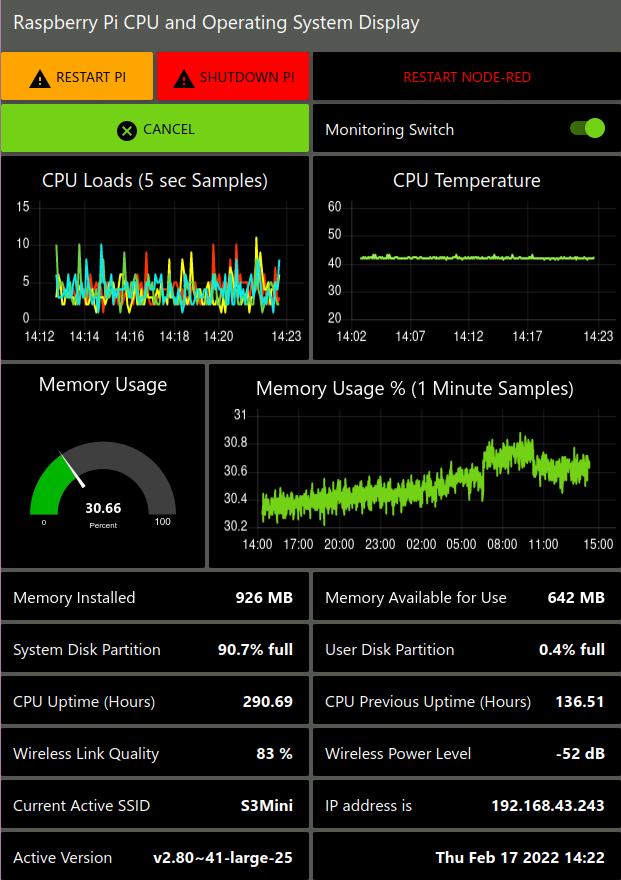
A potential problem with others using my flows is that I have modified a system file to allow use of persistent context variables which allow me to preserve values between restarts and for diagnostics - the context variable are then automatically saved to an external file every 30 secs - the Node-RED information tells you how to implement it by modifying a configuration file. Another possible problem is that I am using a Raspberry Pi and some of my code for diagnostic displays of CPU and other operating system information may differ.
I am not sure how the Community views outside information but in general I find it useful to document what I do and I note that many members have a link to their web sites in their profiles.
System Loads: On your concerns expressed in communication with @Stefanie on system loads I have a comprehensive diagnostic dashboard which displays CPU load, RAM usage, disk use etc as well as uptime for the OS, OS version and network address. The CPU load is low and I have done a few experiments - initially I limited some of my flows but leaving them at the 5 sec updates did not noticeably increase the CPU load from about 5% average over the 4 cores. Memory use is about 30% of the 1 Gbyte available on the Raspberry Pi 3B+. It is probably best if I insert a screenshot.
I can not give definitive information on data usage to the VRM as i am currently experimenting with use of MQTT using the Victronenergy broker but I would have noticed if it was much over 1 Gbyte a month as I use a tethered mobile phone. I ought to look into adding that to the dashboard as MQTT potentially increases data flow a lot.
EDIT: I now have added some data usage information to my diagnostic dashboard and the combined Wifi Tx and Rx rate on the Venus OS is ~2 Kbytes/sec with additional peaks when deploying changes.
Hi
I made a dashboard in node red for my rv. I have here a short video of it. No sound only the video. ;)
As mentioned just copying and use the code is not as straight forward.
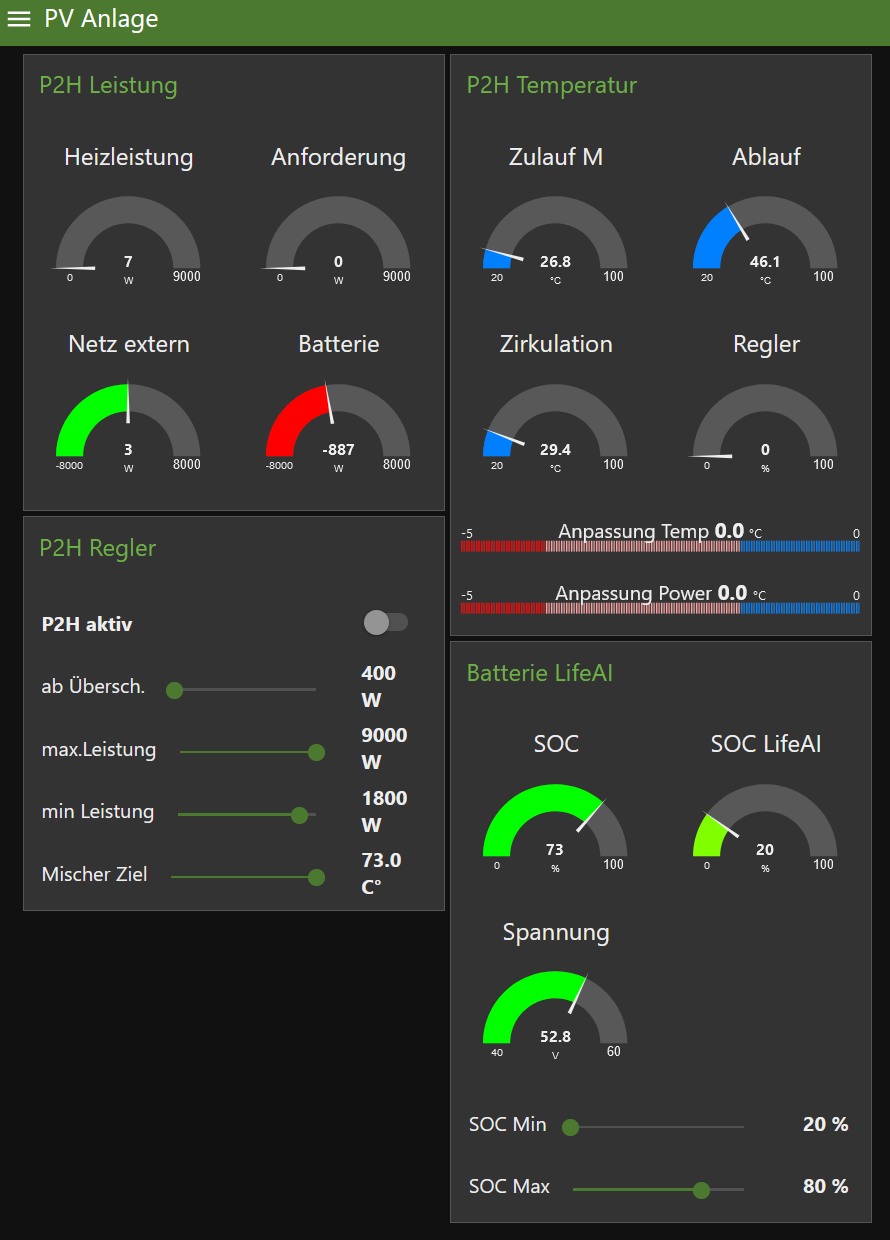
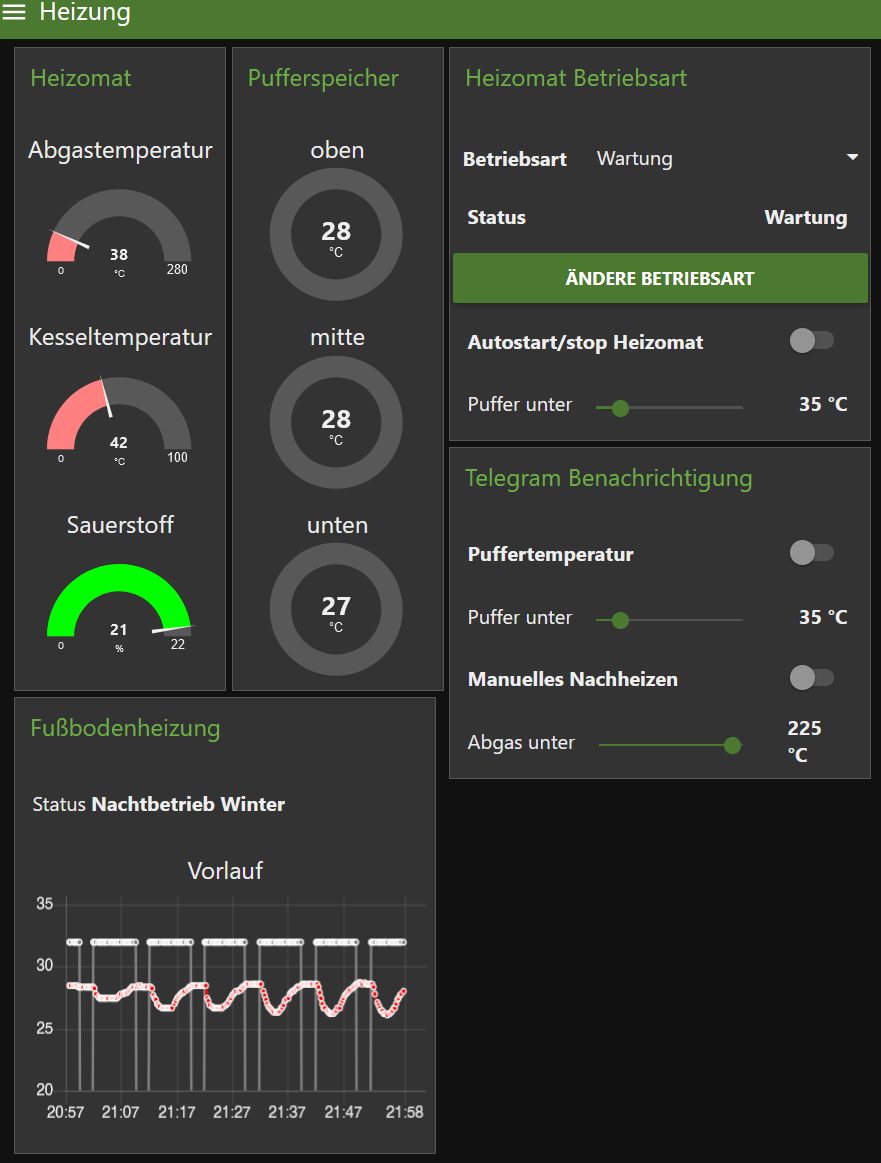
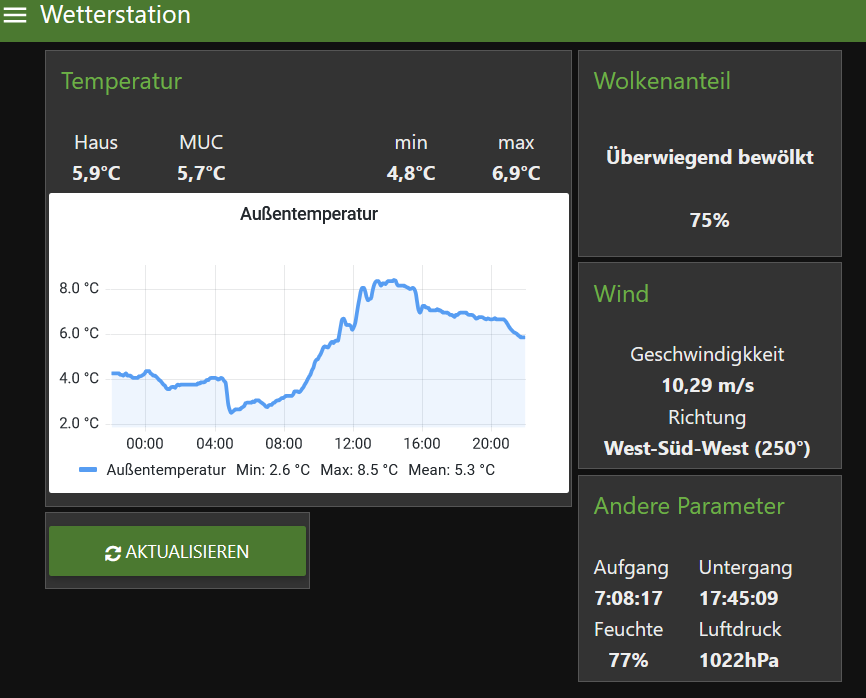
Here my current implementation