It appears that every ten minutes (exactly) the solar output from the solar controller is spiking downward. The unit is brand new (4 days) and just started doing this today. Any help in troubleshooting or education will be greatly appreciated.
asked
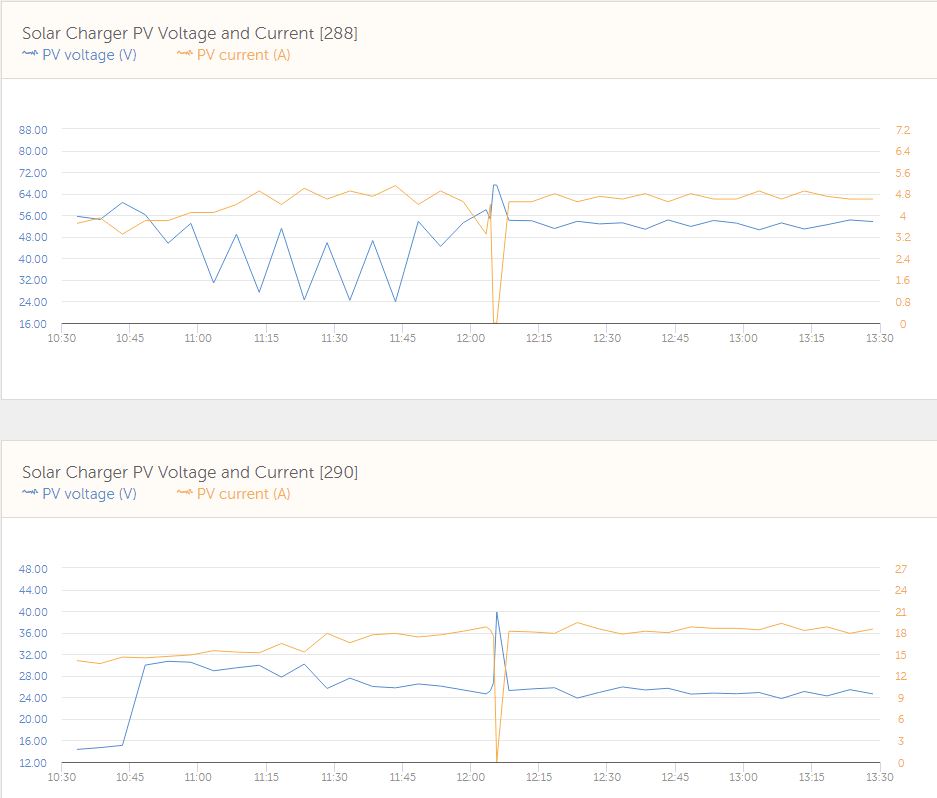
Help understand the output from SmartSolar 100/50 (picture)
Hi Todd. Is the mppt 'standalone', or subject to external control via ESS, DVCC, or somesuch? If it is, maybe look there first.
It *may* be related to mppt tracking, Unlikely I'd suggest, but that would probably only happen in Bulk mode, not Absorb or Float.
Whatever it is, it's taking it's time, long enough for the per-minute monitoring to pick it up. That graph is for the input side (the pv). Does the output graph show something similar?
Started seeing the 10 minute behavior again today. Interestingly enough. I turned the controller off then on via ve.direct (modebus/tcp) command and it seemed to smooth it out for now.
I actually have two 8 panel arrays. One with with 4 in series by 2 in parallel and the other with 2 in series by 4 parallel. Each array has it's own identical MPPT 100/50 controller Only one of the controllers is exhibiting this behavior.
I'm starting to think I have a bad panel on the 4x2 array causing this spiking. It is probably the solar controller trying to do it's 2-point tracking magic with a bad panel and funky voltages.
Two mppt's (presumably feeding the same batts) changes things somewhat. They are 'fighting' each other, taking turns to supply current, likely when Abs/Float is reached. To make any sense of that, lower the target settings of one to say 0.2V below the other to see if they settle down.
Watching PV V &A has limited value for me. It's W output that really counts, and watching an mppt tracker wander in'n'out of optimum isn't on my to-do list. :)