This is a detailed post describing an approach I took to graphing historical data under native Venus OS.
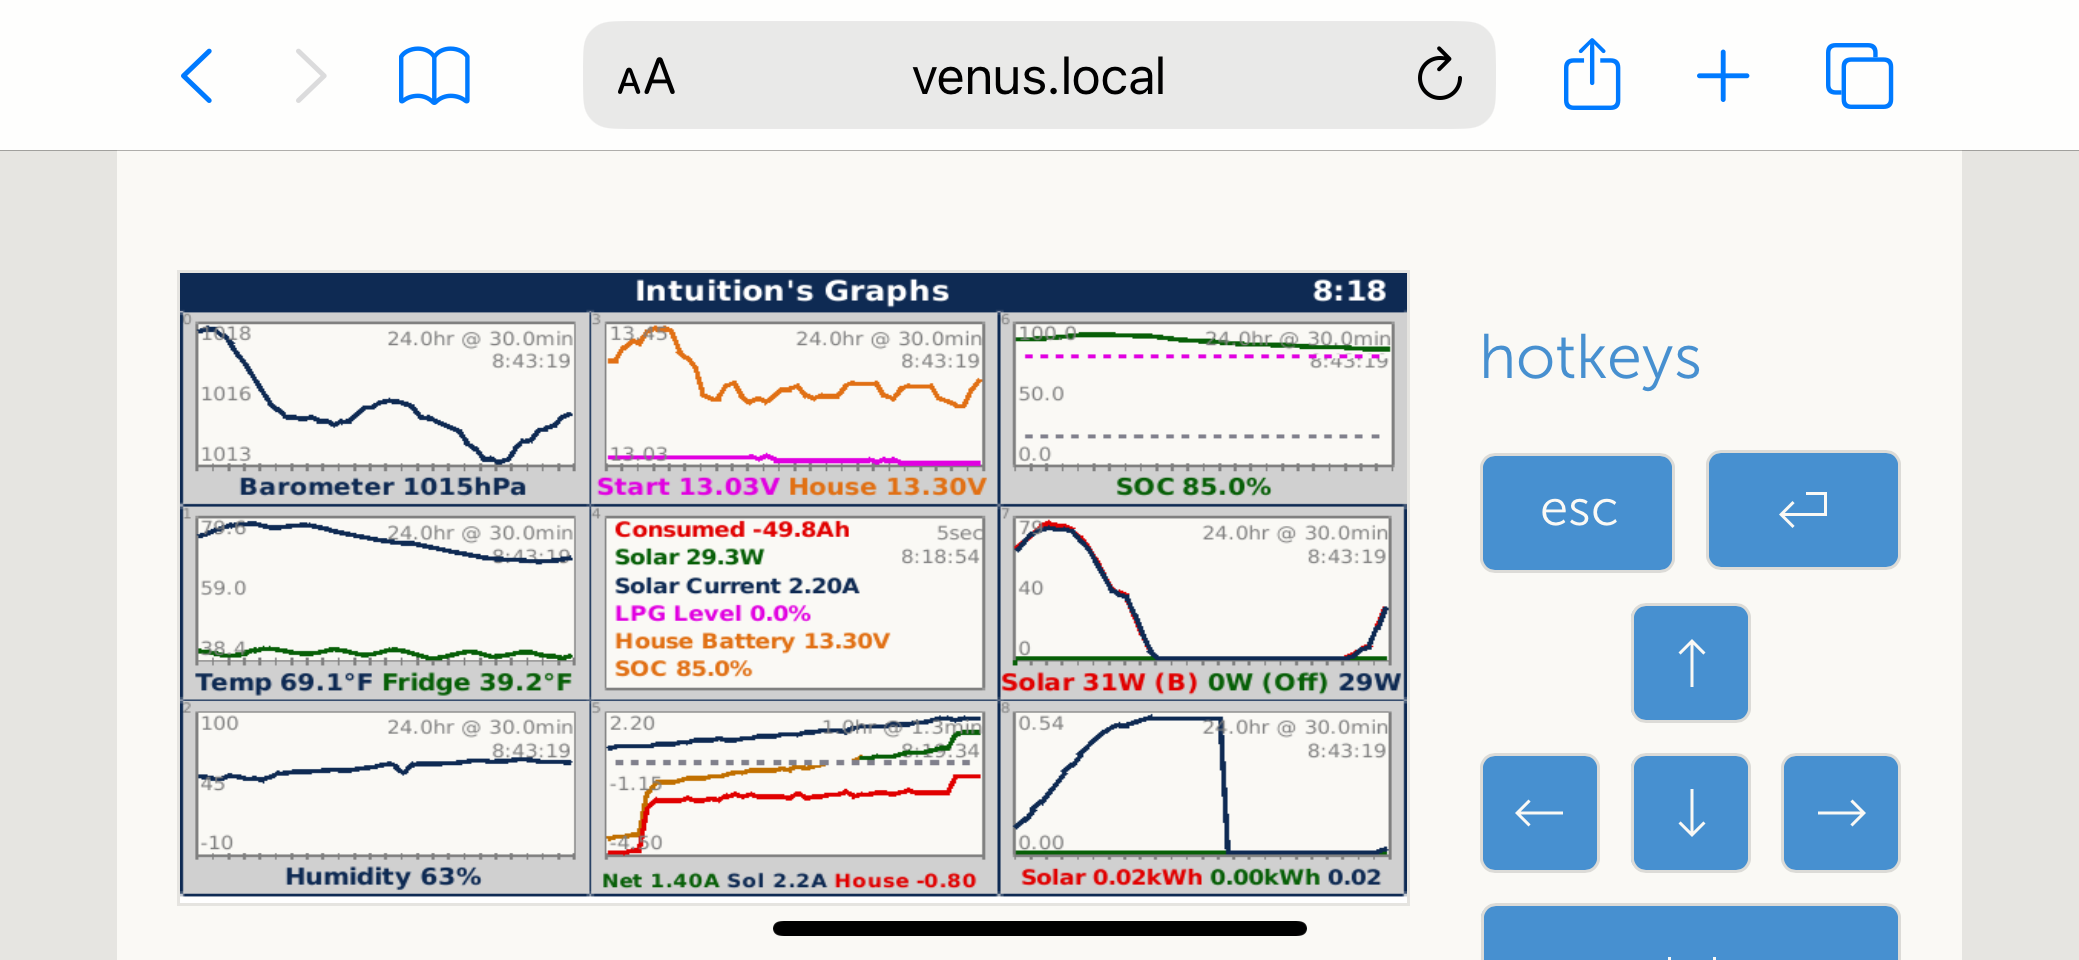
To start, here's an example of my active graphs on a single page, running Venus OS on a Raspberry Pi 3B+,

I will start by describing the process with a single graph, followed by details on displaying 10 individual graphs on a single page.
Cerbo GX and Venus OS provides a fantastic platform for monitoring onboard systems. Instead of showing the default Victron Cerbo GX energy and system pages or the extended GuiMods pages, I wanted a single display to graph historical trends for barometric pressure, outside and fridge temperatures, humidity, LPG tank levels, house and start battery SOC and voltages, solar production and net amps flowing in/out of the battery. I didn't want the complexity of Node-Red, external graphing, or the new HTML5 code. Instead, I built a set of QML 1.1 programs to directly graph dbus values. Under Venus OS, this is the only page I need to reference for monitoring 'Intuition's' performance.
'Intuition's' systems consist of 2 MPPT solar controllers, a BMV 702, several Ruuvi temperature/pressure/humidity tags and Mopeka LPG tank monitor. Simple, but typical of a small sailboat or RV. I'm running Cerbo GX on Raspberry Pi 3B+ connected to a generic 5 1/2" HDMI screen. I've been running the custom QML for the last 2 sailing seasons (fall and spring) and I'm finding the pages to be very useful.
Here's an example of the barometric pressure from the Ruuvi tag over 24 hours. This is a full-screen image, refreshing every 30 minutes.
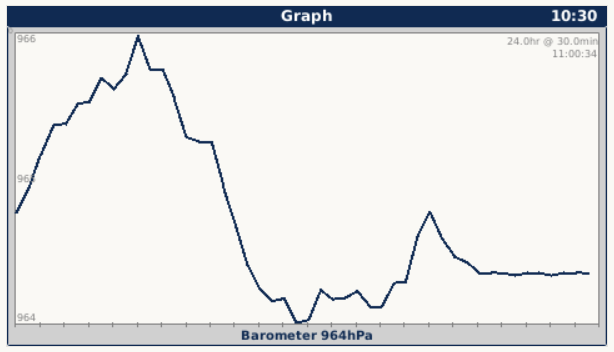
A set of dbus caption, service and instance values define the data source. In this case, the caption is 'Barometer' or '*', the service is defined as 'temperature.ruuvi_f3b48d779c54' or the service mapping is 'temperature_22' (both can be used to define the dbus entry) and the instance is '/Pressure'. The size is full screen (height is 200px and width is 400px). The qml code is very simple, with defaults for border color, border with, line color, line width, font-sizes, etc, which calls the core graphing qml program 'IntuitionBuildGraph.qml'
/*
 * IntuitionGraph.qml  -  Parent overview to build IntuitionBuildGraph
 *
 * Copyright © 2023,2024 IntuitionSailing.com.  All rights reserved.
 * Contact: IntiutionSailing http://www.intuitionsailing.com don@intuitionsailing.com
 *
*/

import QtQuick 1.1

OverviewPage {
  id: root
  title: qsTr( (systemName.valid && systemName.length > 0 ? systemName.value + "'s " : "" ) + "Graphs")

  // Use the dbus item /Settings/Intuition
  property string _myPrefix: "com.victronenergy.settings/Settings/Intuition"
  property VBusItem systemName: VBusItem {bind: Utils.path(bindPrefix, "/Settings/SystemSetup/SystemName")}

  // Begin layout
  IntuitionPageHeader {
    id: header
    height: 16
    width: parent.width
    caption: "Graph"
  }

  IntuitionBuildGraph {
    graphId:          0
    height:           200
    width:            400
    anchors.fill: parent
    anchors.topMargin: header.height
  }
}
Design notes,
1. The core graphing module is 'IntuitionBuildGraph.qml'.
2. By design, the graphing module supports up-to 10 predefined graphs, with definitions stored in dbus settings. These can be displayed individually or multiple graphs on a single page.
3. Each graph supports up-to 10 graph lines on a single display. I use this for displaying common data such as outside and fridge temperatures, house and start battery voltages, etc.
4. Multiple line definitions are entered as comma-seperated values. For example, displaying multiple temperature values on one graph is defined as,
- Captions: 'Outside,Fridge' -or- '*,*' ('*' represents system name)
- Service Mappings: 'temperature_21,temperature_22'
- Instances: '/Temperature,/Temperature'
- Digits: 1,1
5. Due to limitation with QML 1.1, a maximum of 48 data points are predefined. This allows a 24 hour graph with data points recorded every 30 minutes. This is sufficient for most trends, e.g, environmental pressure, temperature, humidity, battery SOC, etc. A one hour graph inteval will show data every 1 minute 15 seconds. For real-time display (e.g., alternator output (amps)), I've been experimenting with different intervals.
6. The 10 graph definitions are stored as dbus values, under /Settings/Intuition/Graphs/'n', where 'n' is 0 - 9.
7. The 48 historical graph data values are also stored as dbus values, under /Settings/Intuition/Graph/Cach<n>. This allows the graphs to redisplay on system restart; though, the data may not be continuous. Surprisingly, this works OK without any system performance issues.
8. The graph(s) are added to Victron's main display program (main.qml). Note, modifying Victron code is not supported and will not survive Victron updates. Added, IntuitionGraphs-1.qml to the ListModel,
    ListModel {
        id: overviewModel
        ListElement {
            pageSource: "OverviewHub.qml"
        }
        ListElement {
            pageSource: "OverviewTiles.qml"
        }
       ListElement {
           pageSource: "IntuitionGraphs-1.qml"
       }
    }
9. A set of Settings pages can be used to maintain the graph definitions. The system supports up-to 10 graph definitions and accessed through 'PageSettingsIntuition1.qml',
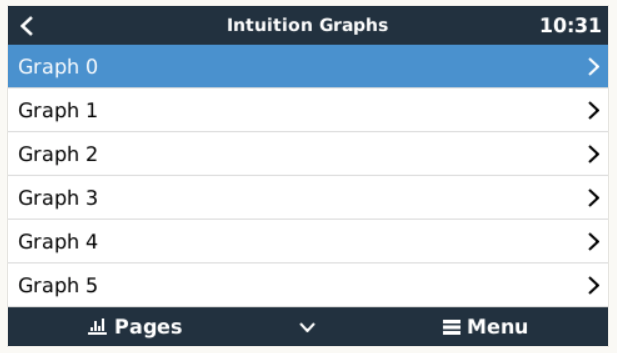
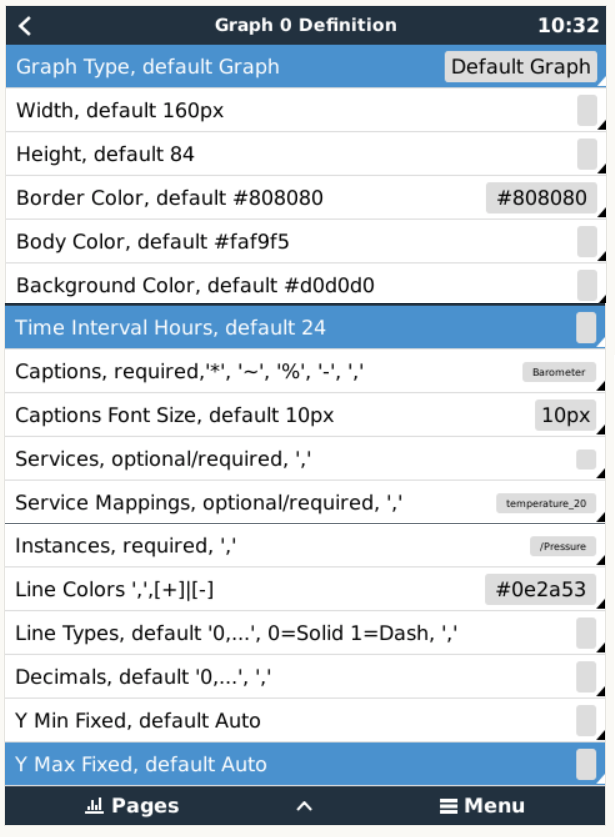
The 'PageSettingsIntuition1.qml' menu item calls 'PageSettingsIntuition2.qml', for the selected graph. This is the full set of graph '0' definitions,
The custom graph settings are added to Victron 'PageSettings.qml', which calls 'PageSettingsIntuition1.qml' and 'PageSettingsIntuition2.qml'.
    MbSubMenu {
      description: "Graphs"
      subpage: Component {
        PageSettingsIntuition1 { }
      }
As with the main.qml, modifying Victron code is not supported and will not survive Victron updates.
Note, I have found it easier to update the settings values with dbus-spy; the data entry via the Venus OS online screens to be a bit clunky.
10. Minimal values are required for each graph:
- Captions (e.g., '*' or 'Barometer')
- Service or Service Mapping (e.g., temperature_20 or temperature.ruuvi_f3b48d779c54),
- Instance (/Pressure) and
All other settings have defaults, as described in the settings page.
11. I found using the dbus service path to be a bit unreliable, due to the order of assigning the USB value. Where possible I use the 'system' path or 'service mapping'. Browse the dbus values using dbus-spy to obtain the proper service or service mapping values. Either 'Service' or 'Service Mapping' value is required.
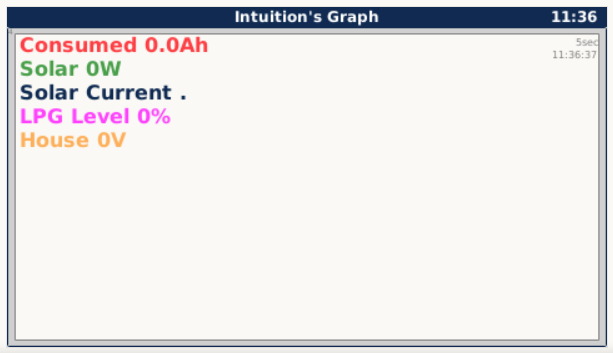
12. In addition to linear graphs, up-to 10 real-time text values can be displayed on a page. These are selected by 'Graph Type':
- 'Default Graph'
- 'Numeric Display'.
Here's an example of a text numeric display.
13. Graph 'Line Types' are either 'Solid' or 'Dash'.
14. Caption tokens control where or not to display caption values. Caption tokens are,
- Text caption
- * System /CustomName
- ~ Display graph, no caption
- % Type 0 = display graph, no caption, no value, chartType 1 no caption, no value, no UOM
- - Don't display graph, no caption, don't include totals
- blank - no title
15. Caption values are real-time, so the value may differ from the last graph point.
16. By specifying two line colors separate by '|', can show positive or negative values (orange vs green).
17. As previously mentioned, I combine all 10 graphs on a single display,
This is simply a QML 'Flow' 'Repeater', from top to bottom. Where this gets tricky is defining the heights and widths for each graph to properly fit the page and passing to the QML repeater. Here's a bit of the definition, with the 10 heights and widths bound to their individual dbus values and the flow repeater,
 // Height and width are defined here, to handle zoom
  property list<VBusItem> heightListItem : [
    VBusItem {bind: Utils.path(_myPrefix,"/Graphs/0/Height")},
    VBusItem {bind: Utils.path(_myPrefix,"/Graphs/1/Height")},
    VBusItem {bind: Utils.path(_myPrefix,"/Graphs/2/Height")},
    VBusItem {bind: Utils.path(_myPrefix,"/Graphs/3/Height")},
    VBusItem {bind: Utils.path(_myPrefix,"/Graphs/4/Height")},
    VBusItem {bind: Utils.path(_myPrefix,"/Graphs/5/Height")},
    VBusItem {bind: Utils.path(_myPrefix,"/Graphs/6/Height")},
    VBusItem {bind: Utils.path(_myPrefix,"/Graphs/7/Height")},
    VBusItem {bind: Utils.path(_myPrefix,"/Graphs/8/Height")},
    VBusItem {bind: Utils.path(_myPrefix,"/Graphs/9/Height")}
  ]

  property list<VBusItem> widthListItem : [
    VBusItem {bind: Utils.path(_myPrefix,"/Graphs/0/Width")},
    VBusItem {bind: Utils.path(_myPrefix,"/Graphs/1/Width")},
    VBusItem {bind: Utils.path(_myPrefix,"/Graphs/2/Width")},
    VBusItem {bind: Utils.path(_myPrefix,"/Graphs/3/Width")},
    VBusItem {bind: Utils.path(_myPrefix,"/Graphs/4/Width")},
    VBusItem {bind: Utils.path(_myPrefix,"/Graphs/5/Width")},
    VBusItem {bind: Utils.path(_myPrefix,"/Graphs/6/Width")},
    VBusItem {bind: Utils.path(_myPrefix,"/Graphs/7/Width")},
    VBusItem {bind: Utils.path(_myPrefix,"/Graphs/8/Width")},
    VBusItem {bind: Utils.path(_myPrefix,"/Graphs/9/Width")}
  ]

.....

 // Added Flow to allow different heights and widths
  Flow {
    anchors.fill: parent
    anchors.topMargin: header.height

    flow: Flow.TopToBottom

    Repeater {
      id: g
      model: _numberGraphs

      IntuitionBuildGraph {
        graphId:          index
        height:           (heightListItem[index].valid && heightListItem[index].value != "" ?
                             parseInt(heightListItem[index].value) : _defaultHeight )
        width:            (widthListItem[index].valid && widthListItem[index].value != "" ?
                             parseInt(widthListItem[index].value) : _defaultWidth )
      }  // IntuitionBuildGraph
    } // Repeater
  }  // Flow
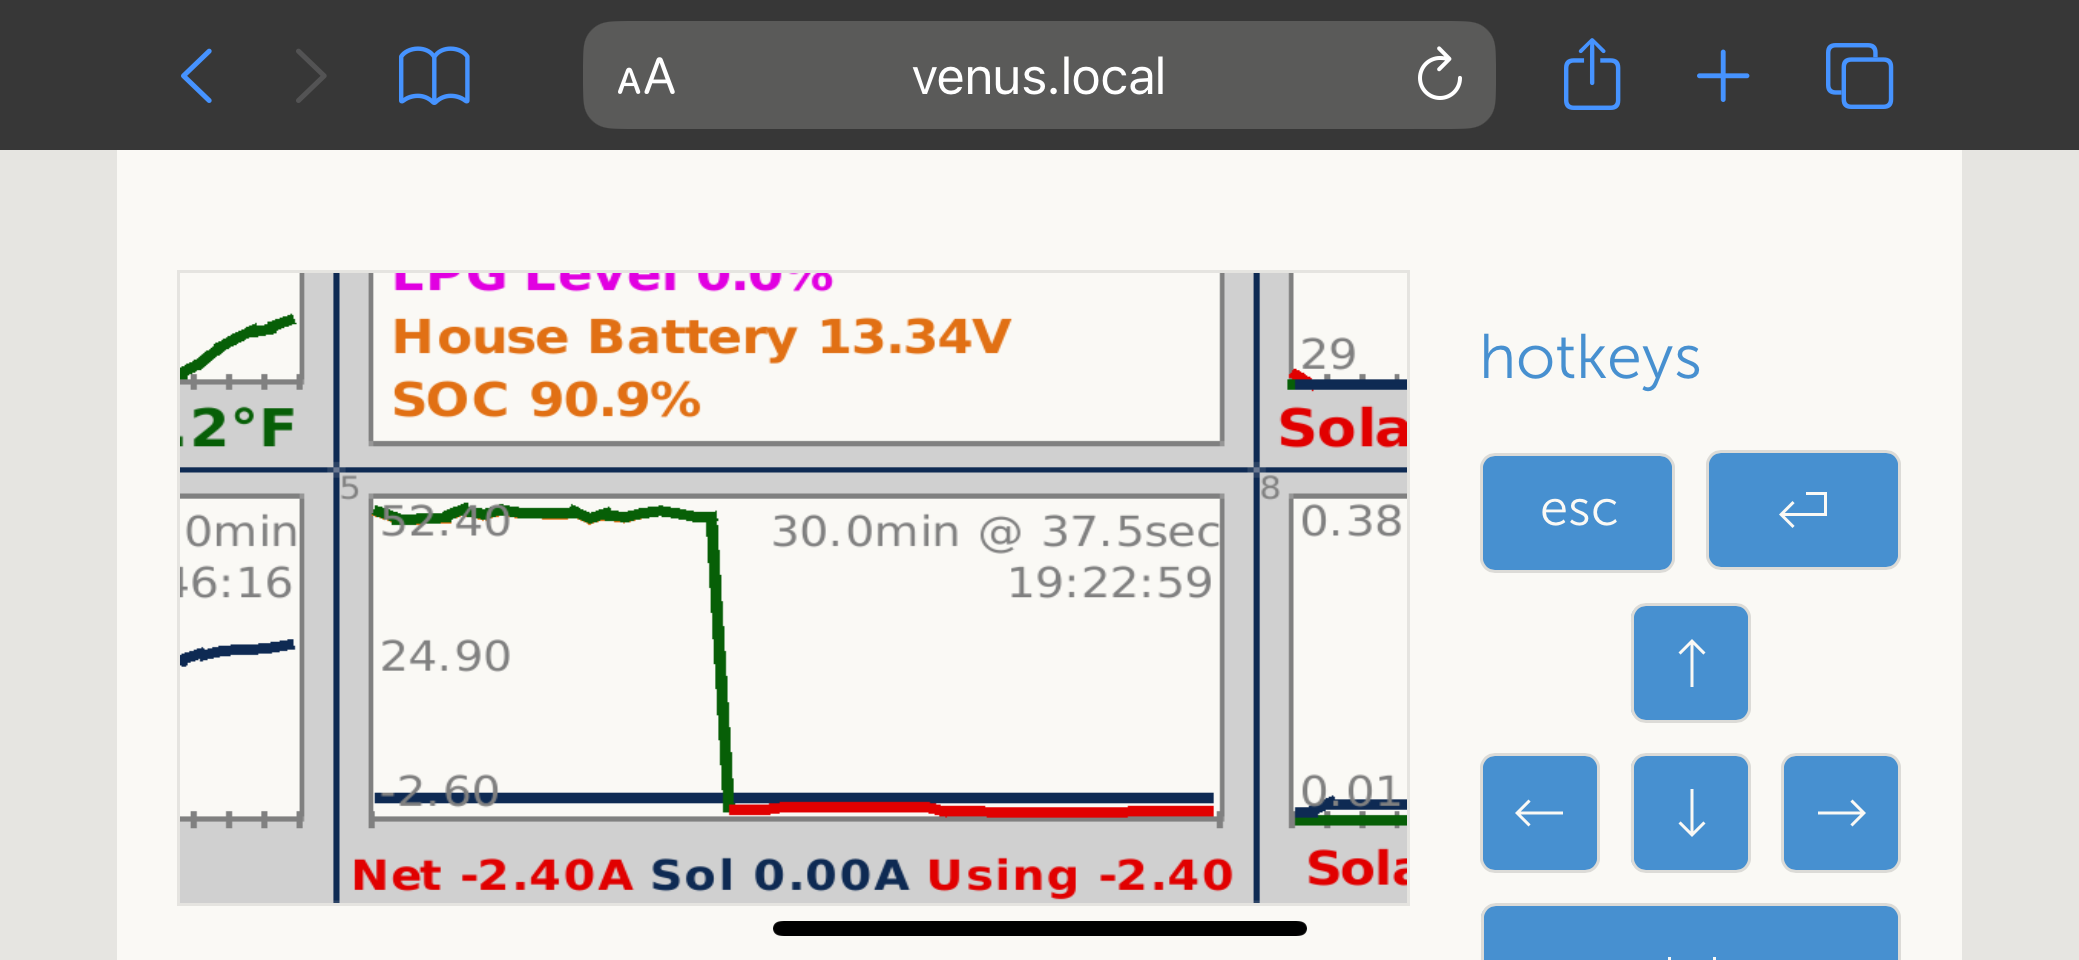
18. With the multiple graphs display, 'IntuitionBuildGraphs.qml' supports a simple zoom feature.
19. RPN forumlas can be defined for addidtional graph lines/values referencing actual data values by index. There are several active forumulas defined,
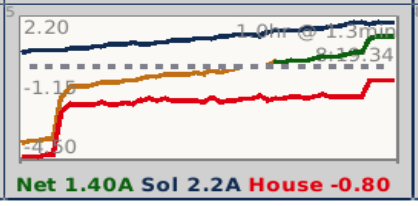
- Net Solar (graph 5) there are 2 fomulas, the dotted grey line is simply '0', The Net is an RPN formula taking Net minus Solar, '[0] [1] -'
- The SOC (graph 6) defines 2 formulas, the dotted magenta line is 80% and the dotted grey line is at 20%. Formulas are simply '80' and '20' respectively.
20. A few interesting features shown on my 10 panel graphs,
- Default colors (blue, green,....)
- Multiple graph lines on a single chart (Temp, Fridge)
- Different graph intervals (24 hr @ 30 min, 1 hours at 1.3 min)
- Graph 4 shows a 'Numeric' display panel.
- RPN forumlas
- Zoom
Note, the solar graphs (graphs 7 and 8) only one solar MPPT controler was active so the actual (red) and total lines (blue) are the same.
Final notes
1. While on the boat I have very limited access to the internet or email. I most likely won't be able to respond to any questions or comments.
2. This code is released as-is without warranty or support.
3. Implementing this requires a very intrusive setup under Venus OS with lots of dbus entries. A good working knowledge of linux and the Venus OS architecture is needed. Please don't attempt hacking at the underlying Venus OS without understanding what's required to fully implement.
4. In addition to the custom pages, several Victron qml pages were also modified. I keep the custom/modified files under /data/etc/intuition and create symbolic links from /data/etc/intuition to /opt/victronenergy/gui/gml. The full set of links,
# Links to Intuition qml files located at /data/etc/intuition/qml
ln -s /data/etc/intuition/qml/IntuitionBuildGraph.qml /opt/victronenergy/gui/qml
ln -s /data/etc/intuition/qml/IntuitionGraphs.qml /opt/victronenergy/gui/qml
ln -s /data/etc/intuition/qml/IntuitionPageHeader.qml /opt/victronenergy/gui/qml
ln -s /data/etc/intuition/qml/PageSettingsIntuition.qml /opt/victronenergy/gui/qml
ln -s /data/etc/intuition/qml/PageSettingsIntuition1.qml /opt/victronenergy/gui/qml
ln -s /data/etc/intuition/qml/PageSettingsIntuition2.qml /opt/victronenergy/gui/qml

# Links to modifications to Victron files
cd /opt/victronenergy/gui/qml
rm _*.qml
mv main.qml _main.qml
mv MbEditBox.qml _MbEditBox.qml
mv MbTextBlockSmall.qml _MbTextBlockSmall.qml
mv PageSettings.qml _PageSettings.qml
ln -s /data/etc/intuition/qml/main.qml /opt/victronenergy/gui/qml
ln -s /data/etc/intuition/qml/MbEditBox.qml /opt/victronenergy/gui/qml
ln -s /data/etc/intuition/qml/MbTextBlockSmall.qml /opt/victronenergy/gui/qml
ln -s /data/etc/intuition/qml/PageSettings.qml /opt/victronenergy/gui/qml
To minimize the extent of customizations, my modifications to MbEditBox.qml and MbTextBlockSmall.qml are not included. These were just modified to set a smaller font used by the settings. These aren't really needed, unless using the IntuitionSettings pages.
5. All the dbus entries are added through the dbus AddSettings command. Sample for one graph (intuition-dbus-values1.txt) and all 10 graphs (intuition-dbus-values.txt) is included. An example,
dbus -y com.victronenergy.settings /Settings AddSettings '%[ { "path":"/Intuition/Graphs/0/Width","default":""}]'
dbus -y com.victronenergy.settings /Settings AddSettings '%[ { "path":"/Intuition/Graphs/0/BorderColor","default":""}]'
dbus -y com.victronenergy.settings /Settings AddSettings '%[ { "path":"/Intuition/Graphs/0/BodyColor","default":""}]'
dbus -y com.victronenergy.settings /Settings AddSettings '%[ { "path":"/Intuition/Graphs/0/BackgroundColor","default":""}]'
dbus -y com.victronenergy.settings /Settings AddSettings '%[ { "path":"/Intuition/Graphs/0/Captions","default":"Barometer"}]'
dbus -y com.victronenergy.settings /Settings AddSettings '%[ { "path":"/Intuition/Graphs/0/CaptionsFontSize","default":"10"}]'
dbus -y com.victronenergy.settings /Settings AddSettings '%[ { "path":"/Intuition/Graphs/0/Decimals","default":""}]'
dbus -y com.victronenergy.settings /Settings AddSettings '%[ { "path":"/Intuition/Graphs/0/Height","default":""}]'
dbus -y com.victronenergy.settings /Settings AddSettings '%[ { "path":"/Intuition/Graphs/0/Instances","default":"/Pressure"}]'
dbus -y com.victronenergy.settings /Settings AddSettings '%[ { "path":"/Intuition/Graphs/0/Interval","default":""}]'
dbus -y com.victronenergy.settings /Settings AddSettings '%[ { "path":"/Intuition/Graphs/0/LineColors","default":"#0e2a53"}]'
dbus -y com.victronenergy.settings /Settings AddSettings '%[ { "path":"/Intuition/Graphs/0/LineTypes","default":""}]'
dbus -y com.victronenergy.settings /Settings AddSettings '%[ { "path":"/Intuition/Graphs/0/ServiceMappings","default":"temperature_22"}]'
dbus -y com.victronenergy.settings /Settings AddSettings '%[ { "path":"/Intuition/Graphs/0/Services","default":"temperature.ruuvi_f3b48d779c54"}]'
dbus -y com.victronenergy.settings /Settings AddSettings '%[ { "path":"/Intuition/Graphs/0/Type","default":"0"}]'
dbus -y com.victronenergy.settings /Settings AddSettings '%[ { "path":"/Intuition/Graphs/0/YMax","default":""}]'
dbus -y com.victronenergy.settings /Settings AddSettings '%[ { "path":"/Intuition/Graphs/0/YMin","default":""}]'
All the settings for the 10 graphs should be added to dbus. Checks for is valid and defaults are used, so you might be able to simply define dbus entries for caption, service, service mapping and instance. I'm not sure how the settings pages will work if dbus values are not defined.
6. It would wonderful if Victron would incorporate this into base Venus OS code! This would be useful for folks with dedicted displays without HTML5 or chartplotter support:)
I've found the combined page to be all that's need to monitor 'Intuition's'' onboarrd systems. The graph display is stable and seems to work very well. I'm pleased with how this evolved. I'm interested in everyone's comments.
Don