question

endurance avatar image
endurance asked

VRM PV Yield strange curve

2024-07-09-13h34-18.png

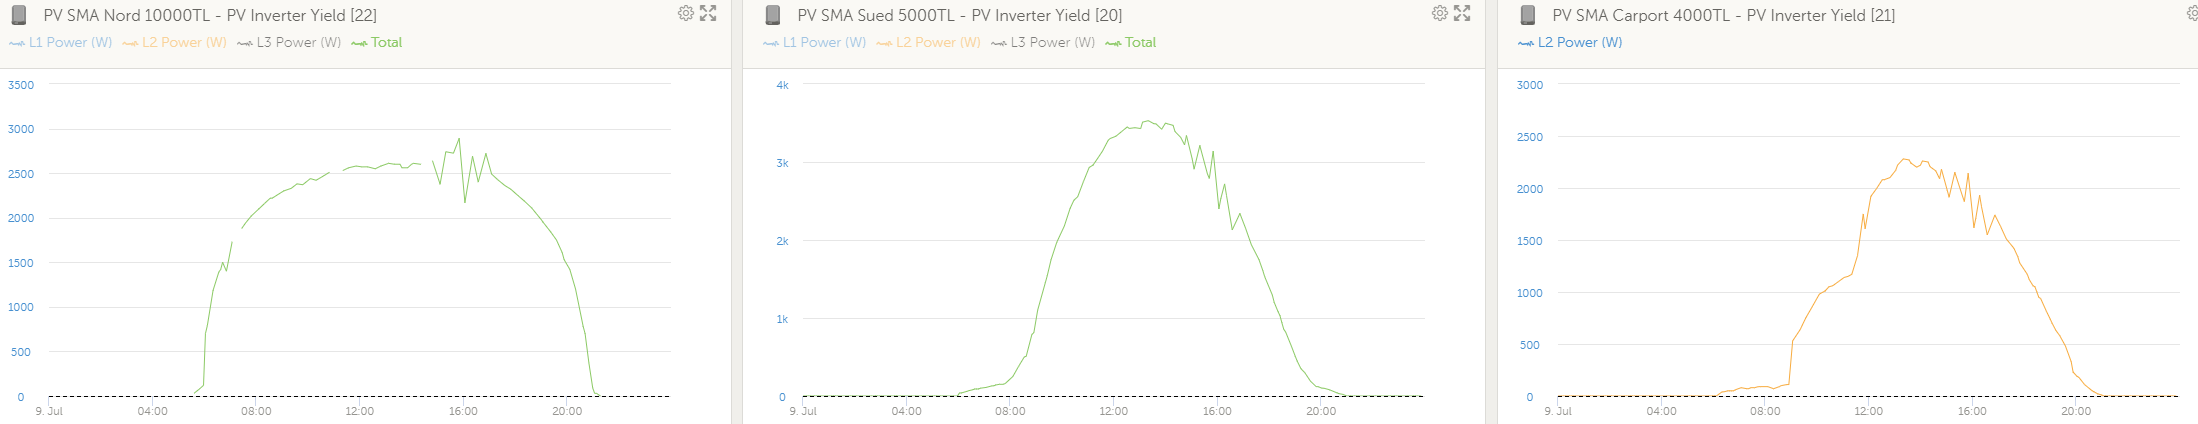
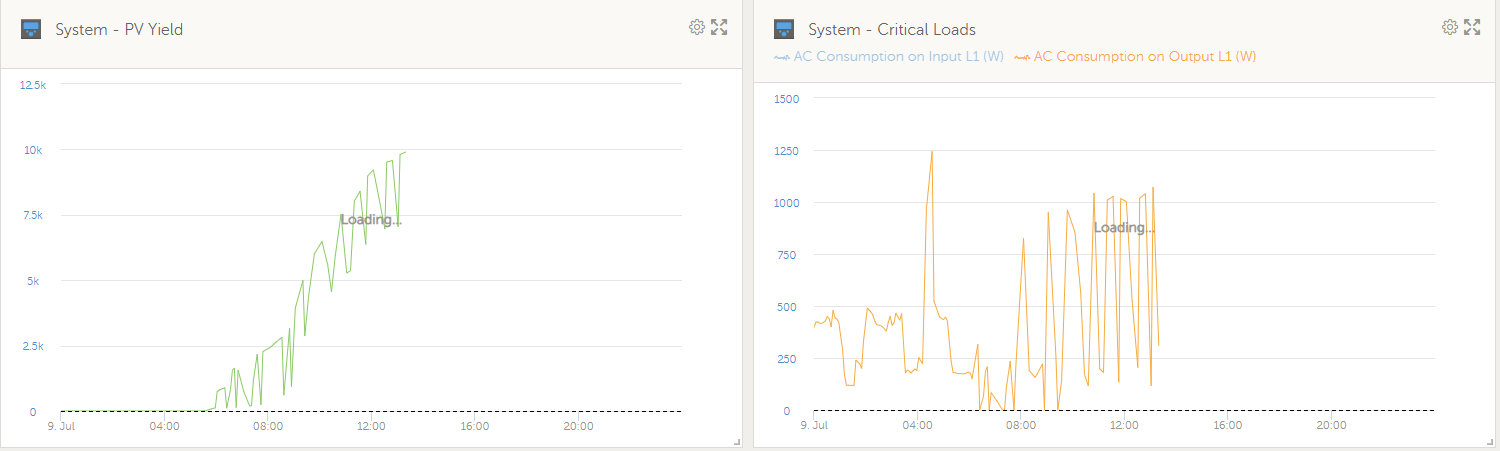
The PV yield curve looks strange since I moved PV inverters from AC In to AC out. Peaks and lows are from timing perspective at the same time as critical load peaks.
But I also do not understand the CL graph (why only L1 - I have 3p system) and the values are not really fitting to what I see in the graph output power.
any idea? looks like a SW bug.

pv yield
2 comments
2 |3000

Up to 8 attachments (including images) can be used with a maximum of 190.8 MiB each and 286.6 MiB total.

Alexandra avatar image Alexandra ♦ commented ·
For three phase you have to either make a custom graph or load a graph for each phase.

Pv looks like it is tracking then re tracking. Are you feeding back or only feeding loads?

0 Likes 0 ·
endurance avatar image endurance Alexandra ♦ commented ·

The PV yield should be just a sum of all PV inverters (all phases). It was working fine having all Inverters on AC-In (3 phase). Only after moving to AC-Out the graph for PV yield went strange. All single PV Inverters are looking correct.

2024-07-11-09h19-32.png

2024-07-11-09h19-49.png

Critical load graph I never understood as no match to reality.

0 Likes 0 ·
0 Answers

Related Resources

Additional resources still need to be added for this topic