question

jochenku avatar image
jochenku asked

PV production forecast - significant reproducable offset

Hi there Victron staff!

I would like to bring a slight issue regarding pv production forecast on VRM to your attention.

As part of my morning routine ;-) I do a short VRM check and during the last weeks on about 50% of days the pv production forecast (FC) is initially way too low. Some time later (some days 10-15 min, other days 1-2 hours) the FC changes significantly, mostly it improves.

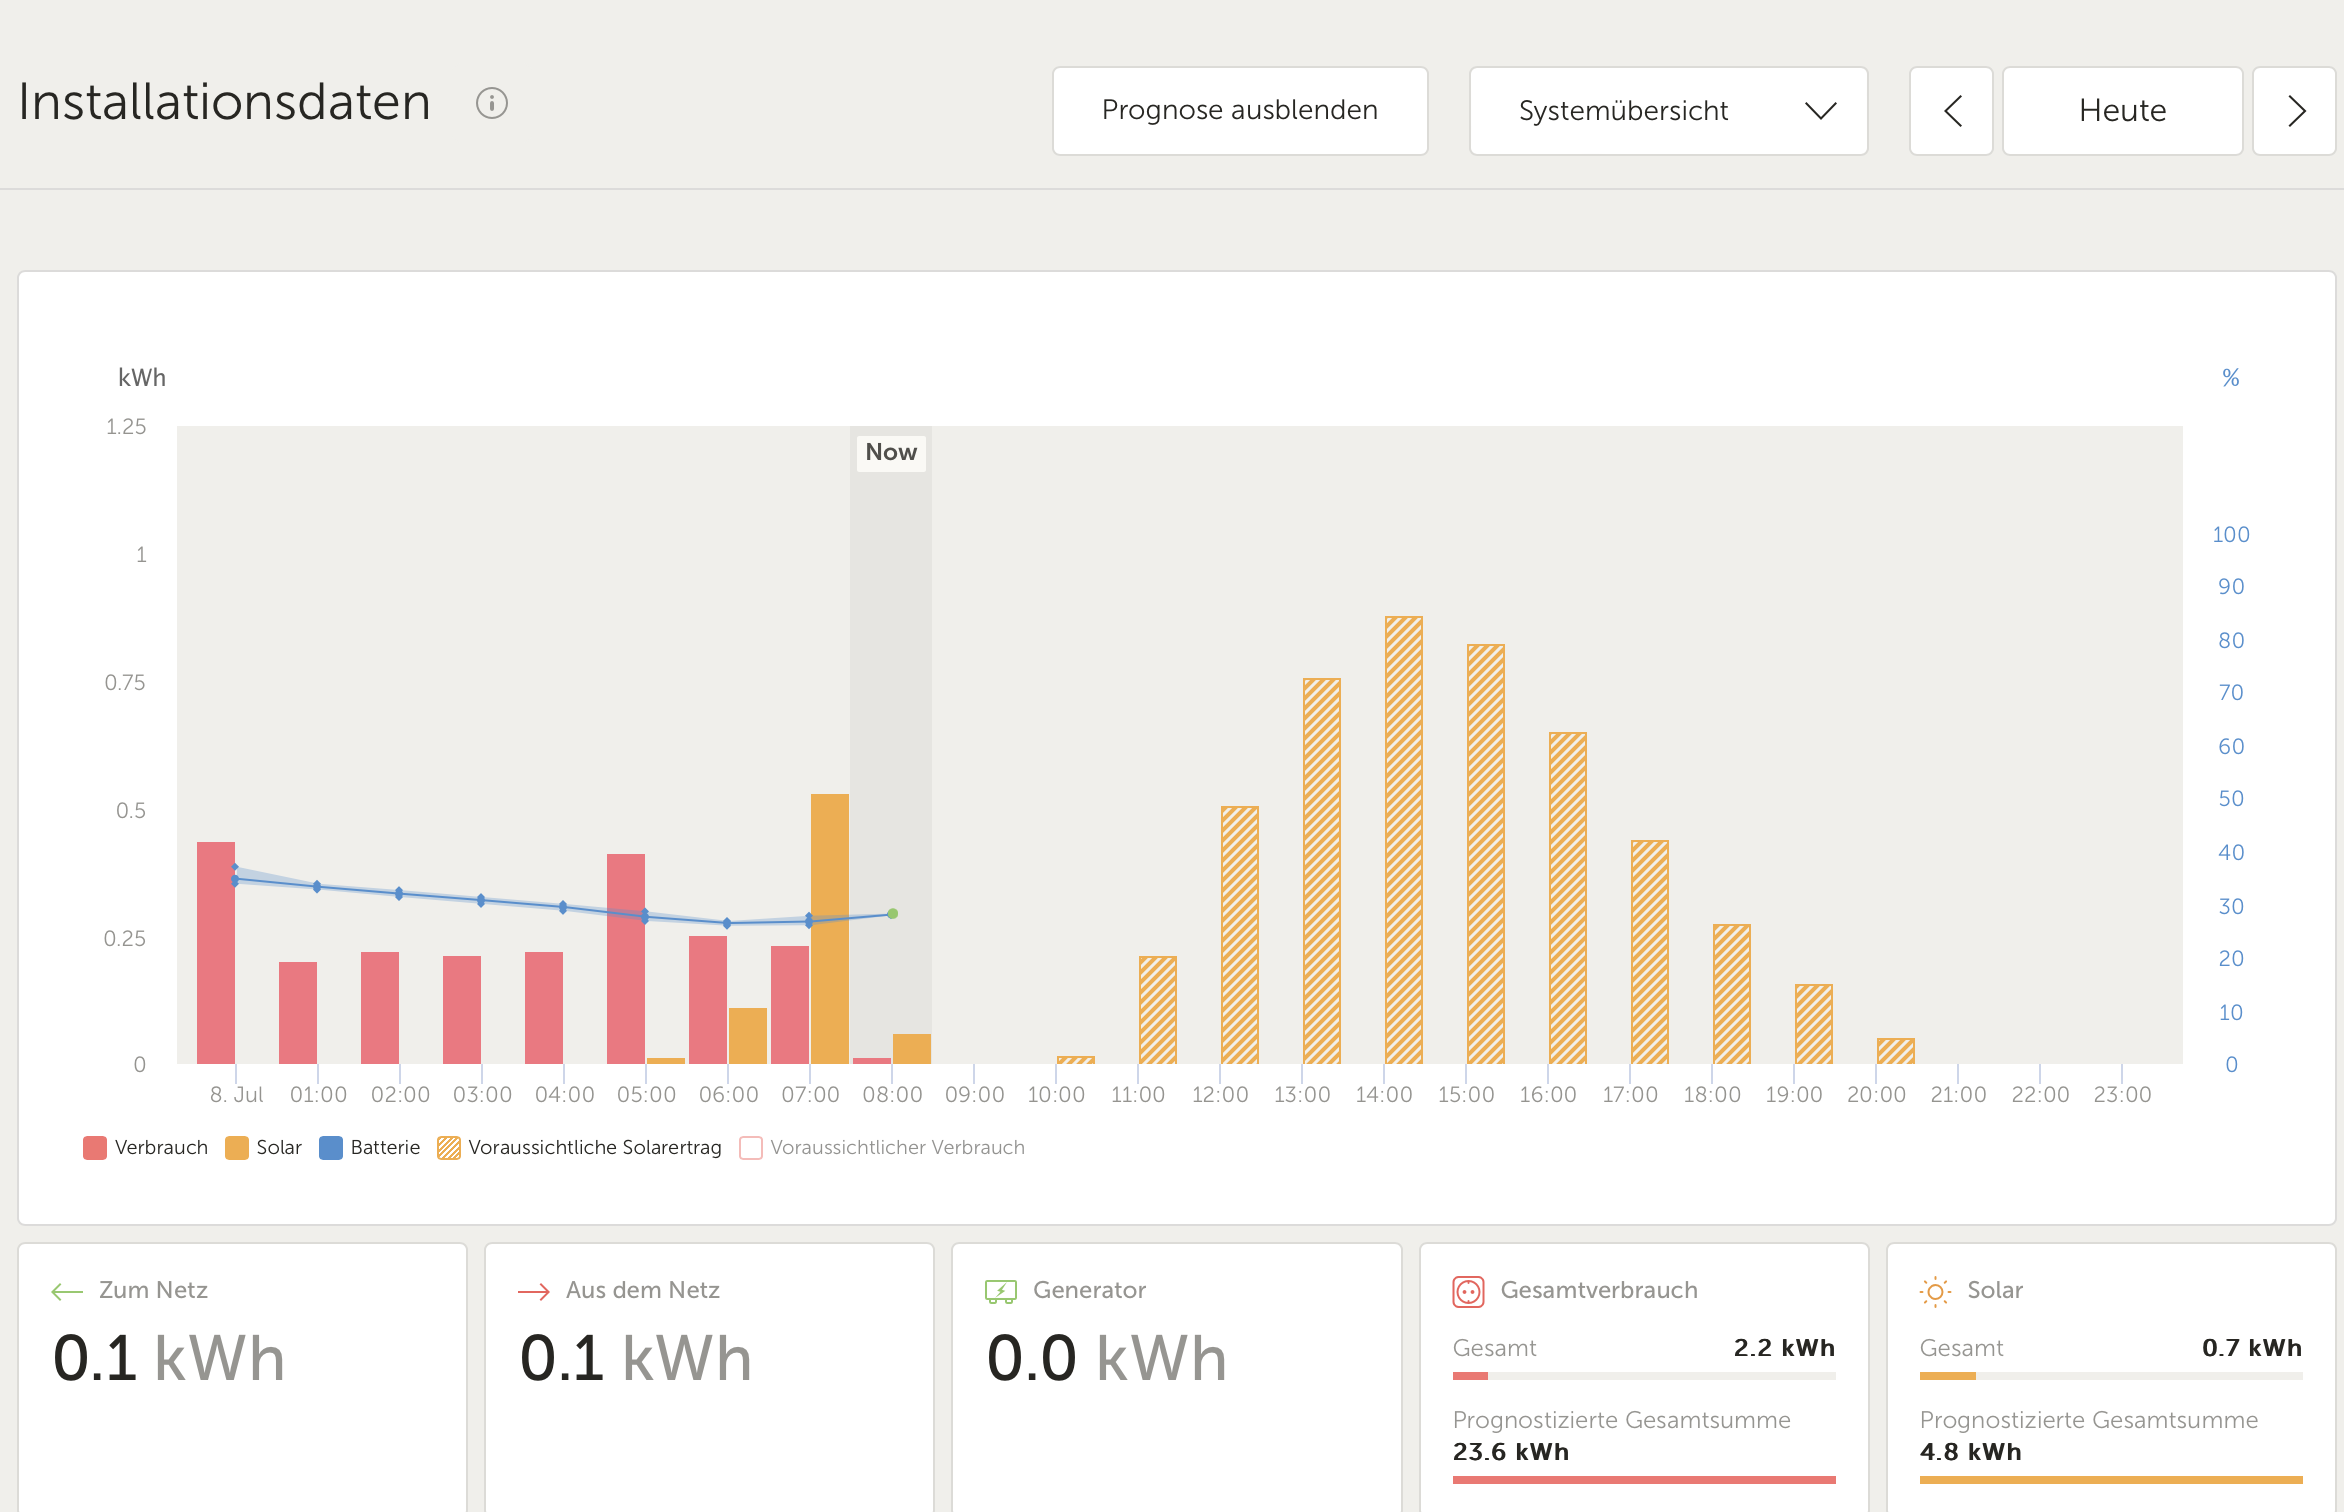
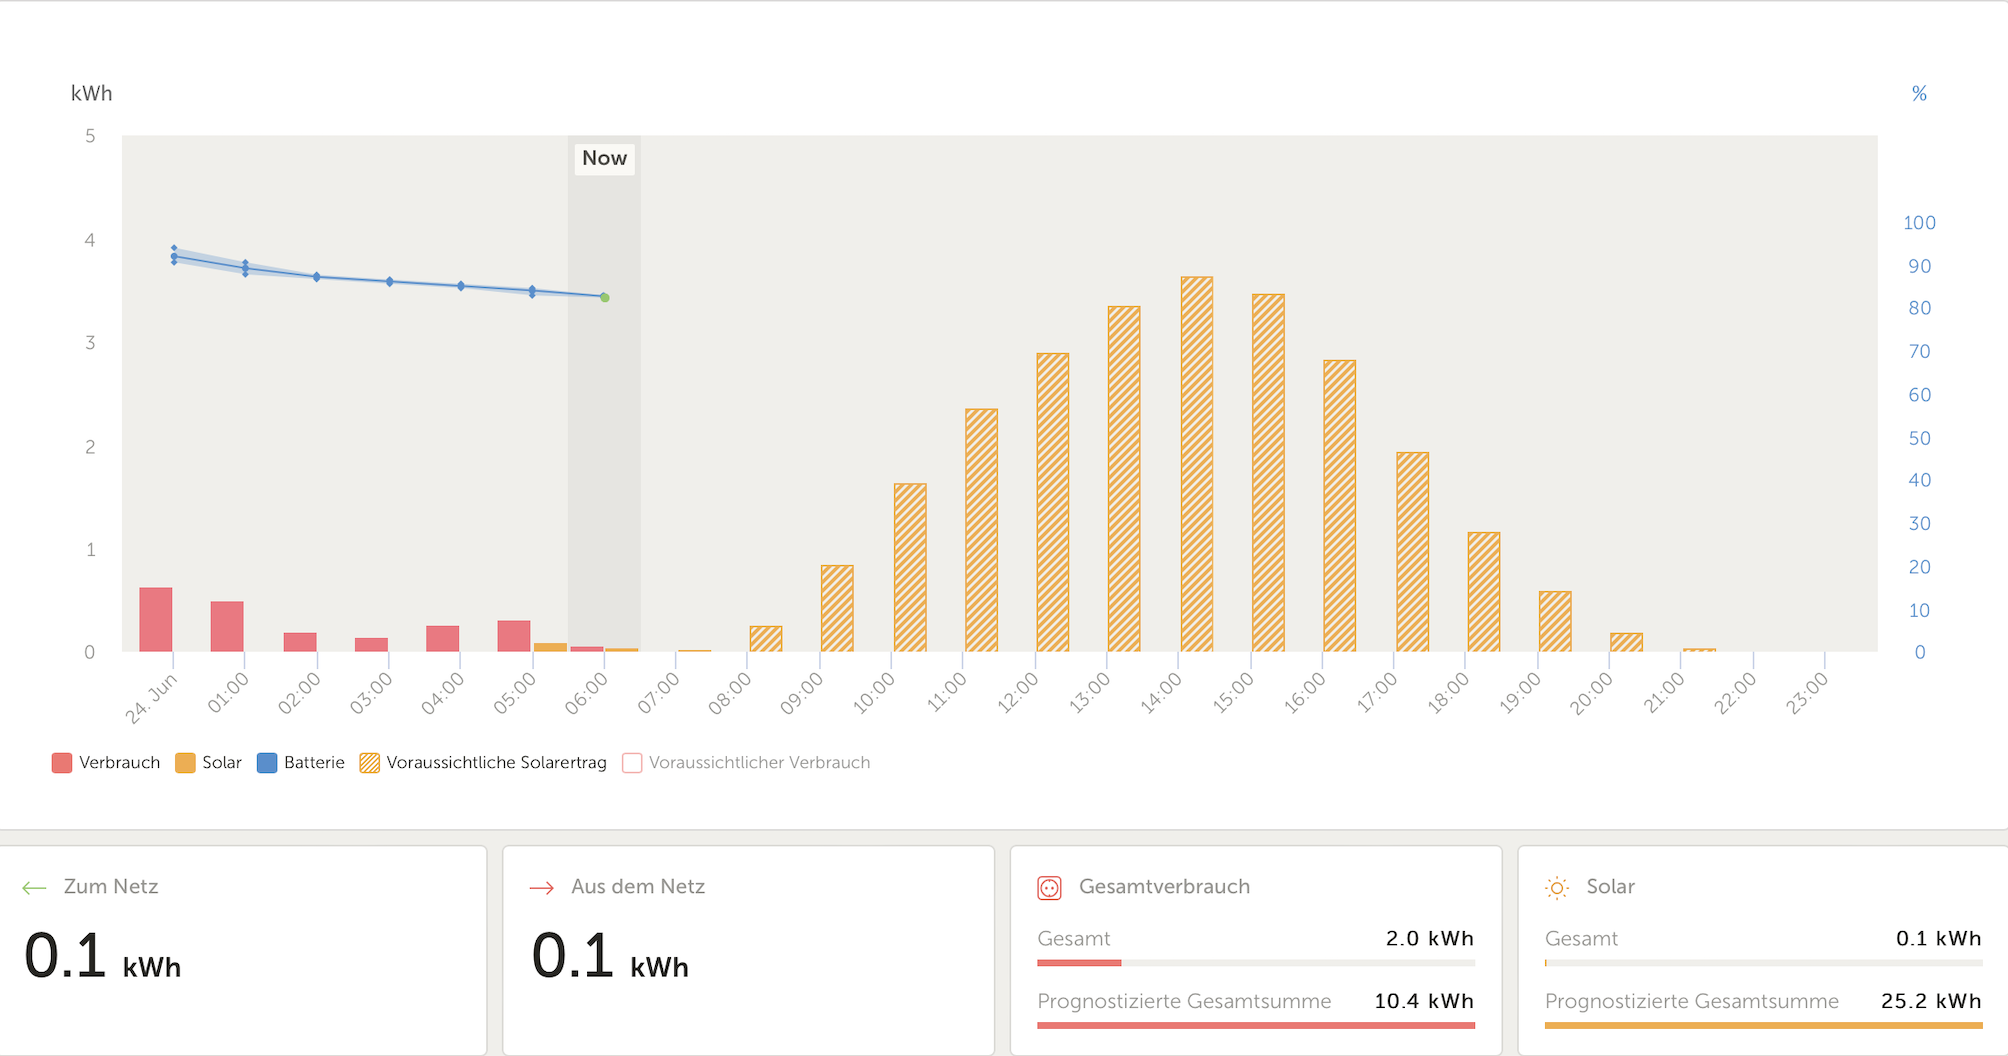
Below you find 4 scrrenshots of today. At 06:12 the FC was 25,2 kWh while at 06:41 it was 34,7 kWh. The interesting thing is, that the irradiance forecast remained basically unchanged between both points in time and thus does imho not support a change of yield by more than 37%.
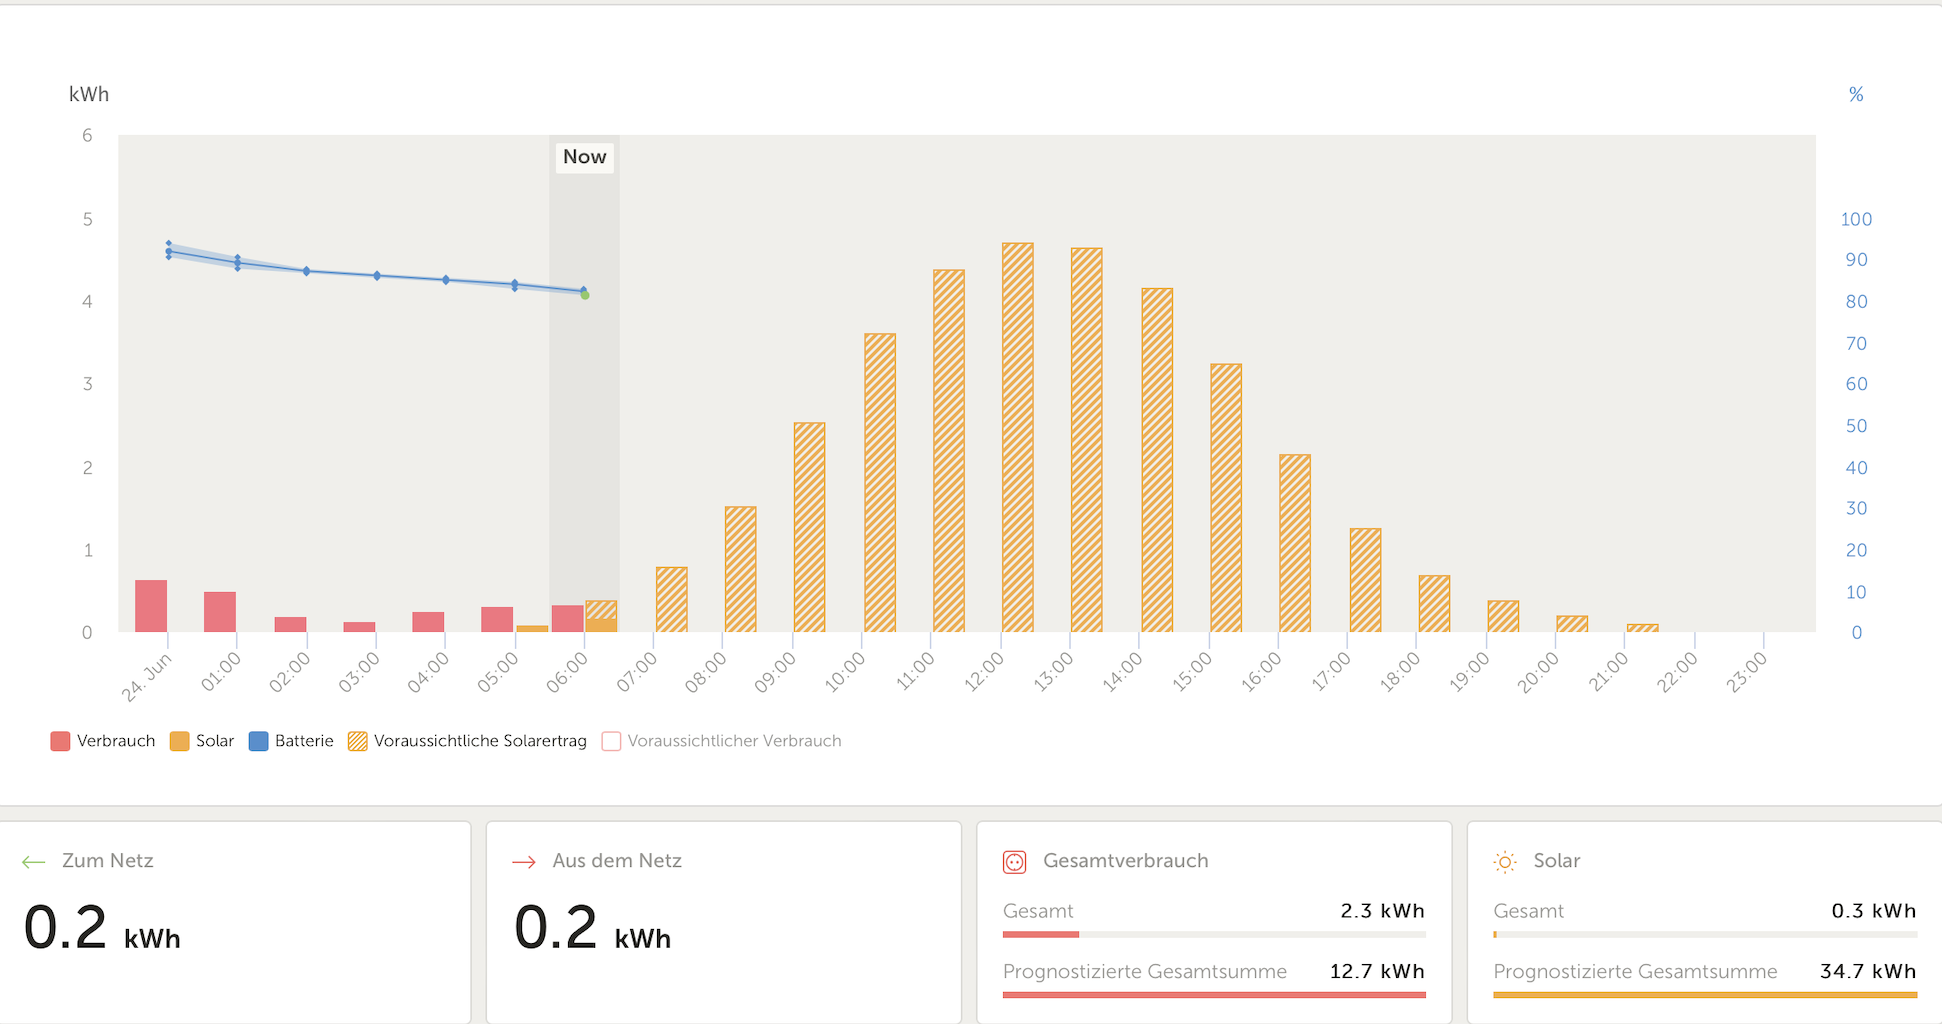
1719204473934.png

PV FC at 06:12


1719204515872.png

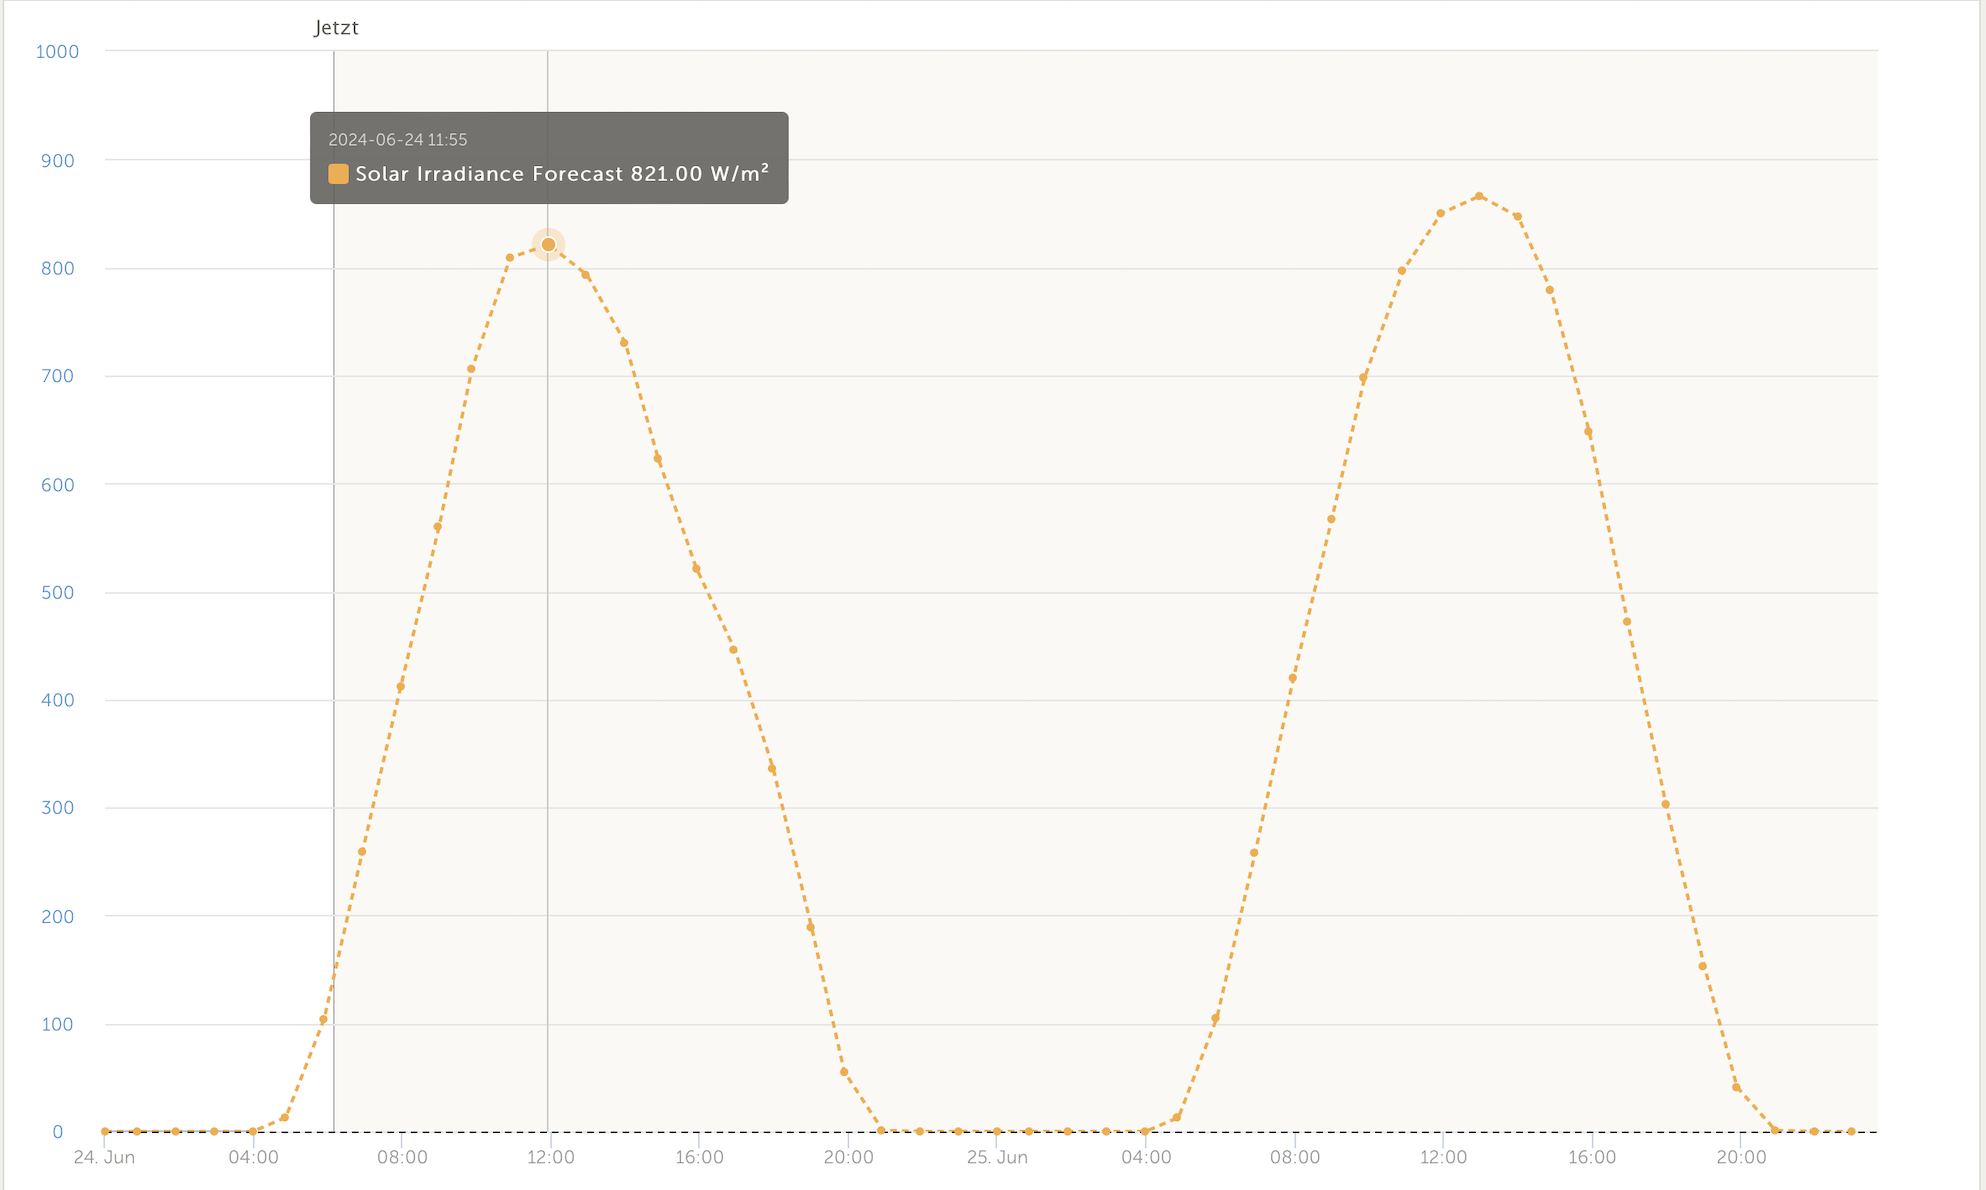
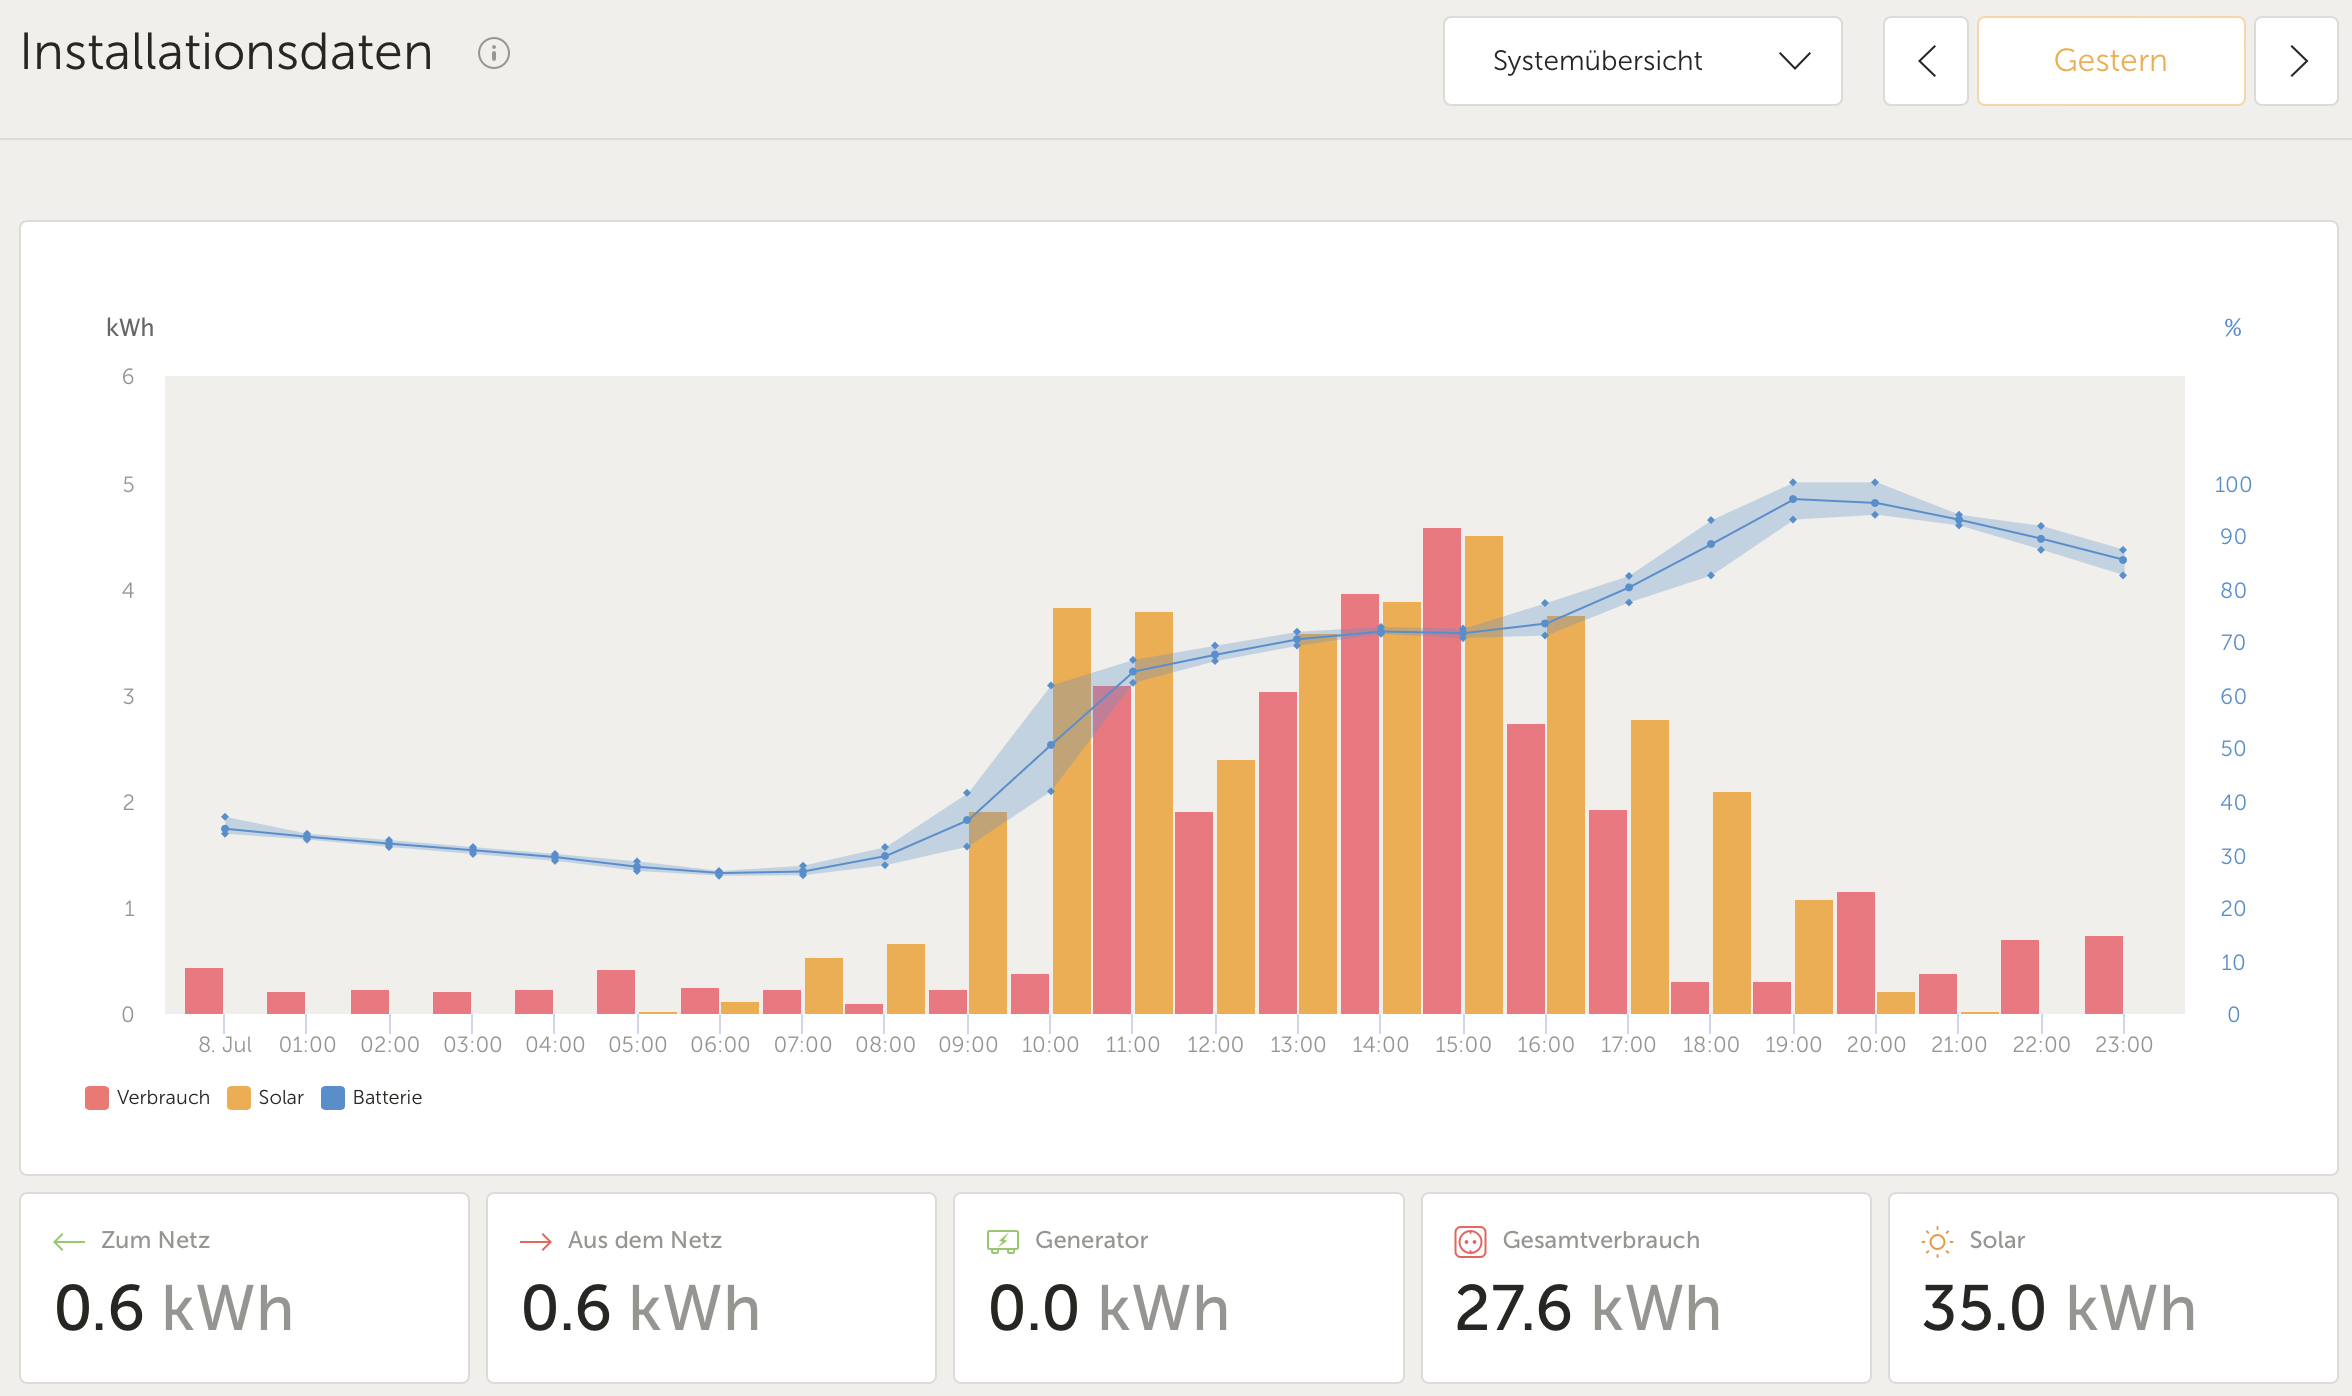
Irradiance FC at 06:12
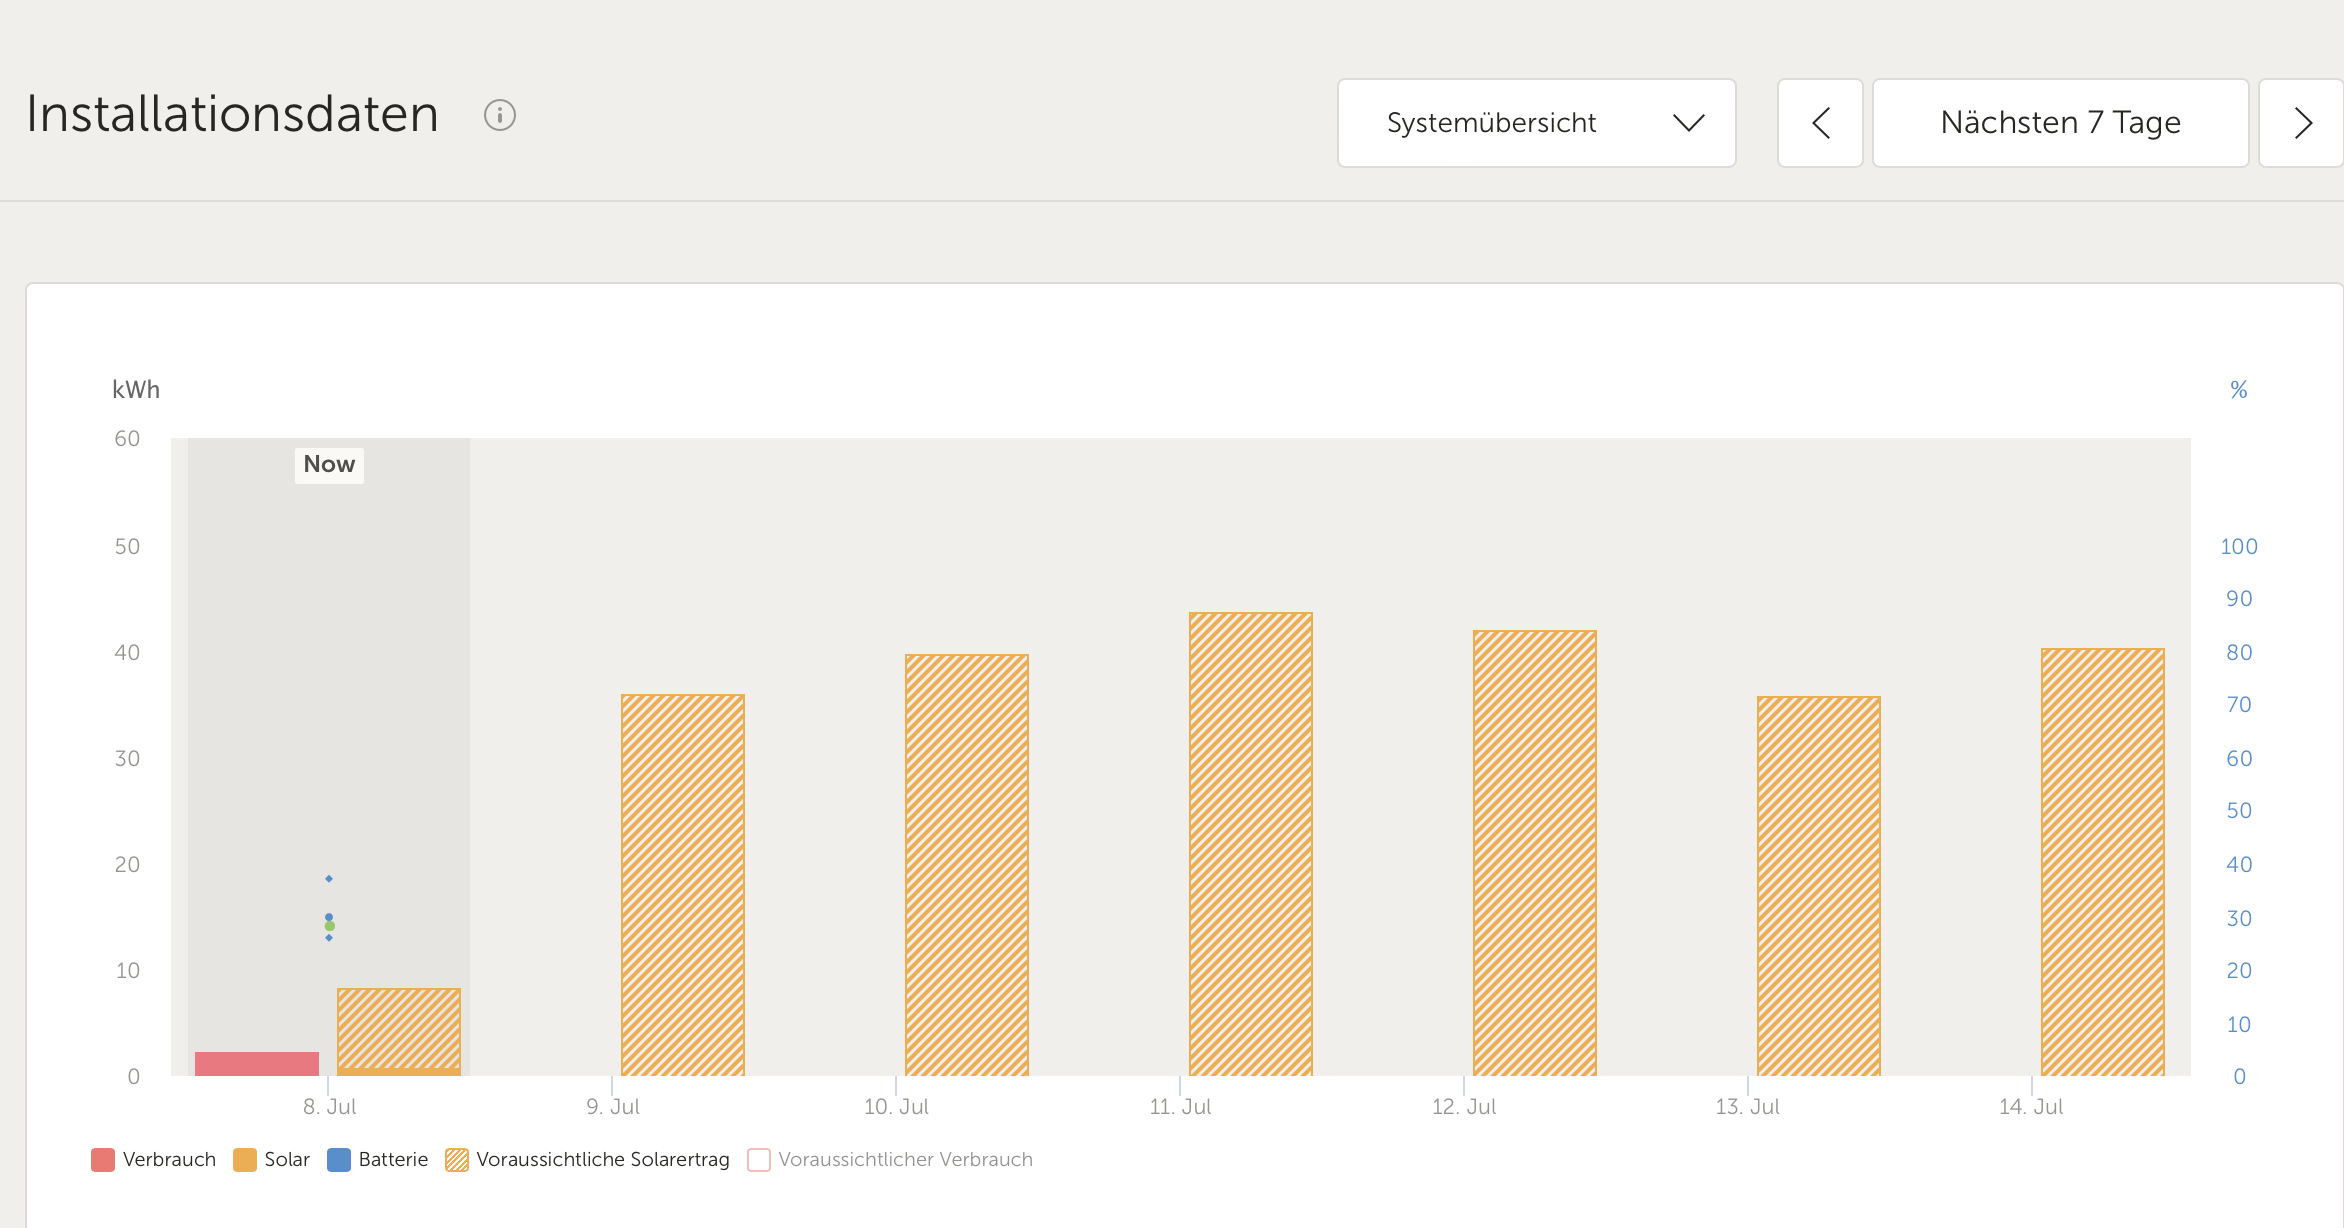

1719204545045.pngPV FC at 06:41


1719204571021.png

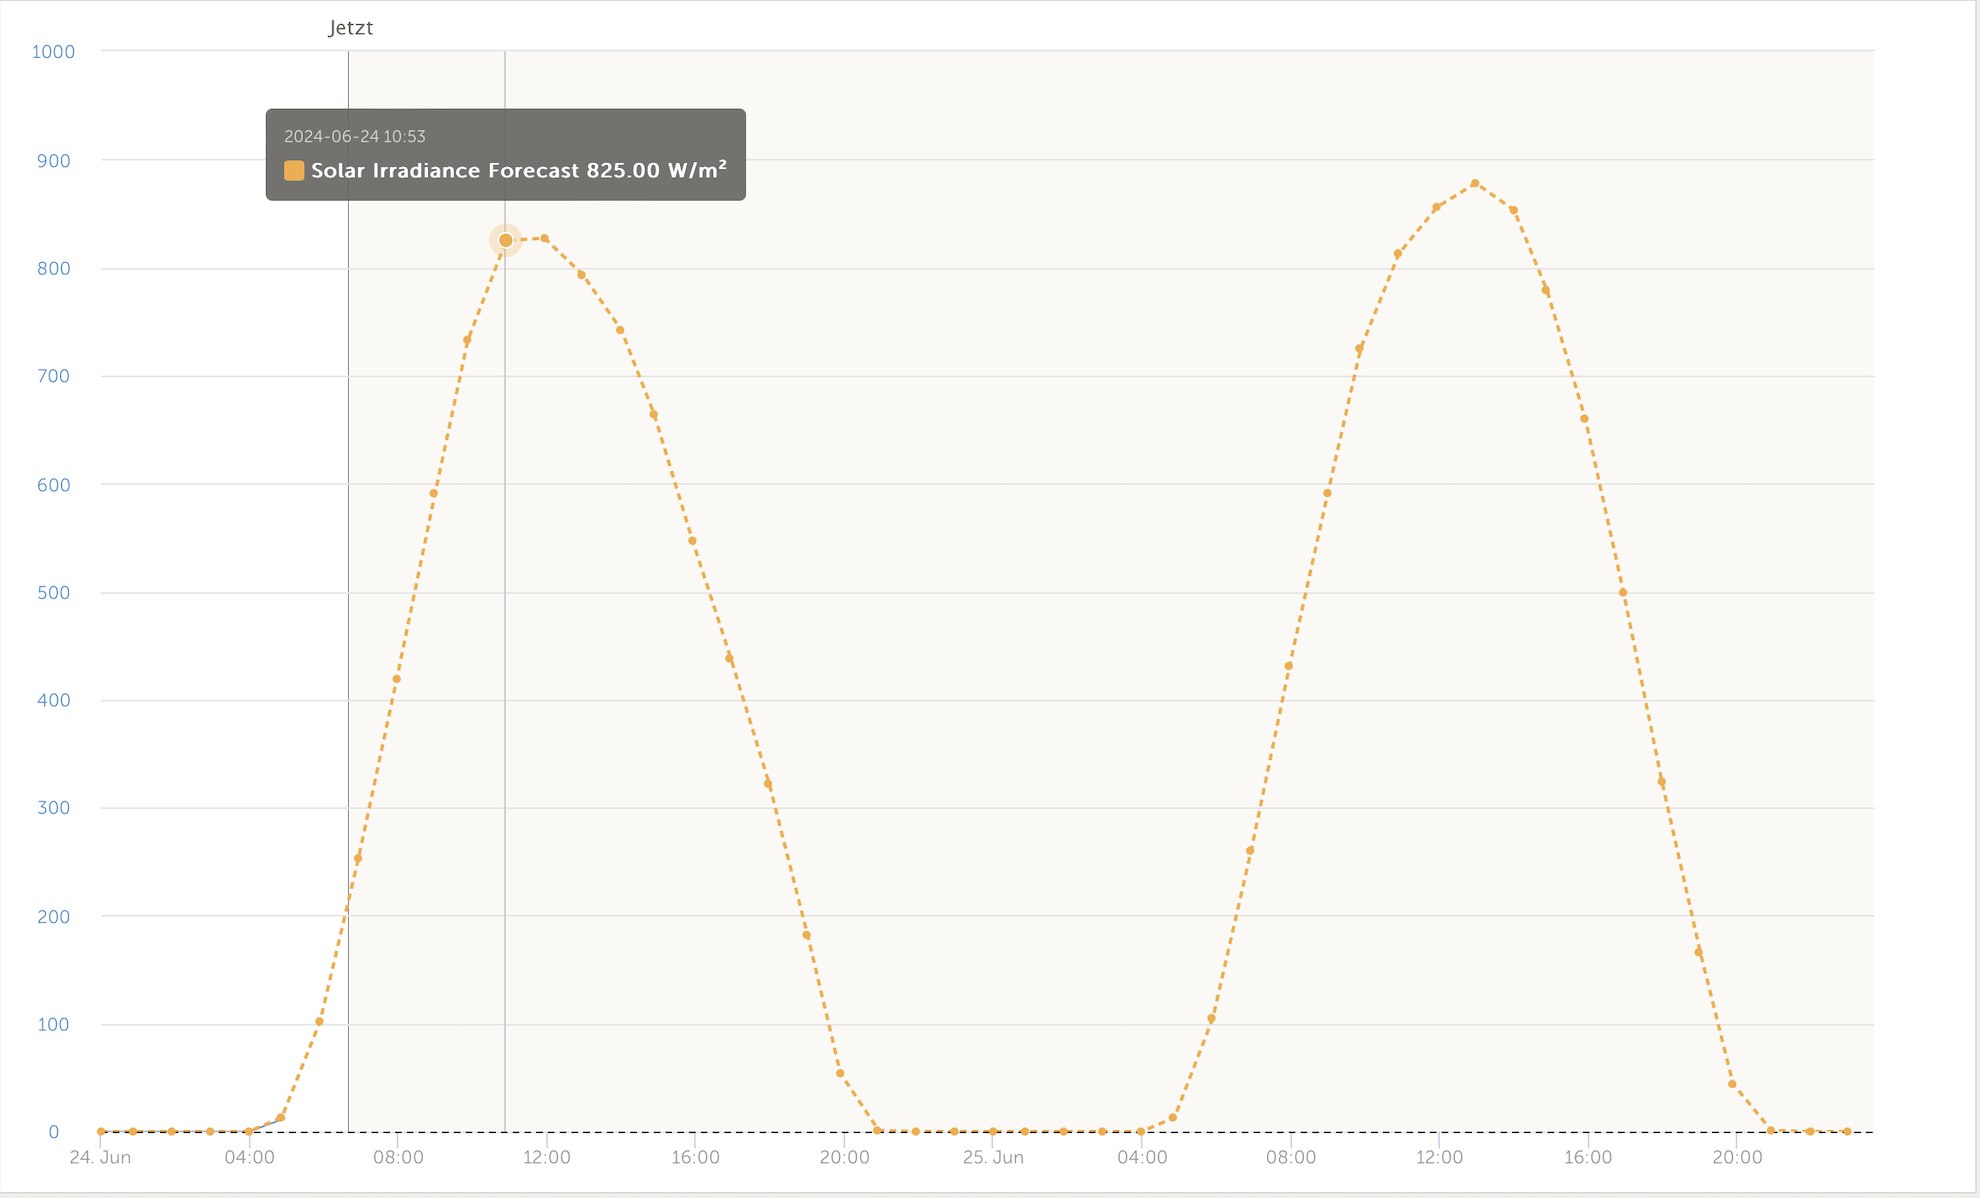
Irradiance FC at 06:41

As I use the FC for several important operations in NodeRed it is especially messy if the FC is way too conservative during the morning hours and too much energy is kept in the house battery only to find lateron that pv excess has to be fed to the grid.

As mentioned this behaviour is reproducable and sometimes it affects other installations in the direct proximity (1 road to the north, 3 roads to the south, urban environment) as well, but sometimes it does not!

Today only my installation is affected, the others look ok (1 road to the north: similar kWp installed 37,8 kWh forecasted constantly!).

Are you aware of this issue and do you have any ideas what causes it and how to avoid it?

Best regards, Jochen

ESSdynamic esssolar forecast
1719204473934.png (429.4 KiB)
1719204515872.png (269.2 KiB)
1719204545045.png (415.1 KiB)
1719204571021.png (261.8 KiB)
2 |3000

Up to 8 attachments (including images) can be used with a maximum of 190.8 MiB each and 286.6 MiB total.

2 Answers
Guy Stewart (Victron Community Manager) avatar image
Guy Stewart (Victron Community Manager) answered ·

Hi @JochenKu,

Thanks for the specific feedback, I'll pass it on to the VRM team.

Have you written more about how you're using Node RED? I'd be interested to learn what you're doing there as well.

3 comments
2 |3000

Up to 8 attachments (including images) can be used with a maximum of 190.8 MiB each and 286.6 MiB total.

jochenku avatar image jochenku commented ·

Hi @Guy Stewart (Victron Community Manager) ,

a quick update on a somewhat related issue...

On June, 29 the Cerbo GX in one of my installations died spontaneously. I replaced it with a spare GX-S unit the next day and on July, 1 with the (brand new) replacement GX sent by my dealer, as I need the temperature inputs the GX-S doesn't have. So far, so good.

However since the replacement, the PV forecast for the actual day is completely wrong, showing only 10-20% of the real expected production. Once again, the irradiance data is plausible, just the actual day's PV FC isn't.

Example for July, 8: While the forecast shows 4,8 kWh for today with a peak of 0.88 kW a 2 pm. a realistic fc for today would be appr. 30-40 kWh with a production peaking at 4-4.5 kWh (I will edit in the actual data in the evening). Note the discrepancy of actual power: at 7 am. the yield is already > 50% of the forecast peak power in the afternoon!

1720418837048.png

forecast for today


1720418713134.png

7 day forecast

I tried to change the location of the installation (suggested by one of your staff to 'clear' the history after a week of heavy snow last winter) but that did not change the fc for the actual day. Next day and on is completely ok, but instead of eg. 40 kWh forecasted today for next day it will show only 4-8 kWh when today turns into tomorrow.

How is the forecast related to the GX device used and any other helpful ideas? Again I can provide any required data to help troubleshoot...

Best regards, Jochen

0 Likes 0 ·
1720418713134.png (174.5 KiB)
1720418837048.png (247.7 KiB)
Unfortunately in this case I think the remedy is more time as the algorithm will self correct it.

The location change recommendation may be out of date now, I am not certain but I think there was more logic added to it, because it was getting triggered too often accidentally by minor movements.

1 Like 1 ·
jochenku avatar image jochenku jochenku commented ·

As promised here's the actual PV yield at the end of the day: 35,0 kWh compared to the forecast of 4,8 kWh...1720498723833.png

0 Likes 0 ·
1720498723833.png (223.4 KiB)
jochenku avatar image
jochenku answered ·

Hi Guy,

thanks for the quick reply. Interested on any feedback and available for further details if needed (eg. VRM portal ID etc.).

Regarding your question [sorry, no short answer possible ;-)]...

As I need to charge my EV during different times of the week / day the consumption forecast in VRM is not helpful for my situation and makes the Victron D-ESS not useable for me, as the consumption forecast is wrong too often. So I tried to program my own poor-man's dynamic ESS in NodeRed. Since February 2024 I am a Tibber customer and since then there is a much more interesting use case to manage energy consumption versus time of day/night.

In order to manage energy in an optimum way I first established a daily consumption value (broken down to 24 hours and different between working days vs. weekends.). Depending on the forecast yield for the next day I calculate a target SOC to be reached on the present day at end of solar production (defined by hourly solar yield below threshold), eg. I want to be the battery at 75% SOC at 6 pm, because the forecast for the next day is between X and Y kWh.

Additionally during the day I monitor actual vs. forecast solar production in order to calculate the forecast's accuracy. This co-efficient is used to re-set several other values depending on the remaining solar yield. This gives me an 'estimated SOC' that would be reached using my own daily energy consumption model and the corrected forecast yield. If my est. SOC is 115% then I can calculate the 'solar excess' (40% of my battery capacity in this case).

If solar excess is availabe it is either stored in the drinking water reservoir or the EV is charged in order to reduce / avoid grid feed-in in favour of self-consumption (due to 'great' german feed-in prices of 10 ct/kWh)...

If no surplus energy is available for the EV or the EV has to be charged during the night, I control how much (if any) battery power may be used during nightly EV charges (by control of the inverter power down close to zero).

I also use NodeRed to:

  • Set the lowest acceptable SOC during the night (in order to have backup power available, again depending on the solar forecast of the next day)
  • To keep my batteries (located in an unheated garage) above 5°C in winter (depending on outside temperature and expected solar yield) by performing an 30-60 minute charging cycle with max charging power.

On my to-do-List (or in beta test) is:

  • Management of inverter power according to energy price if solar production is insufficient.

    The difference between my maximum and minimum energy price has not been sufficient to allow battery charging from the grid alone given the 'douple losses' (into and out of the battery). But what works in many cases (eg. solar production insufficient, but cheap prices during some hours of the day) is to use grid power when it is cheap and save or even mildly charge the battery by solar to use when energy is expensive in the evening.

    Compared to charging the battery from the grid I avoid mostly the ~ 20% losses caused by storing grid power in the battery for later use.

That's basically it. I 'manage' 3 installations that are pretty similar (3x MPII 3000/5000, 8-10 kWp, 15-20 kHw battery, EVCS, immersion water heater) using similar versions of the a.m. NodeRed flows...

Best regards, Jochen


2 |3000

Up to 8 attachments (including images) can be used with a maximum of 190.8 MiB each and 286.6 MiB total.