question

andysprinter avatar image
andysprinter asked

MPPT history anomaly

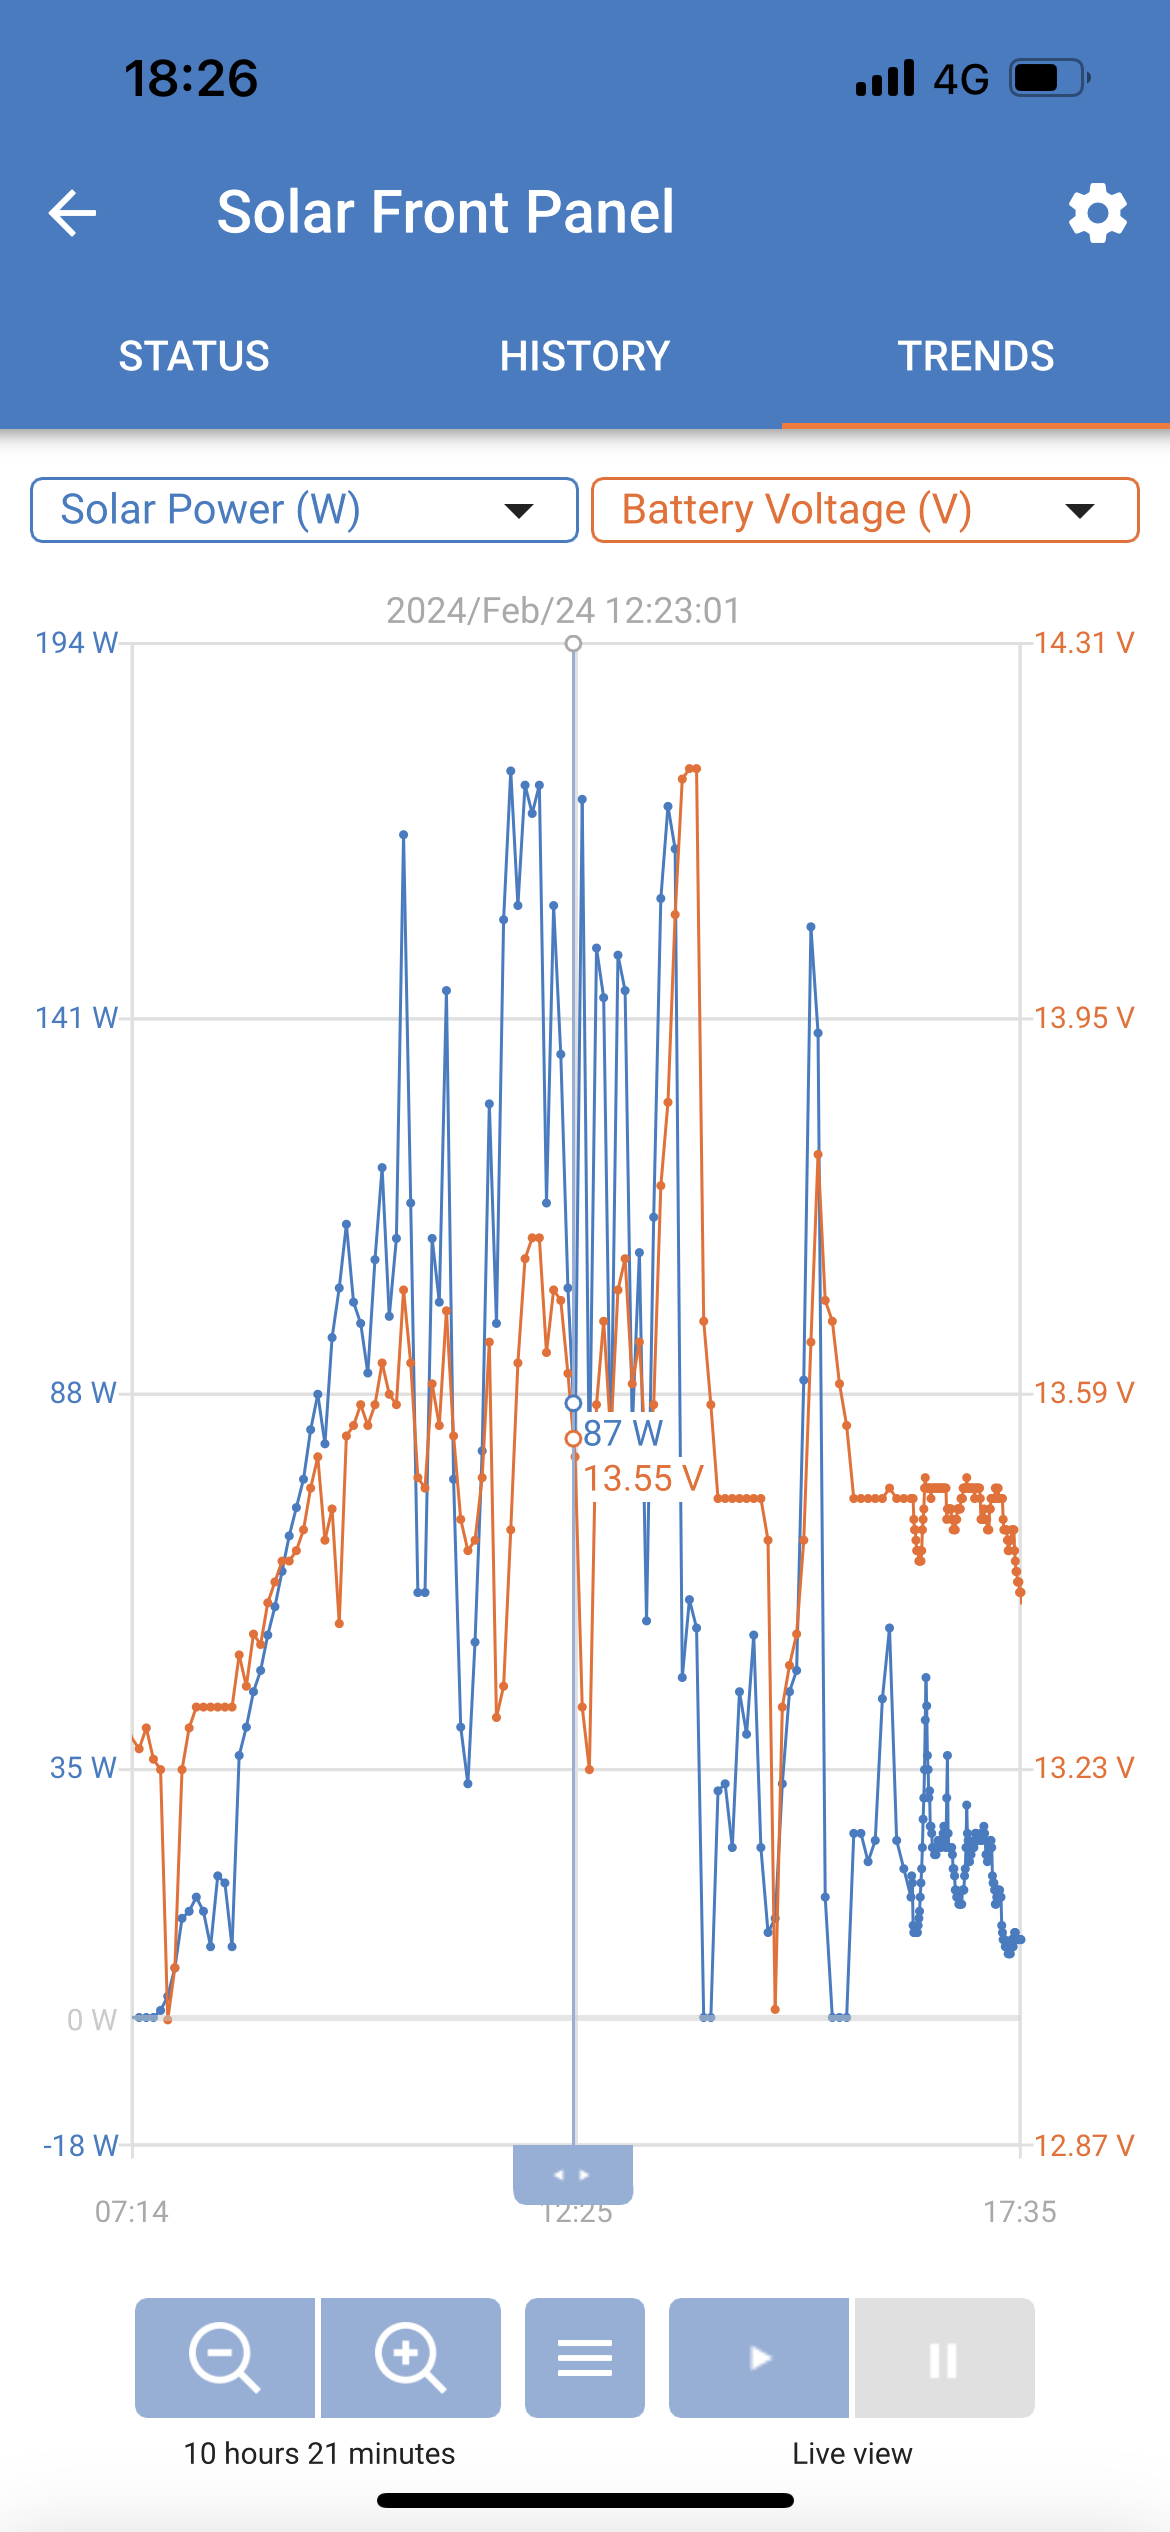
MPPT 100/30. When I look at the history for a particular day it shows a peak power of 241w but on the trend graph it only shows 174w. Which one is correct?

MPPT SmartSolar
3 comments
2 |3000

Up to 8 attachments (including images) can be used with a maximum of 190.8 MiB each and 286.6 MiB total.

Alexandra avatar image Alexandra ♦ commented ·
@Andysprinter

Screen shots might help

0 Likes 0 ·
andysprinter avatar image andysprinter Alexandra ♦ commented ·

Thanks Alexandra. The output is from a 300w panelimg-2796.png300w panelimg-2797.jpeg

0 Likes 0 ·
img-2797.jpeg (677.0 KiB)
img-2796.png (545.0 KiB)
Alexandra avatar image Alexandra ♦ andysprinter commented ·

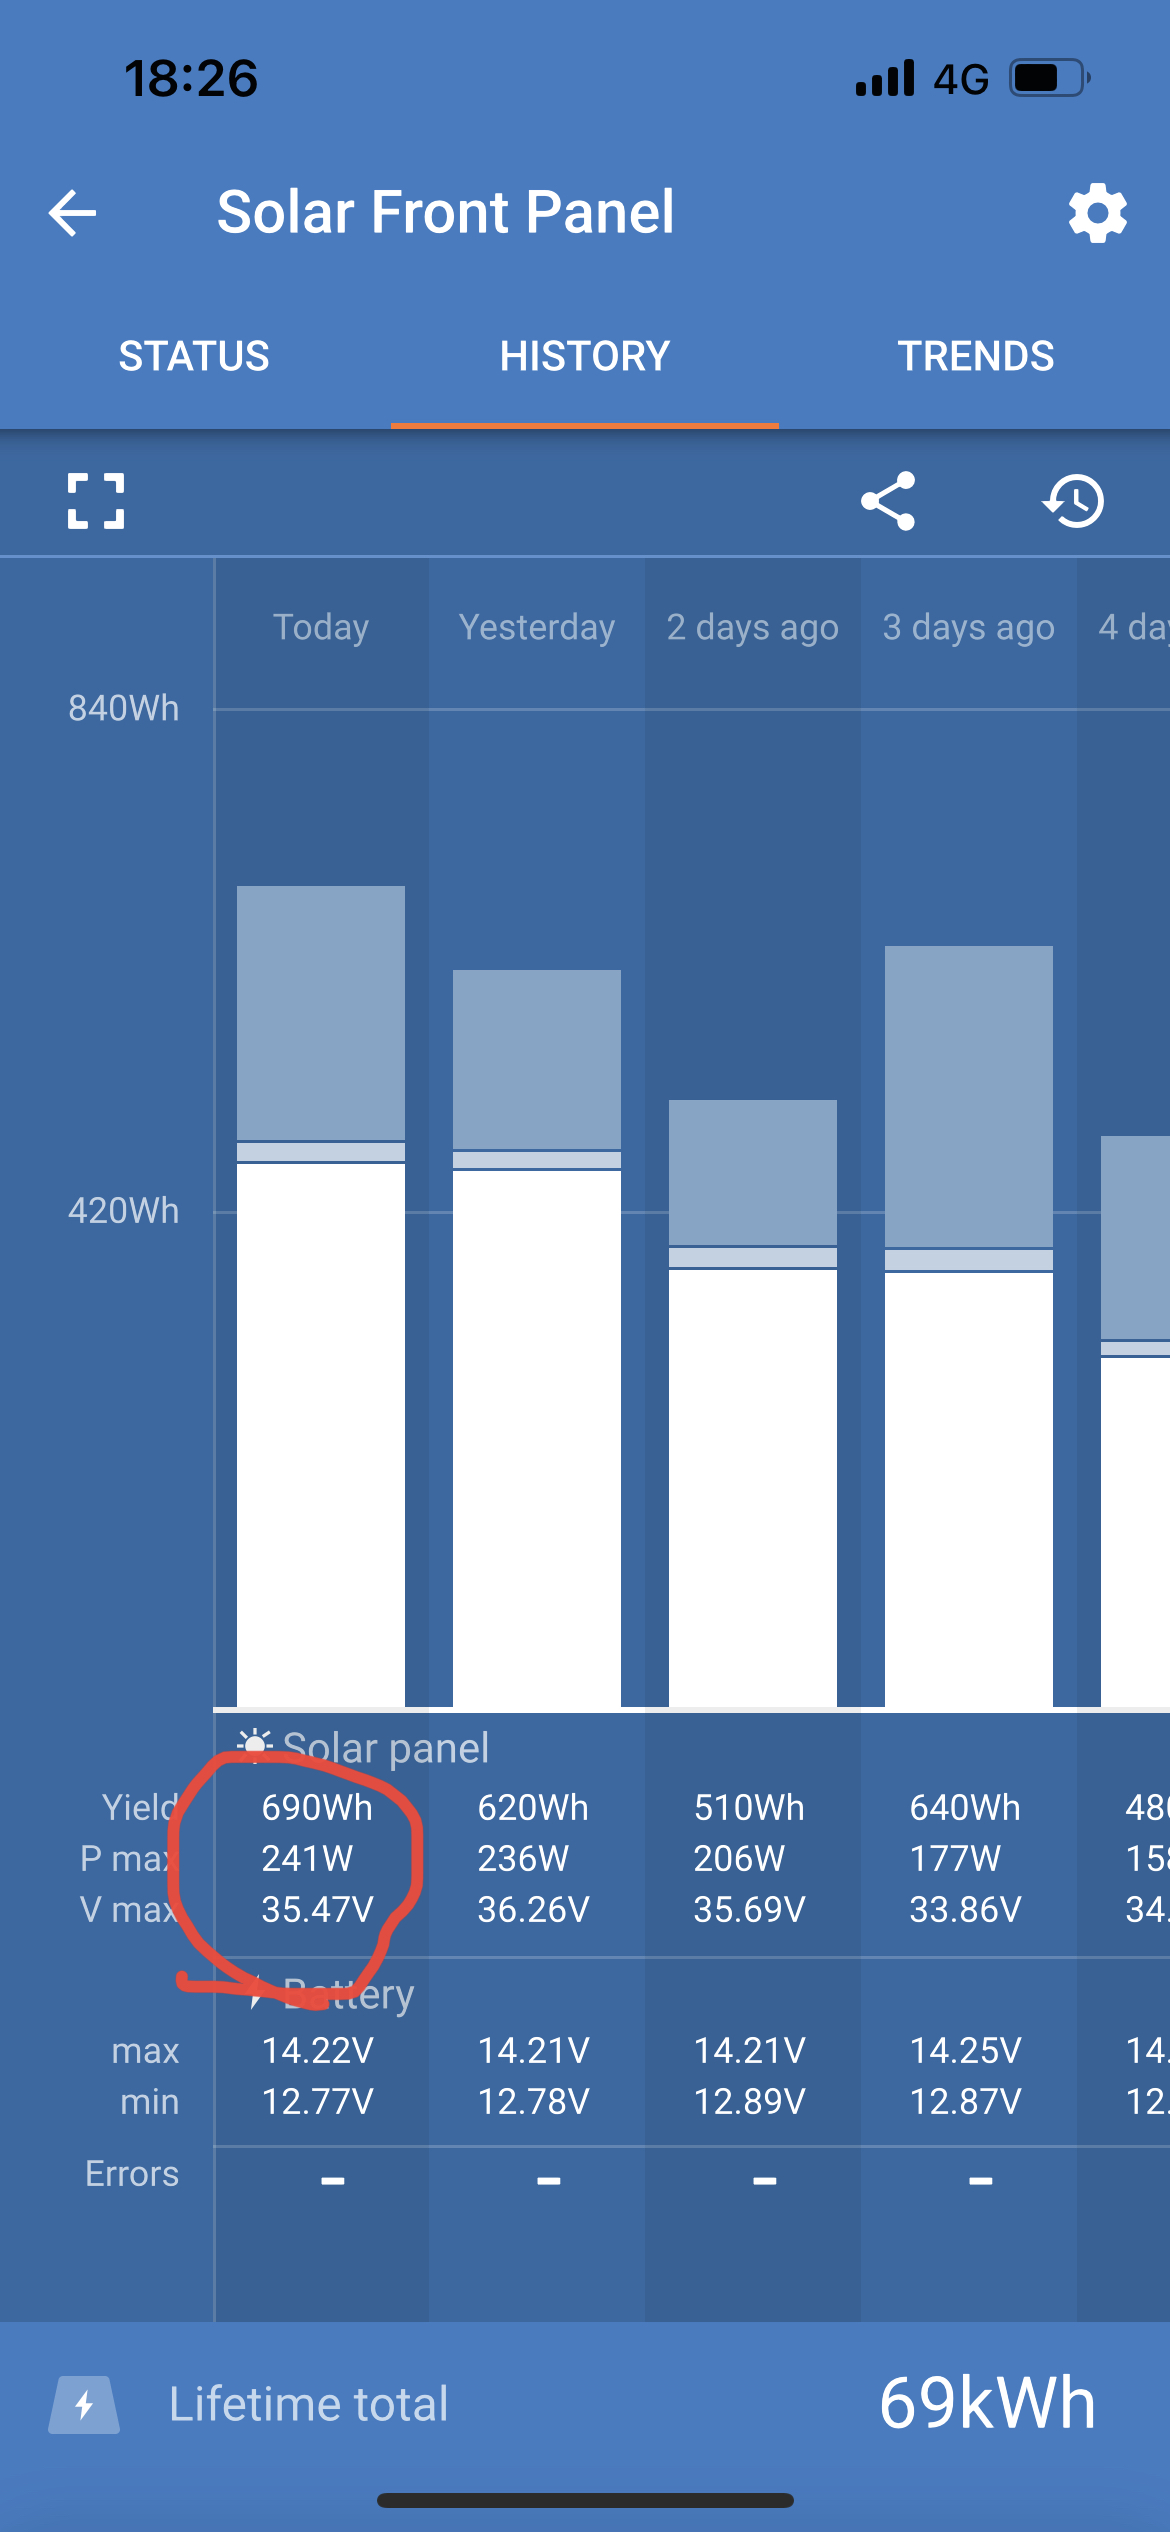
I am inclined to go with Nickdb answer (as you were) about data points.

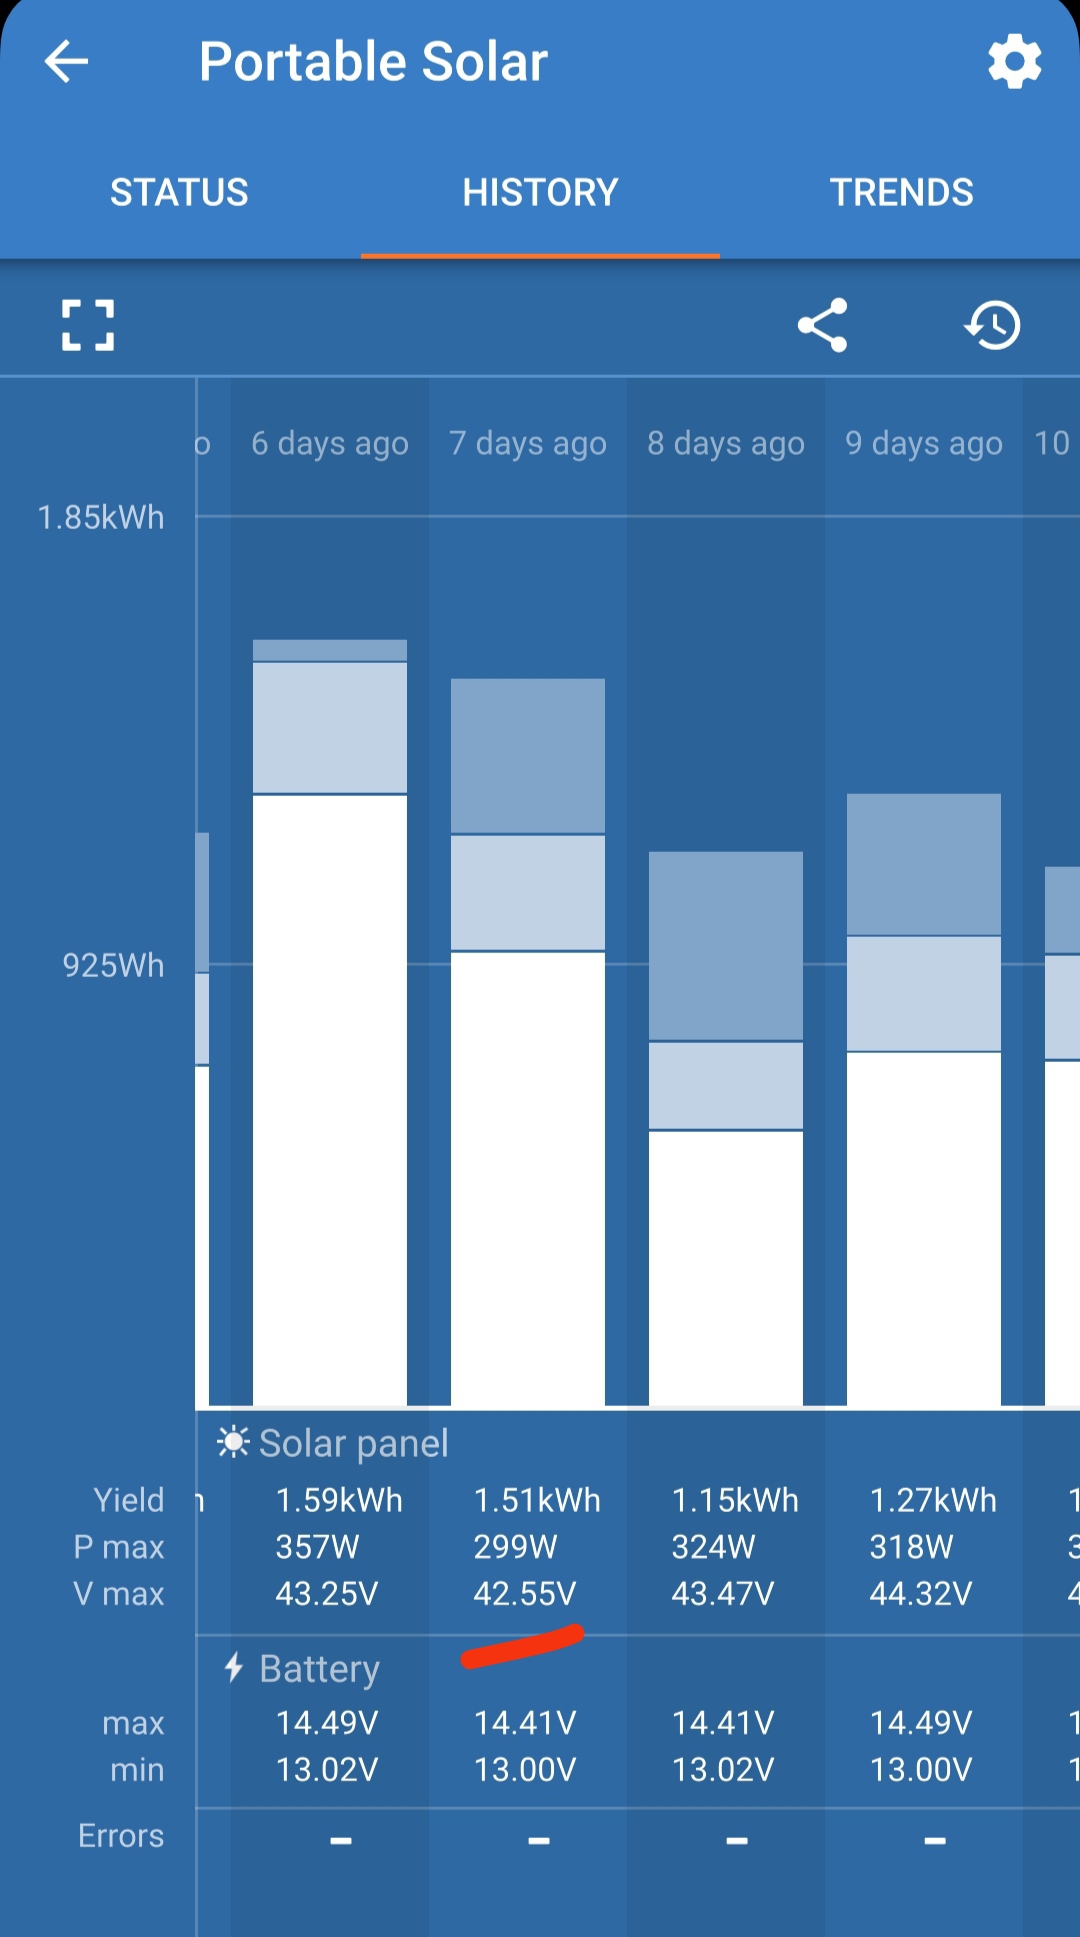
I have a 100/30 with 360W panel. Was looking through the trends data and the history.

Sometimes I have a 10W difference sometimes 100w difference in the trends vs the peak recorded.

1000026356.jpg

1000026354.jpg

0 Likes 0 ·
1000026356.jpg (228.8 KiB)
1000026354.jpg (218.9 KiB)
1 Answer
nickdb avatar image
nickdb answered ·

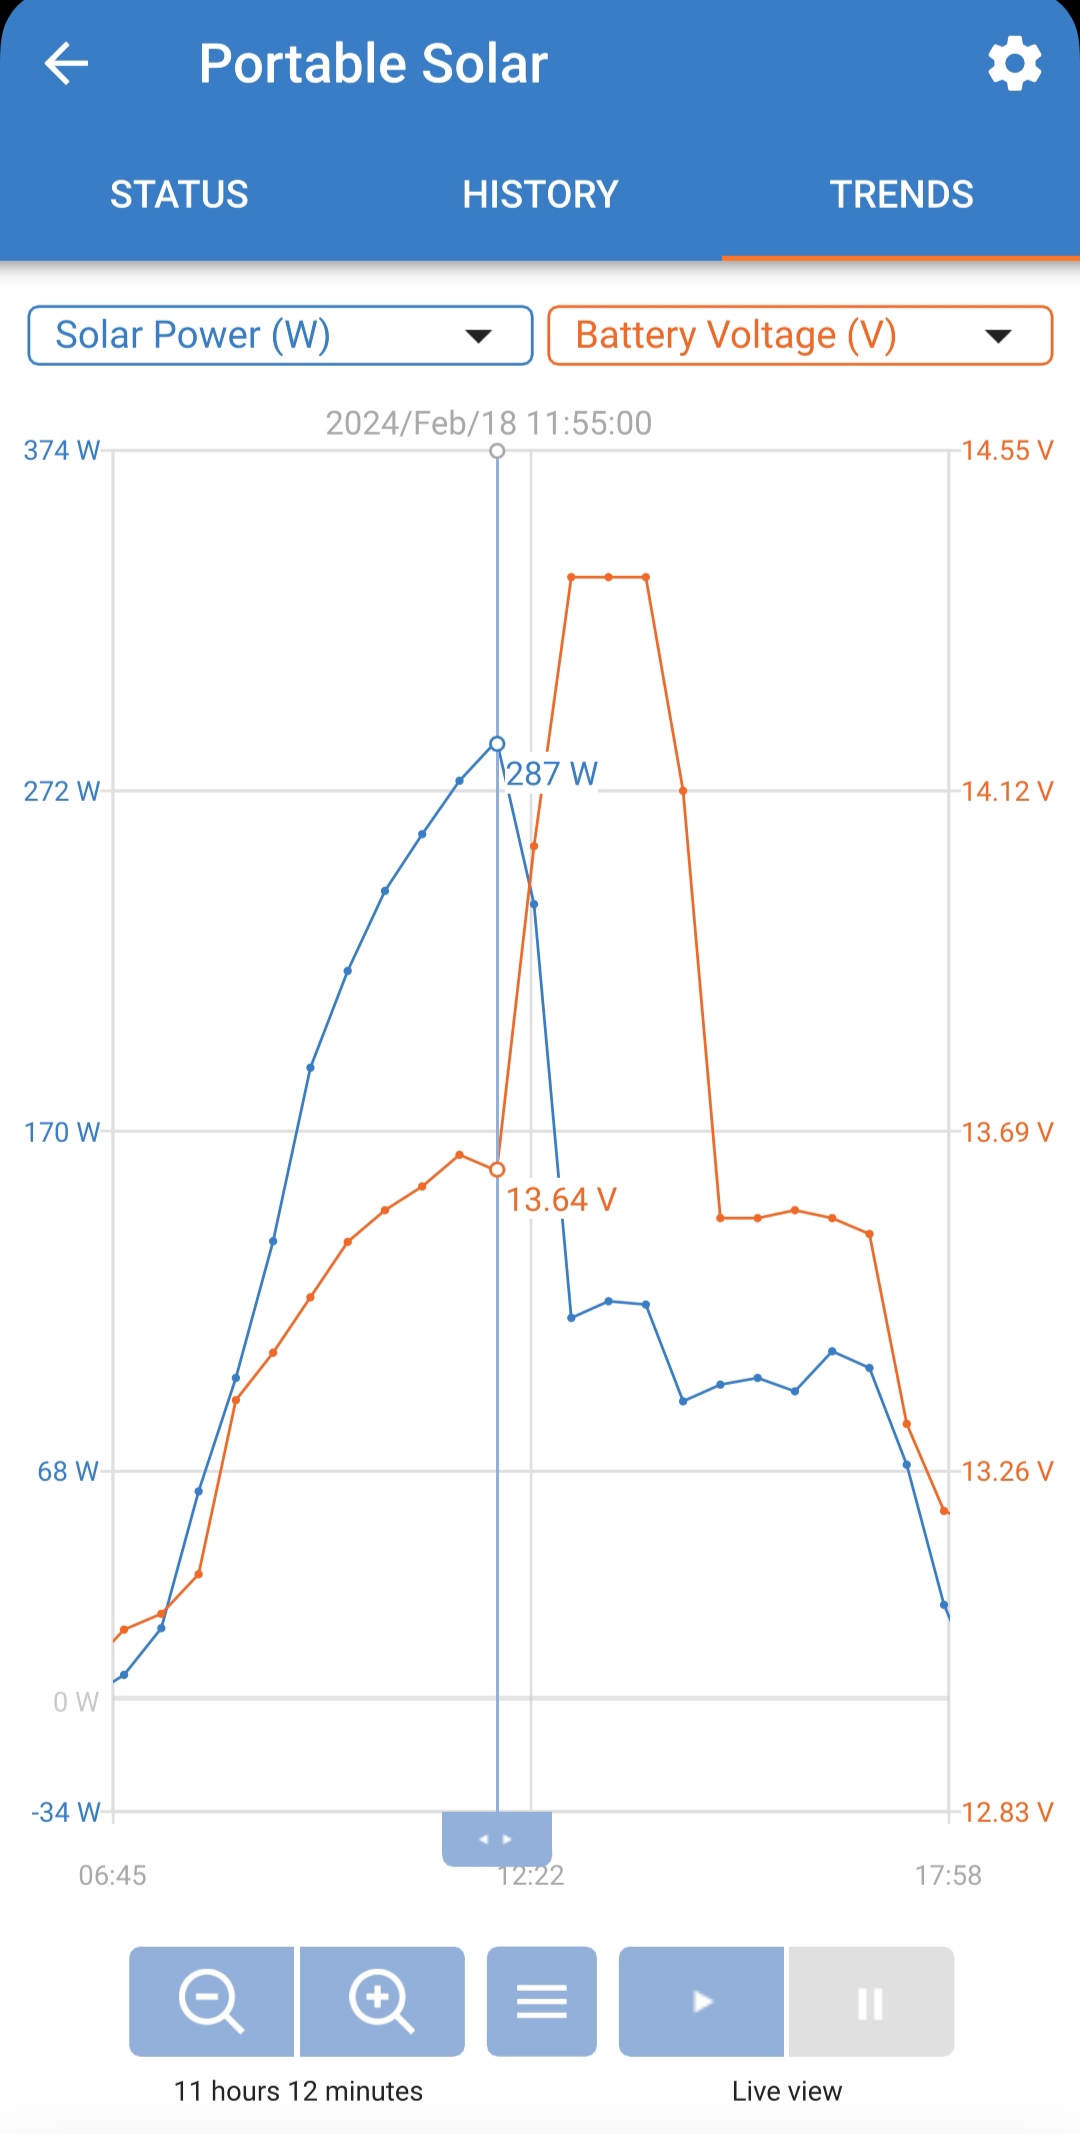
Charting often averages, or smooths, a sample over the sample period, with an actual peak being higher and recorded separately.

2 |3000

Up to 8 attachments (including images) can be used with a maximum of 190.8 MiB each and 286.6 MiB total.