question

nickb avatar image
nickb asked

VRM Realtime data not matching Installation graph data

Hi guys,

I have a strange one I'm hoping someone has come across before. I have a Victron ESS system setup consisting of the following components:

.Cerbo GX

.3X Multiplus II 10,000

. 450/200 MPPT RS

. Fronius SYMO 20

. Victron Energy Meter VM-3P75CT

. PYLONTECH Batteries

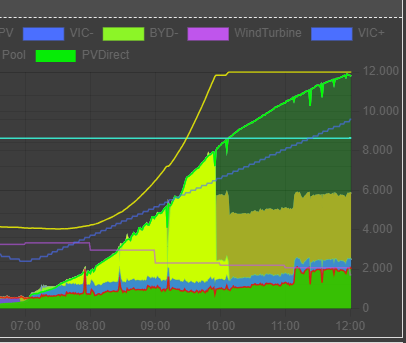
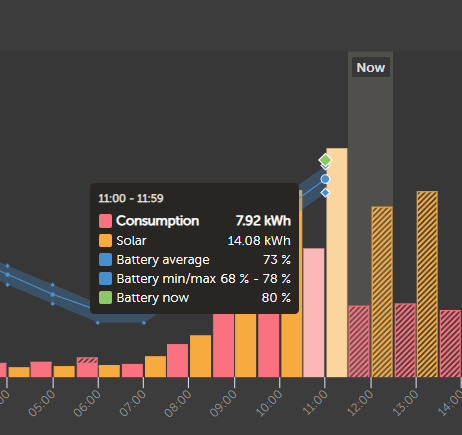
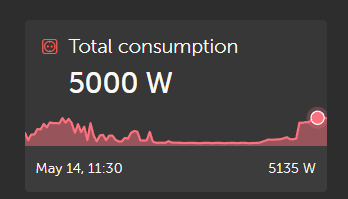
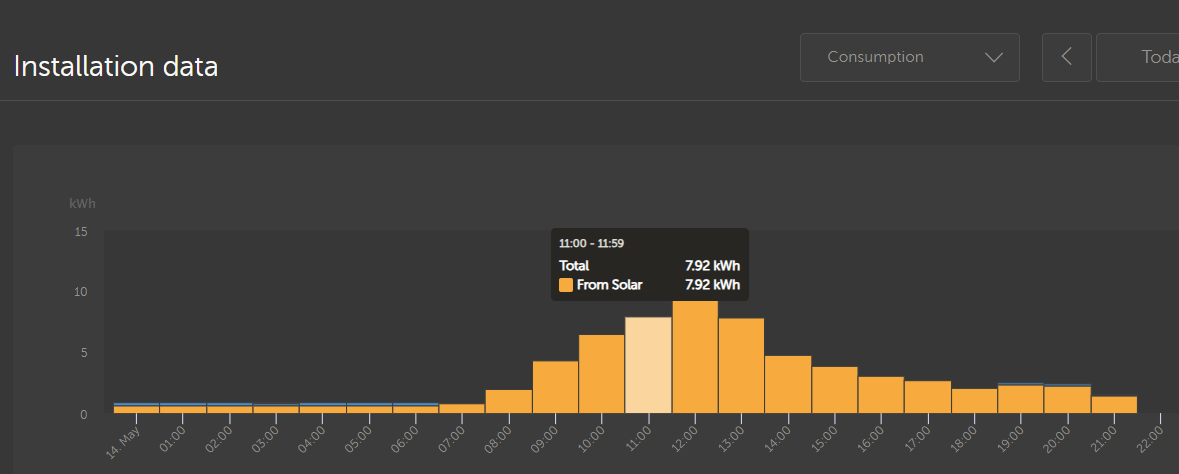
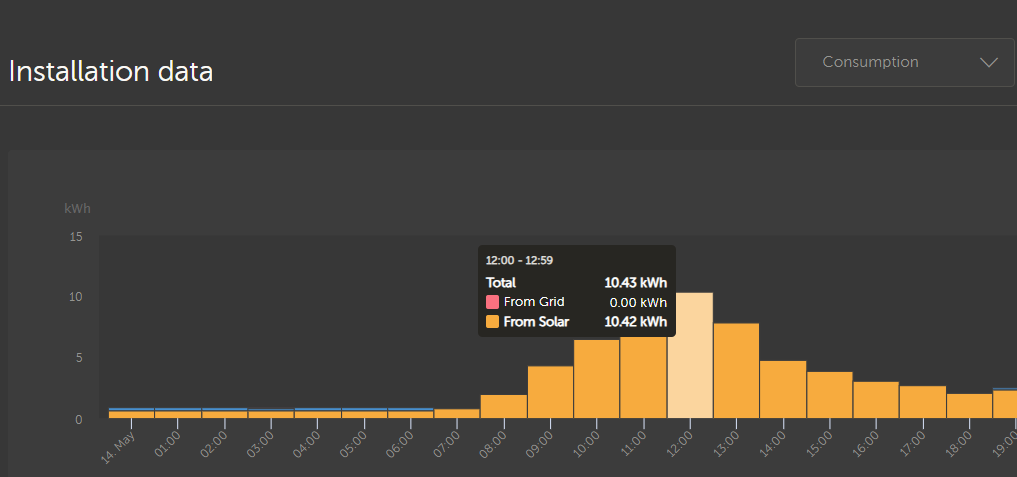
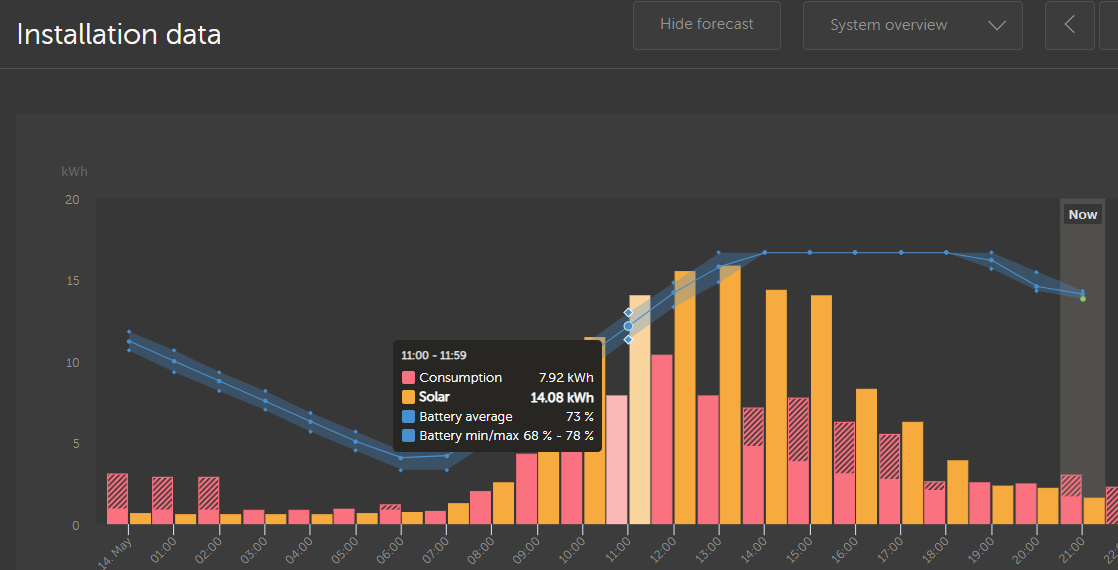
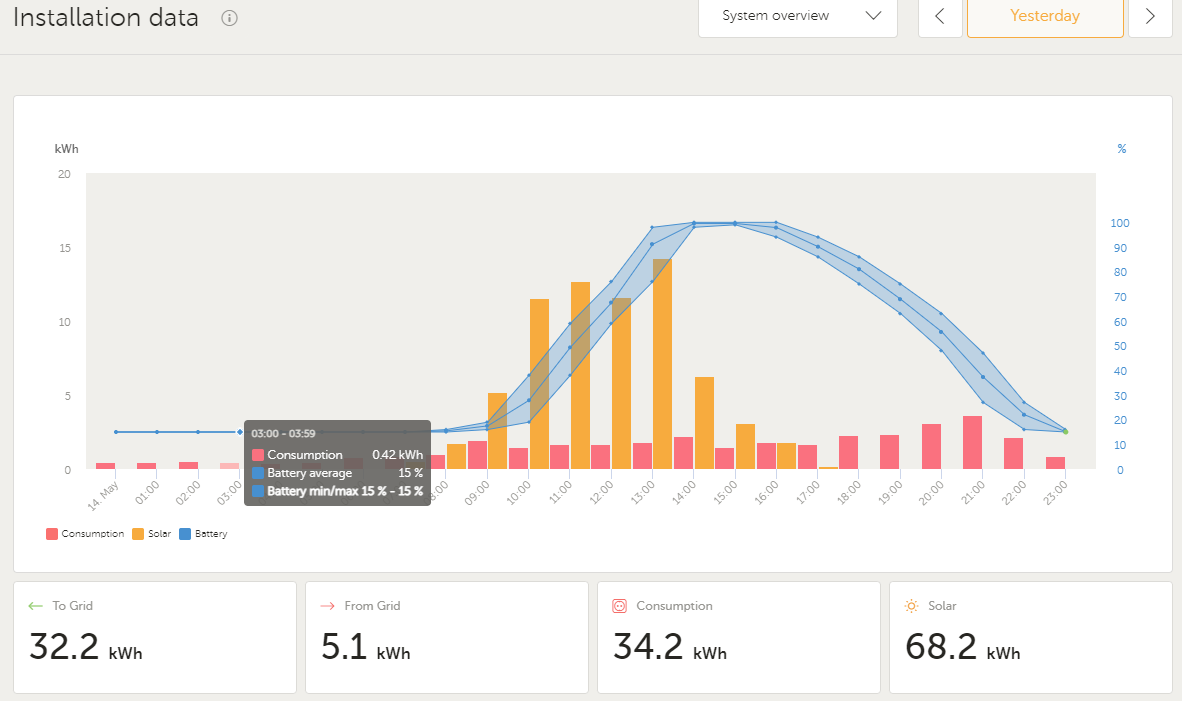
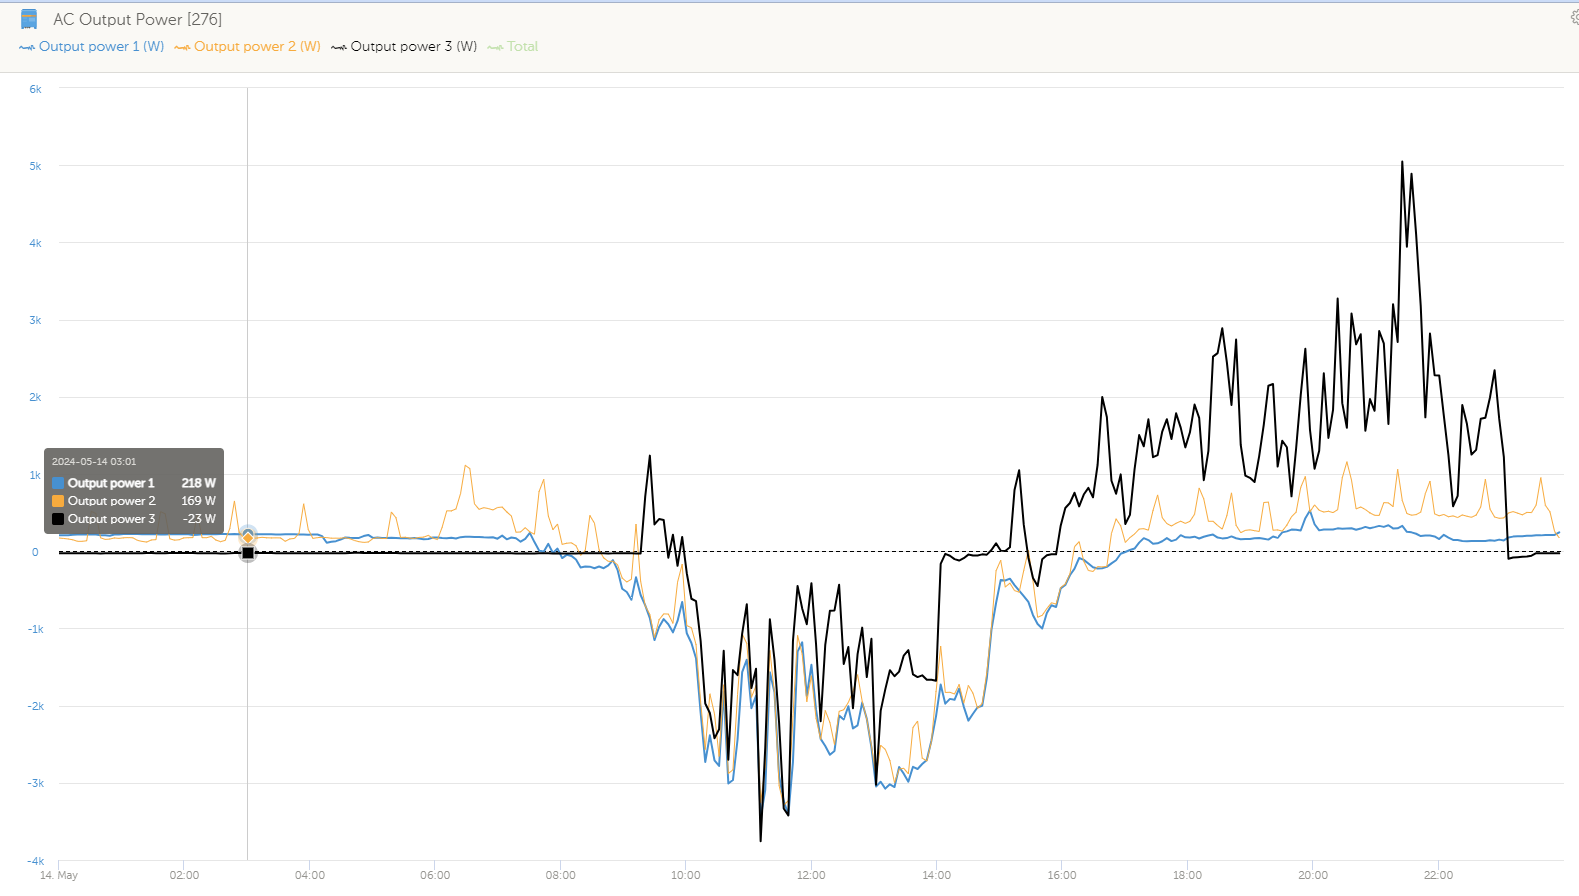
The problem I'm having is the VRM dashboard is reading the realtime data correctly but not displaying the installation data correctly below. It seems like the graph data isn't reading the loads correctly. It seems to be pulling its data from the Multiplus II's output and not the energy meter. It seems to be displaying only the critical loads on the graph and not the 'AC Loads" + "Critical Loads".

Any suggestions would be appreciated, thanks for reading.

ESS
1 comment
2 |3000

Up to 8 attachments (including images) can be used with a maximum of 190.8 MiB each and 286.6 MiB total.

dognose avatar image dognose commented ·
Please check, that:


- ESS is set to use the external meter and not "Inverter".
- PV Inverter is configured according to it's real position (AC-In vs AC-Out)

0 Likes 0 ·
5 Answers
nickb avatar image
nickb answered ·

Hi @dognose,

Yes, I have Grid Metering set to " External Meter" in ESS settings and the Fronius is assigned to its correct position AC output. I don't think the Fronius's position is affecting it because the loads are graphing incorrectly at night time. To me it almost seems like a firmware bug in Victron's reporting.

2 |3000

Up to 8 attachments (including images) can be used with a maximum of 190.8 MiB each and 286.6 MiB total.

dognose avatar image
dognose answered ·

@nickb

I've also noted some wrong numbers with the graphs.

Just right now:
- Last hour is a steady 6000 Watts according to my own monitoring, identical to the fronius-portal as well (direct consumption + ESS Charge + Electric Water-Heater)

1715680918484.png
VRM however concludes that the consumption was about 8 kWh and Solar sums up to 14 kWh, where there have apparently been a Peak-Power of 11 - 12 kW today.

1715680986529.png

So, there indeed seems to be an issue with VRM at the moment? Can't explain the differences, tho, especially why "solar" is off by about 16%. Data used comes from the same Smart-Meter, so should basically be equal.

Update: Even the VRM PV-Yield of solar clearly shows that the PV Power ranged between 10 and 12 kW for the time 11-12 - how can that be a sum of 14,08 kWh?

1715681765870.png

To me, it seems as these values are accidently considered "Currencies" and the VAT of 19% is added :P

Edit 2:
Also the "Total Consumption" widget supports that there have been ~5 kWh of Consumption (+500W invisible Bat-Charge), not 8 kWh as the Installation-Data-Graph calculates...

1715682473334.png


1715680918484.png (35.3 KiB)
1715680986529.png (31.5 KiB)
1715681765870.png (19.2 KiB)
1715682473334.png (9.5 KiB)
1 comment
2 |3000

Up to 8 attachments (including images) can be used with a maximum of 190.8 MiB each and 286.6 MiB total.

dognose avatar image dognose commented ·

Maybe @Guy Stewart (Victron Community Manager) can poke somebody in Charge to look at this Issue?

0 Likes 0 ·
dognose avatar image
dognose answered ·

I've now had some time to look into the numbers from today and figured out the following:

- VRM is considering 100% of my Solar-Production as "Direct Use". Note the two numbers 7.92 kWh and 10.42 kWh for the next hour:

1715714488035.png
1715714571814.png
When shown in System Overview, these figures become "Consumption", and VRM seems to "add" the actual consumption (as mentioned ~ 6 kWh during these hours) on top of that to engineer the new "Solar" Value:

7.92 kWh + ~6 kWh becomes 14.08 kWh Solar.
10.42 kWh + ~ 6 kWh becomes ~ 16 kWh Solar.

Why is VRM considering 100% of Solar-Production as "Direct Use"-Consumption?
Live-Data is showing Feed-In Values of -5000 to -6000 just fine...?

@nickb Can you check, if this is the same Issue for you?

1715714704768.png
1715714751062.png


1715714488035.png (31.5 KiB)
1715714571814.png (30.4 KiB)
1715714704768.png (68.7 KiB)
1715714751062.png (62.4 KiB)
2 |3000

Up to 8 attachments (including images) can be used with a maximum of 190.8 MiB each and 286.6 MiB total.

dognose avatar image
dognose answered ·

Ok, I figured out, what is going wrong (in my Case):

I'm using a Fronius Hybrid with Battery. To Visualize the Battery in VRM, a custom script is used that simulates a BMS and a Solar-Inverter.

Victron however is detecting Fronius-Solar-Inverters automatically. So I've set the found "Hybrid" to "Display: No" in the native PV-Inverter Menu.

However, that seems to only exclude the PV-Inverter to be excluded from the Live-View, NOT from VRMs Installation-Data-Calculation. Thus, my Hybrid Inverter is currently counted twice for historical data: One time through the custom implementation and one time through the Victron implementation.

So, that fraction of "PV-Production" is not visible as Feed-In (apparently, because it does not exist) - So VRM concludes, that there is additional consumption equal to the Power of 1 times the hybrids inverter output.

Now it would be super useful to have the feature to remove detected PV Inverters. Has been promised to be ready in a few months end of 2022 ;-)

2 |3000

Up to 8 attachments (including images) can be used with a maximum of 190.8 MiB each and 286.6 MiB total.

nickb avatar image
nickb answered ·

I think our situation differ because I'm not using a hybrid inverter with the Victron. The Fronius AC coupled inverter on my system is just grid tie and the Victron's are the only battery chargers.

I have attached some graphs below, to me it looks as simple at the graph isn't pulling data from the correct widget. Because the realtime data is reading correctly I assume the system is configured correctly.

Energy meter data - shows correct site loads

1715725174501.png


Overview graph - not showing consumption correctly

1715725260690.png


Multiplus II Output - seems to be where the the graph is pulling it's data

1715725235842.png


1715725174501.png (154.2 KiB)
1715725235842.png (132.1 KiB)
1715725260690.png (71.4 KiB)
2 |3000

Up to 8 attachments (including images) can be used with a maximum of 190.8 MiB each and 286.6 MiB total.