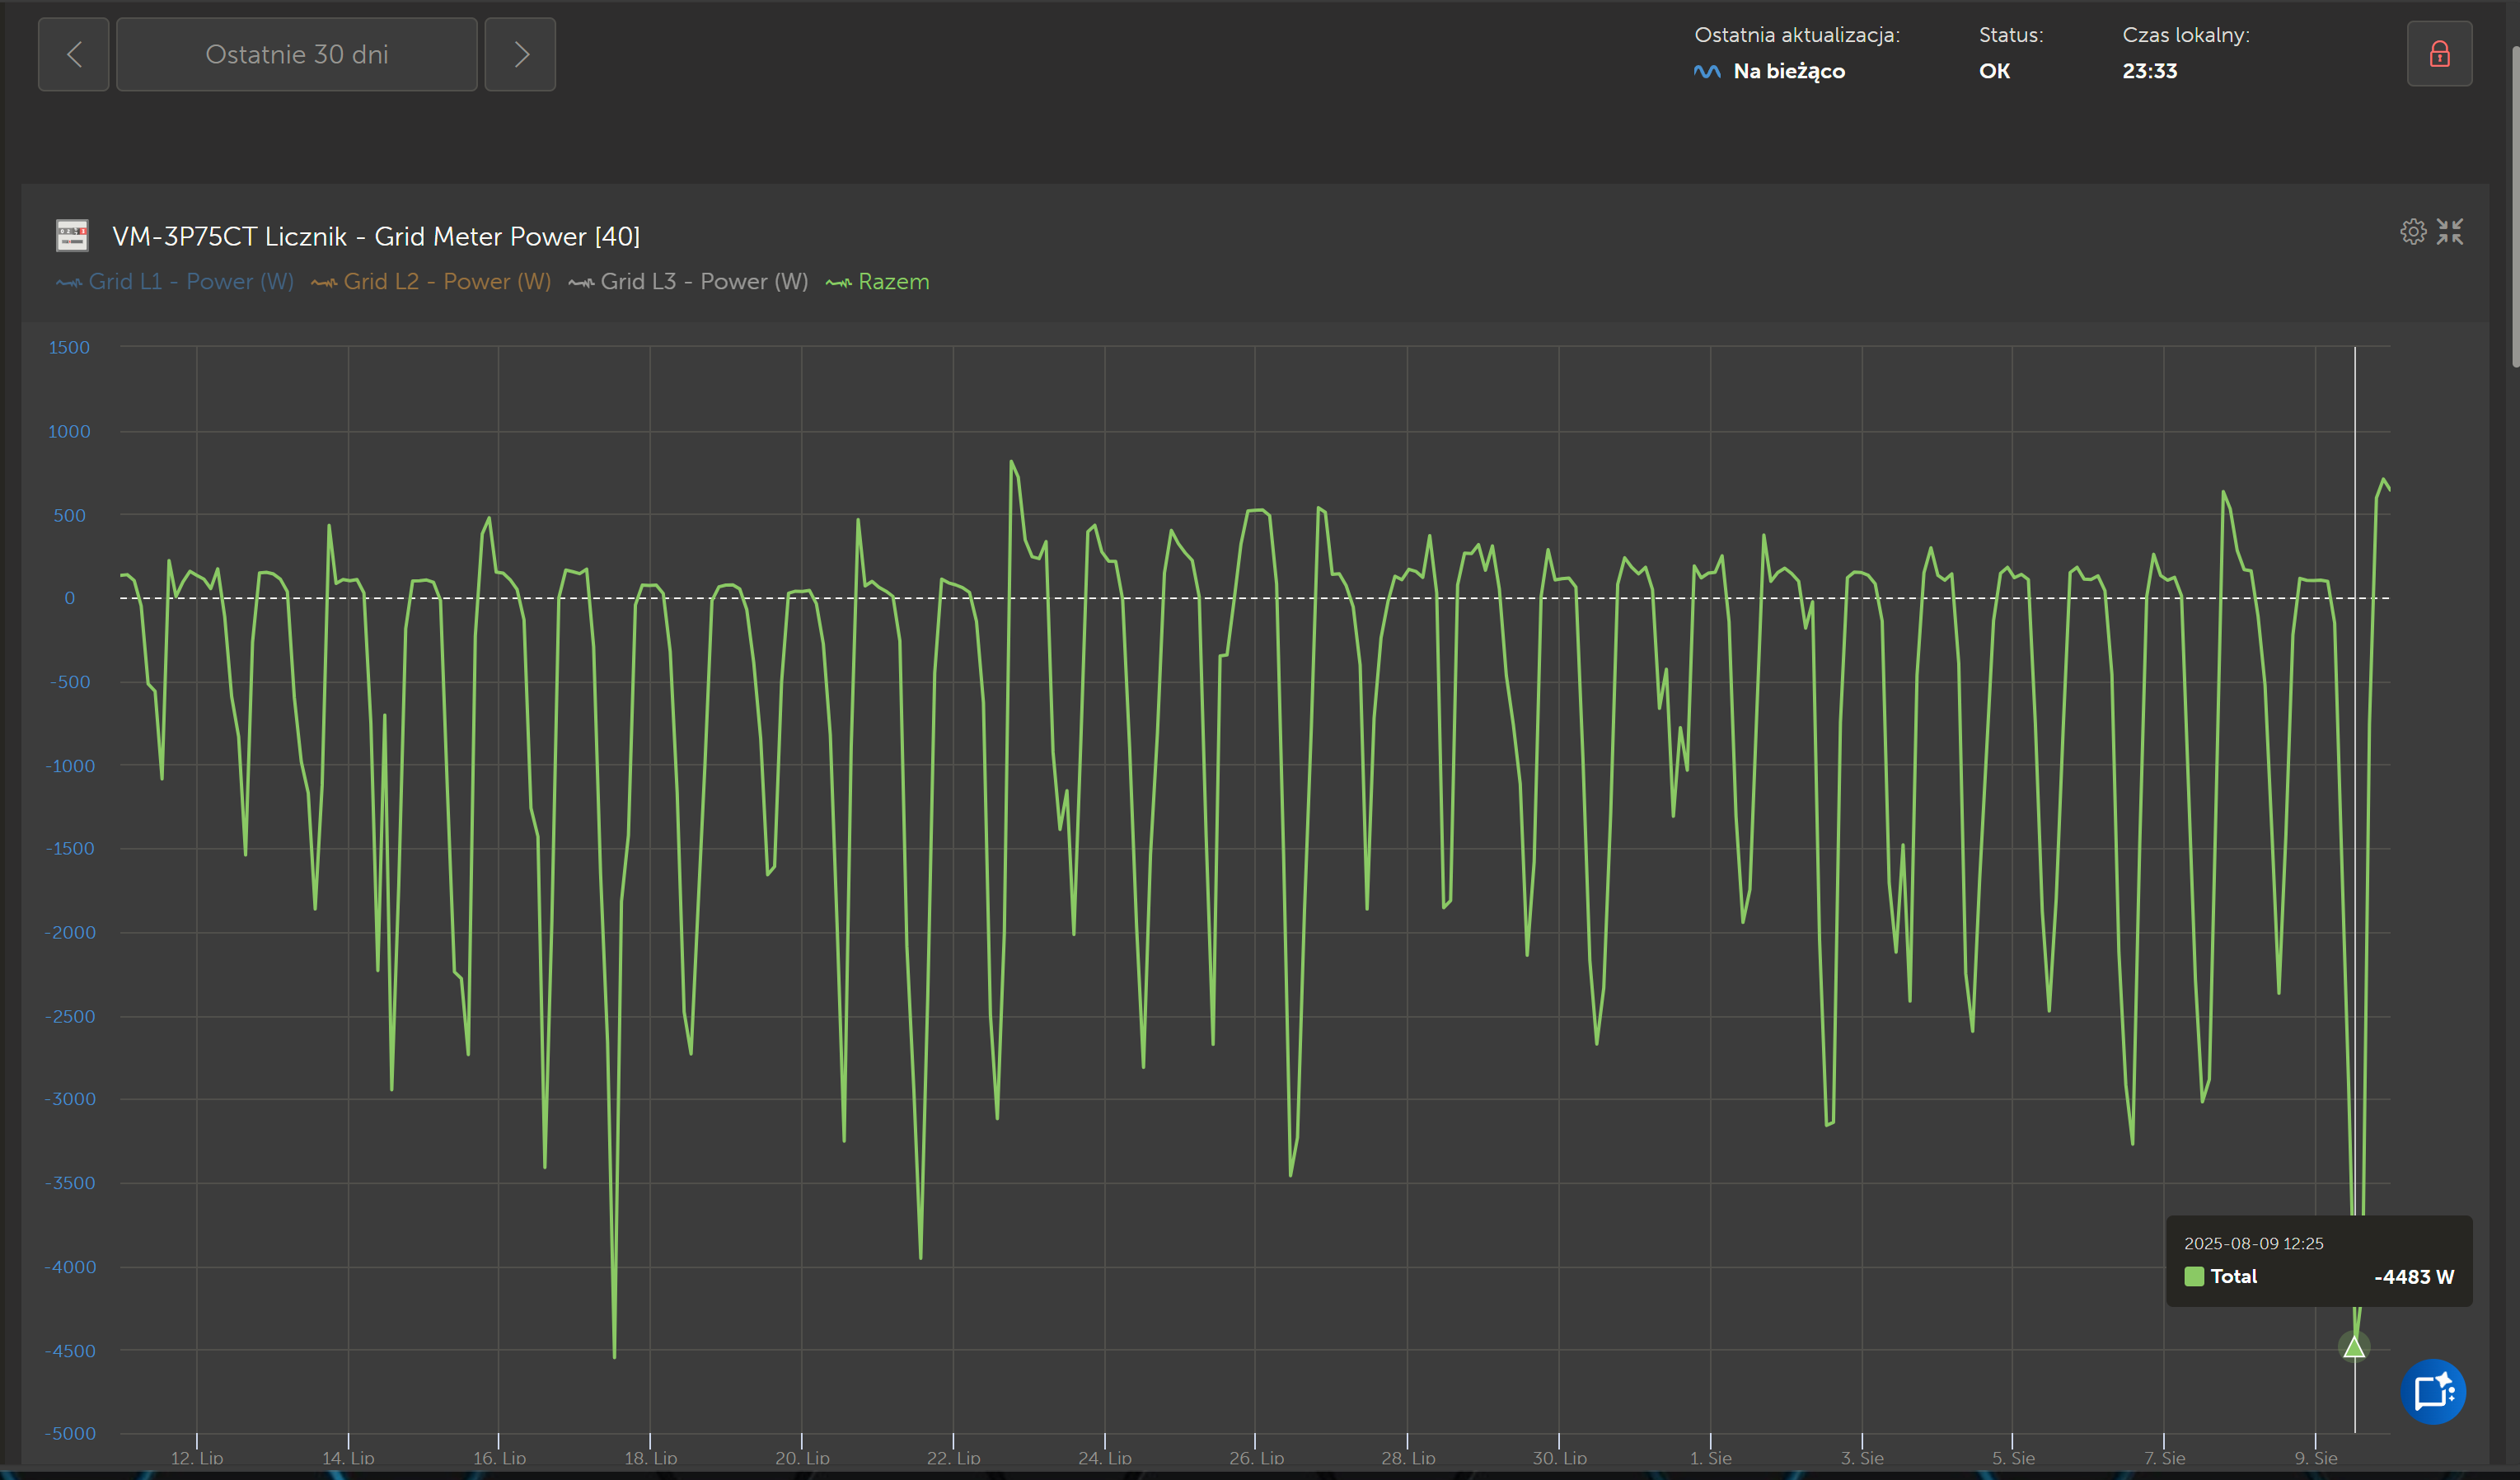
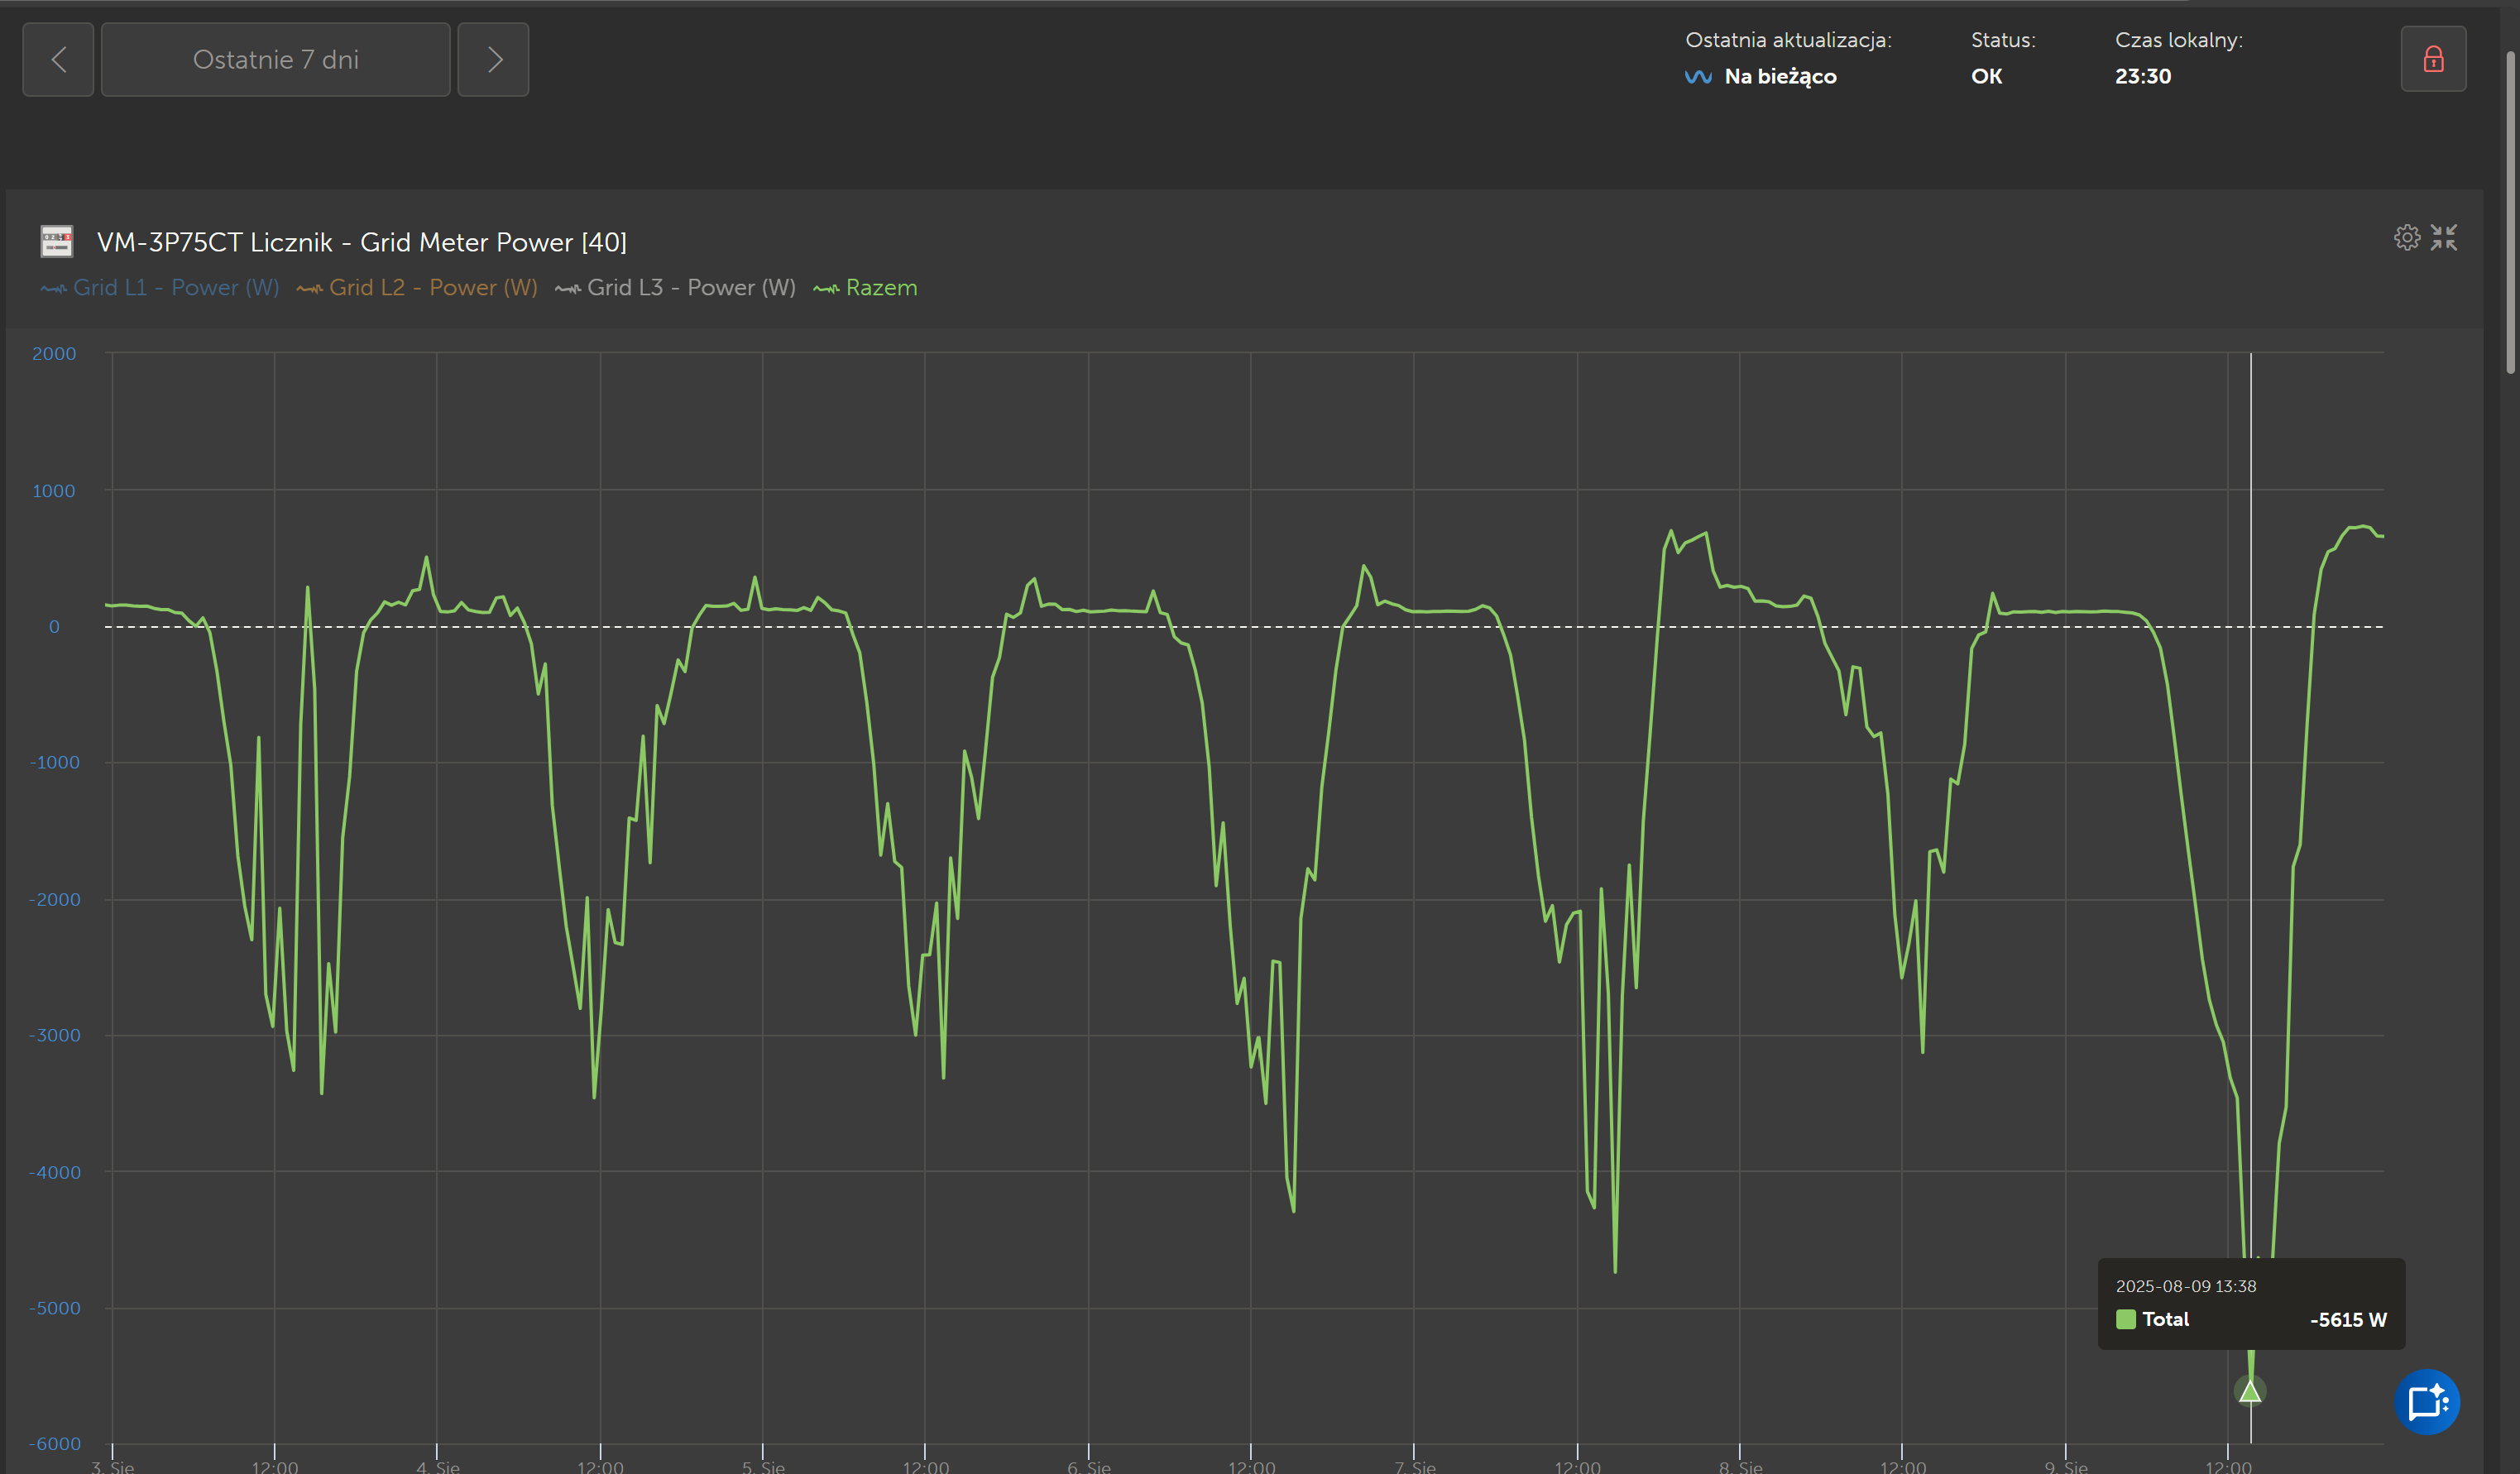
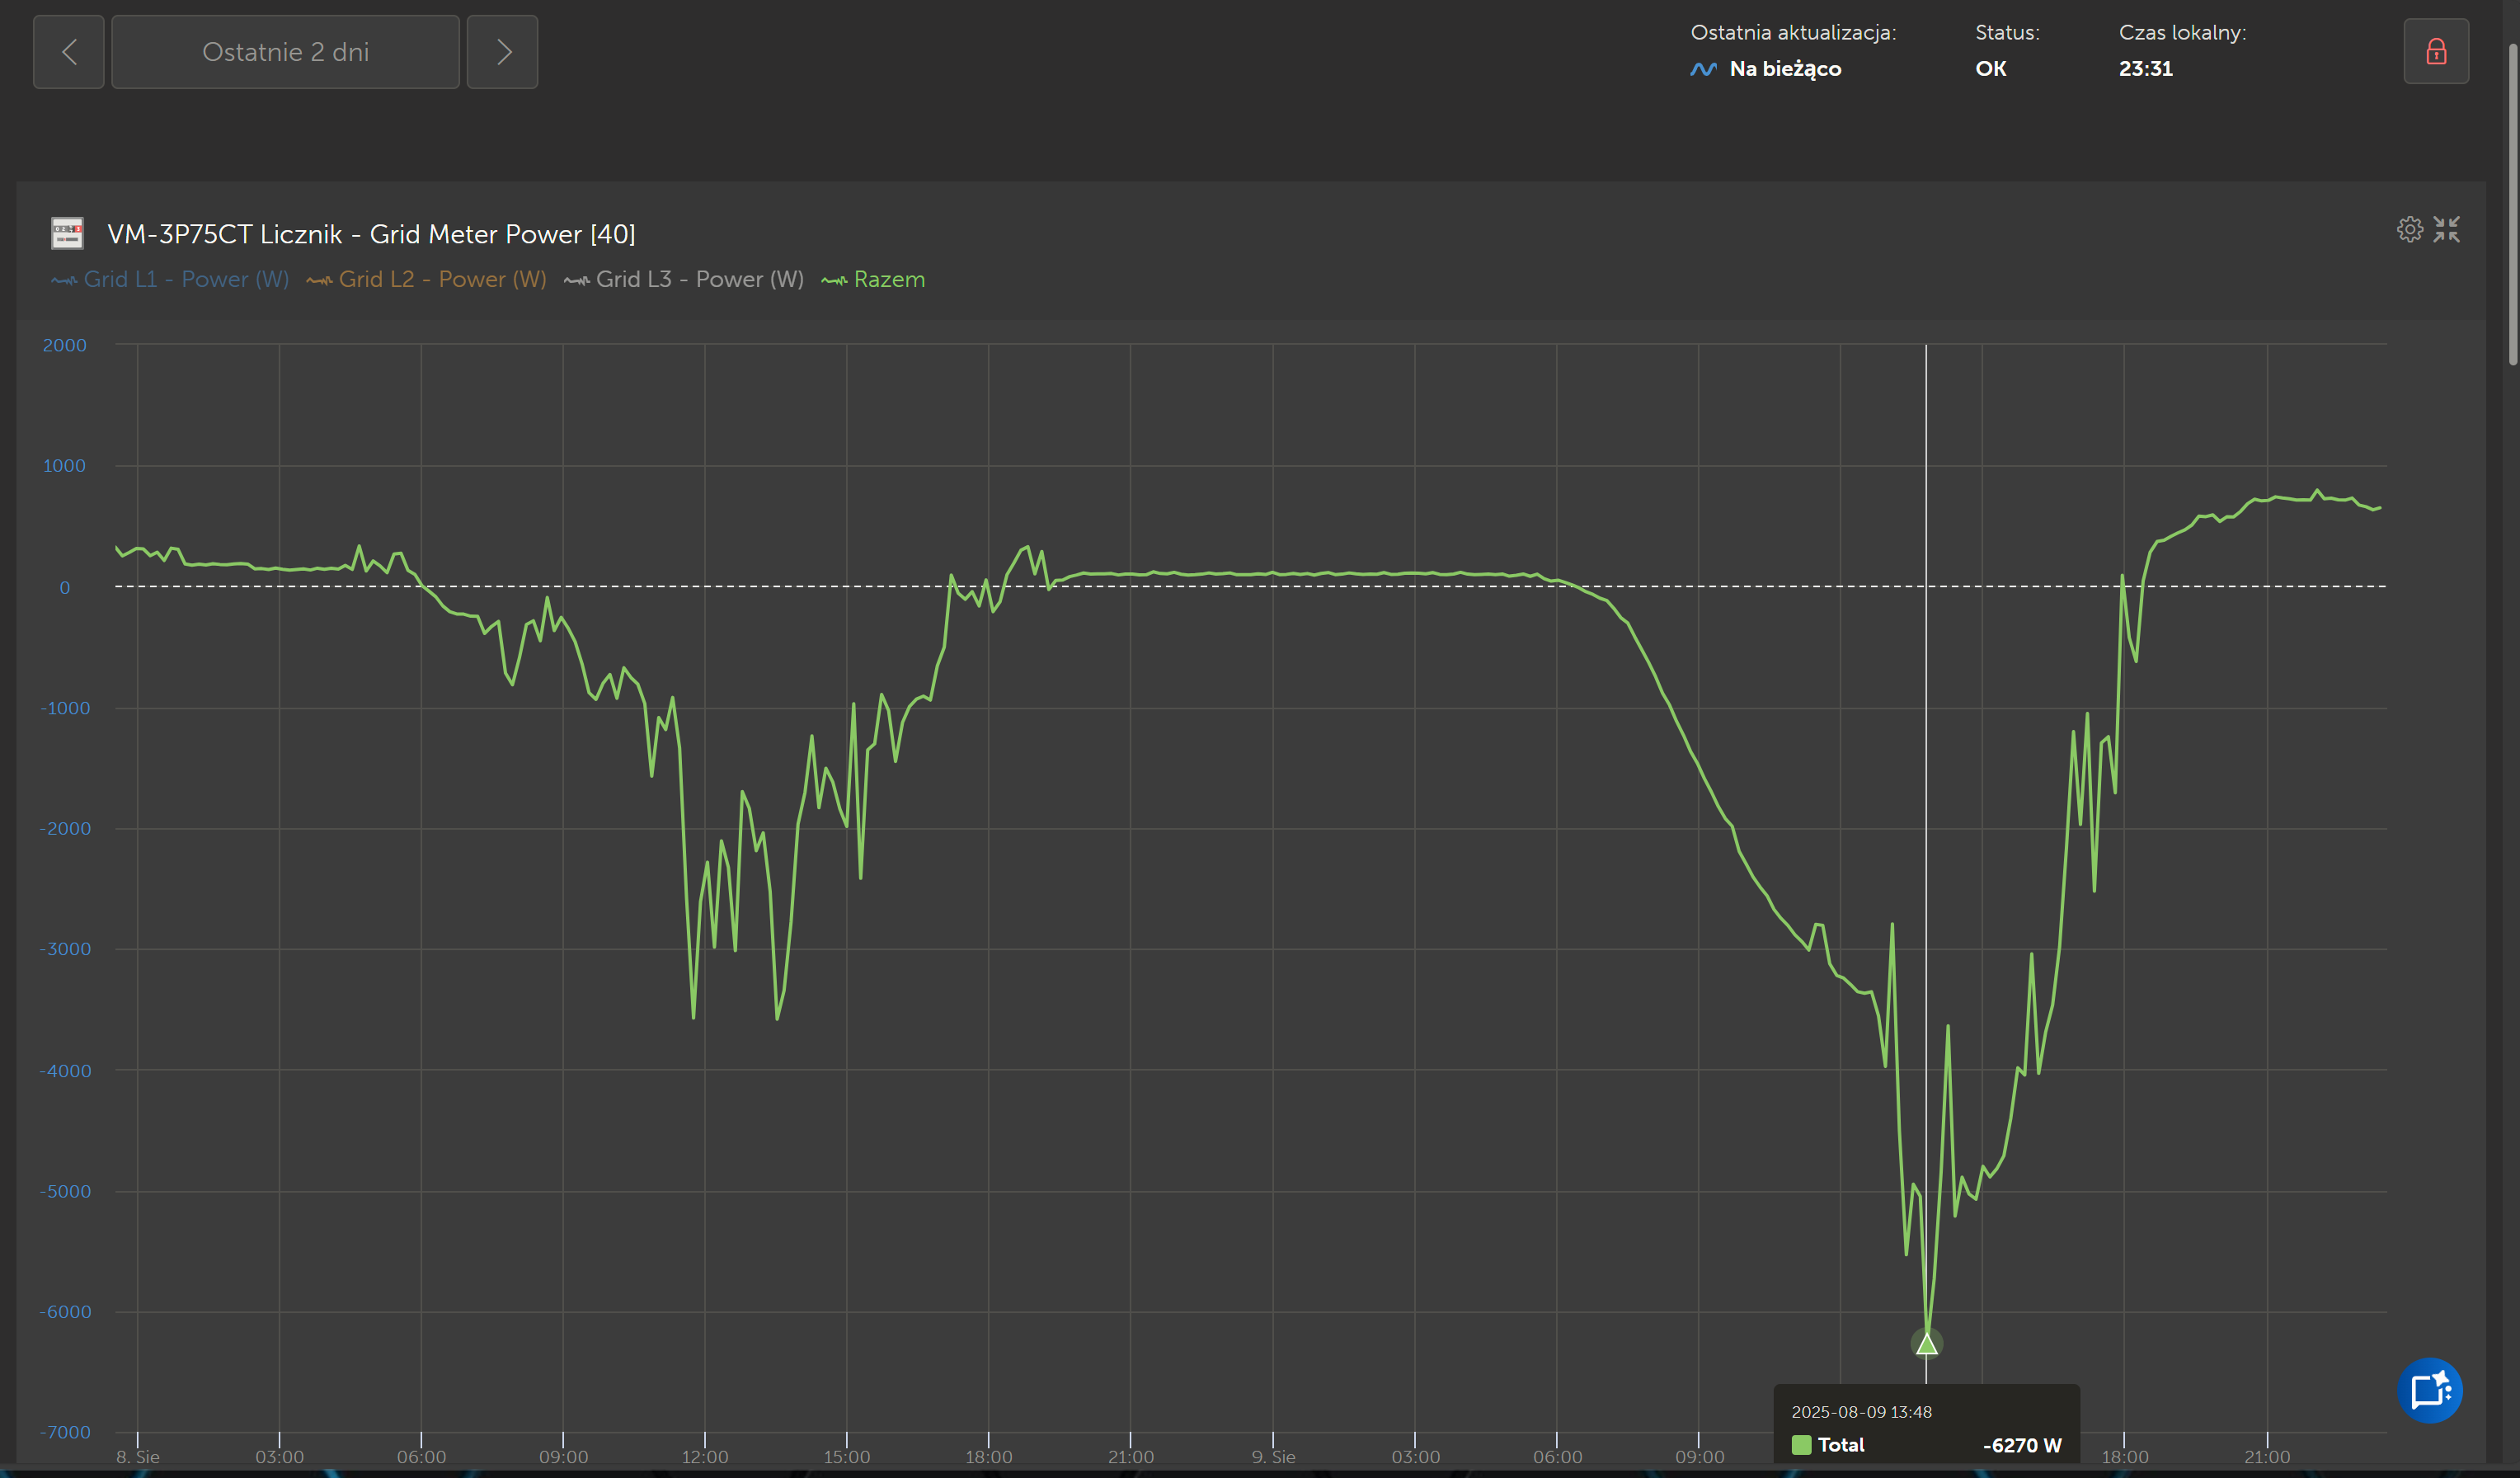
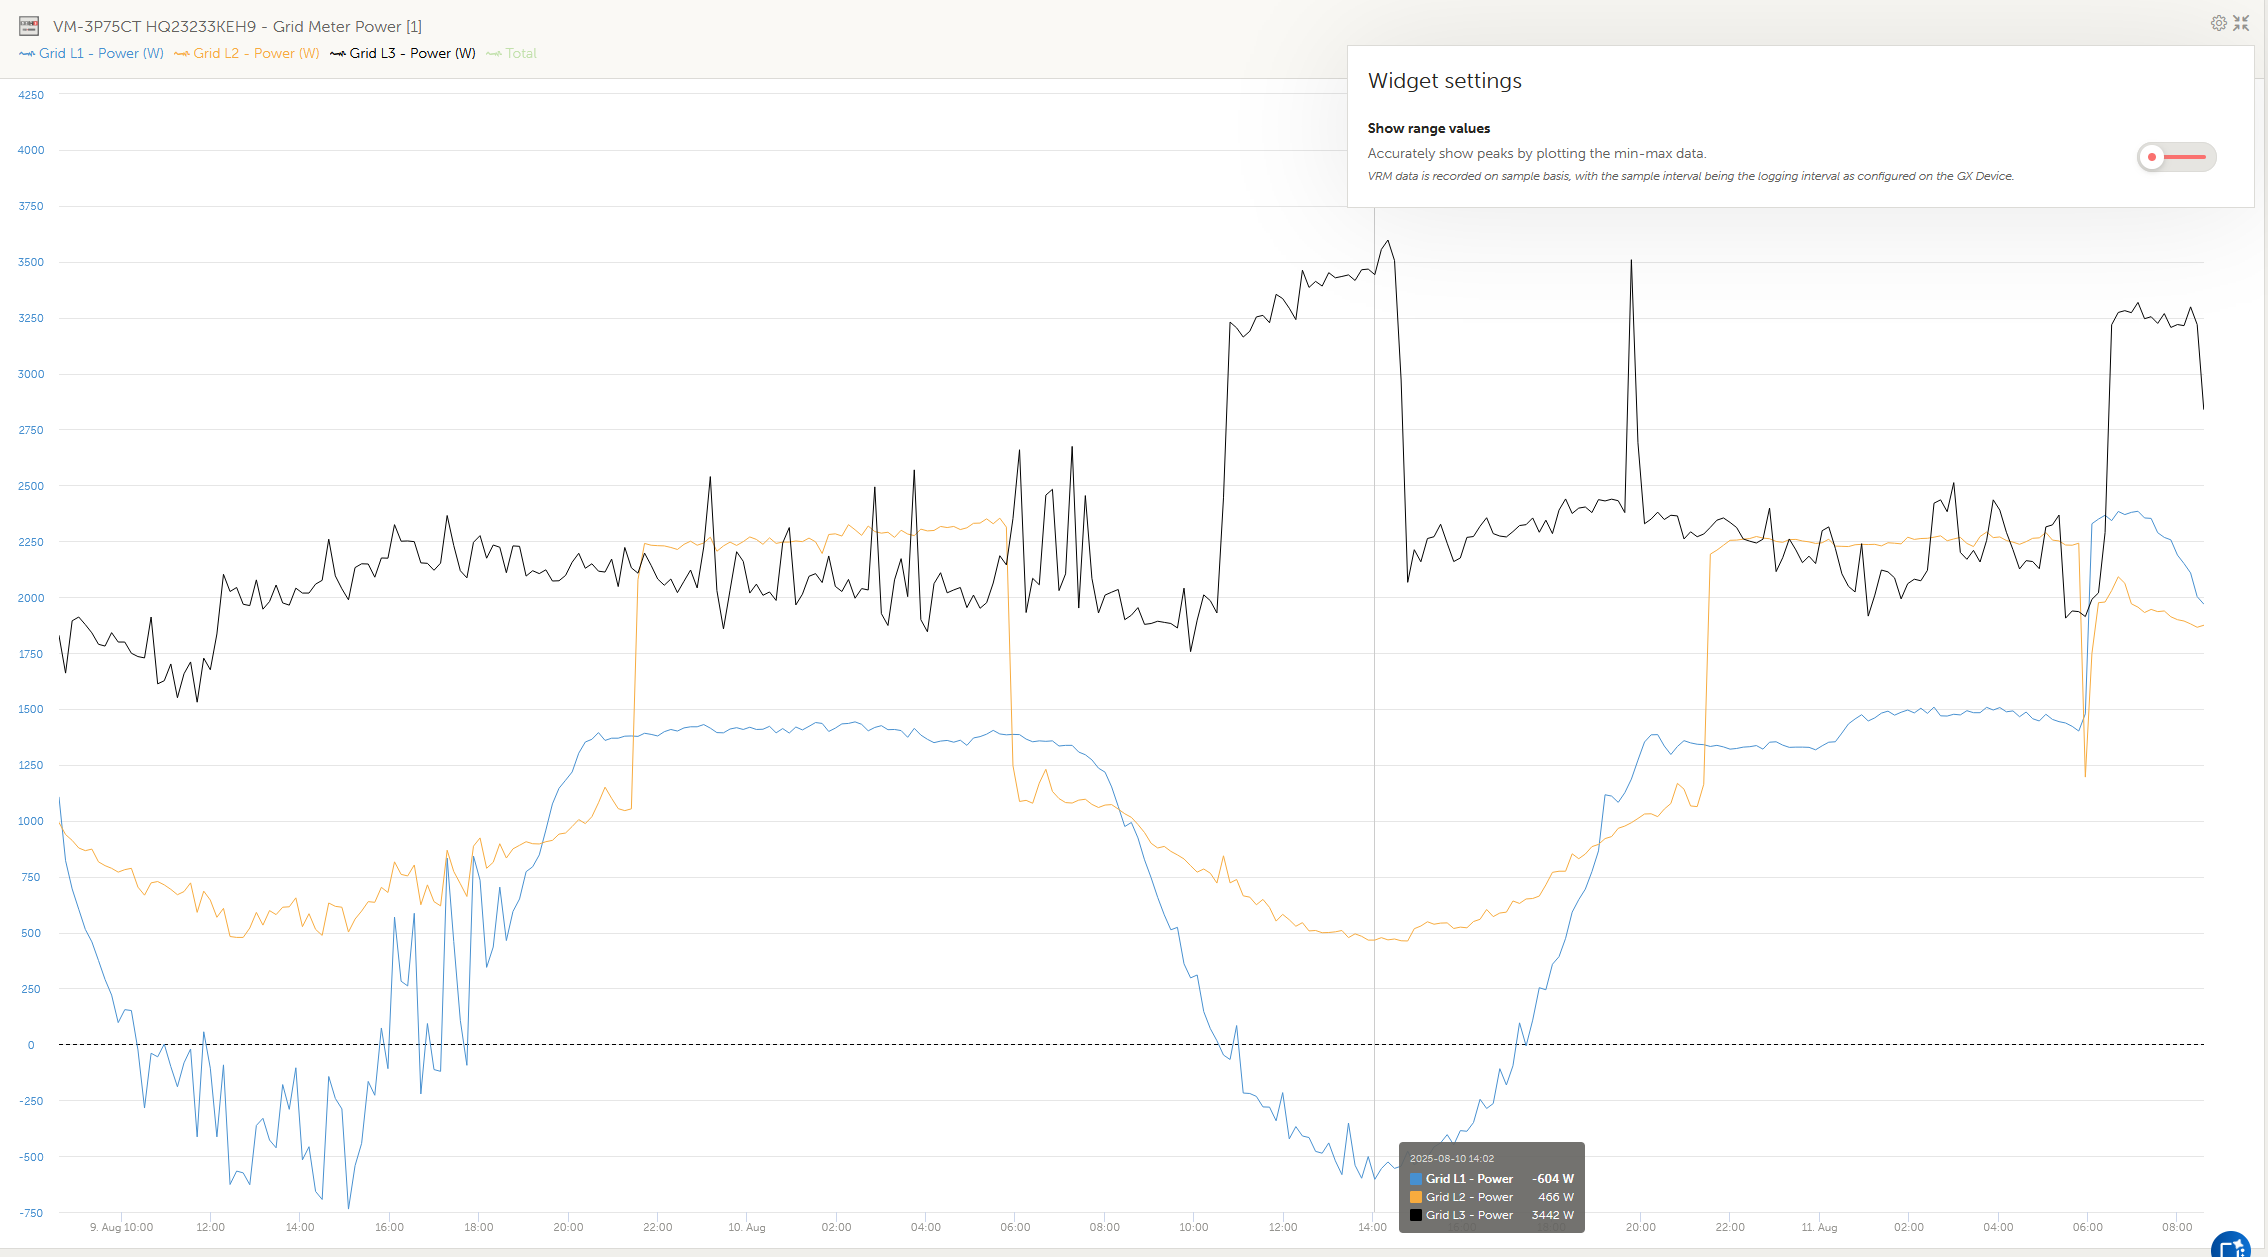
Incorrect display of peak data sent to the network.
Changing the number of days decreases the displayed number of watts sent.
1 day = -6619 W
2 days = -6270 W
7 days = -5615 W
30 days = -4483 W
90 days = -3769W
Incorrect display of peak data sent to the network.
Changing the number of days decreases the displayed number of watts sent.
1 day = -6619 W
2 days = -6270 W
7 days = -5615 W
30 days = -4483 W
90 days = -3769W
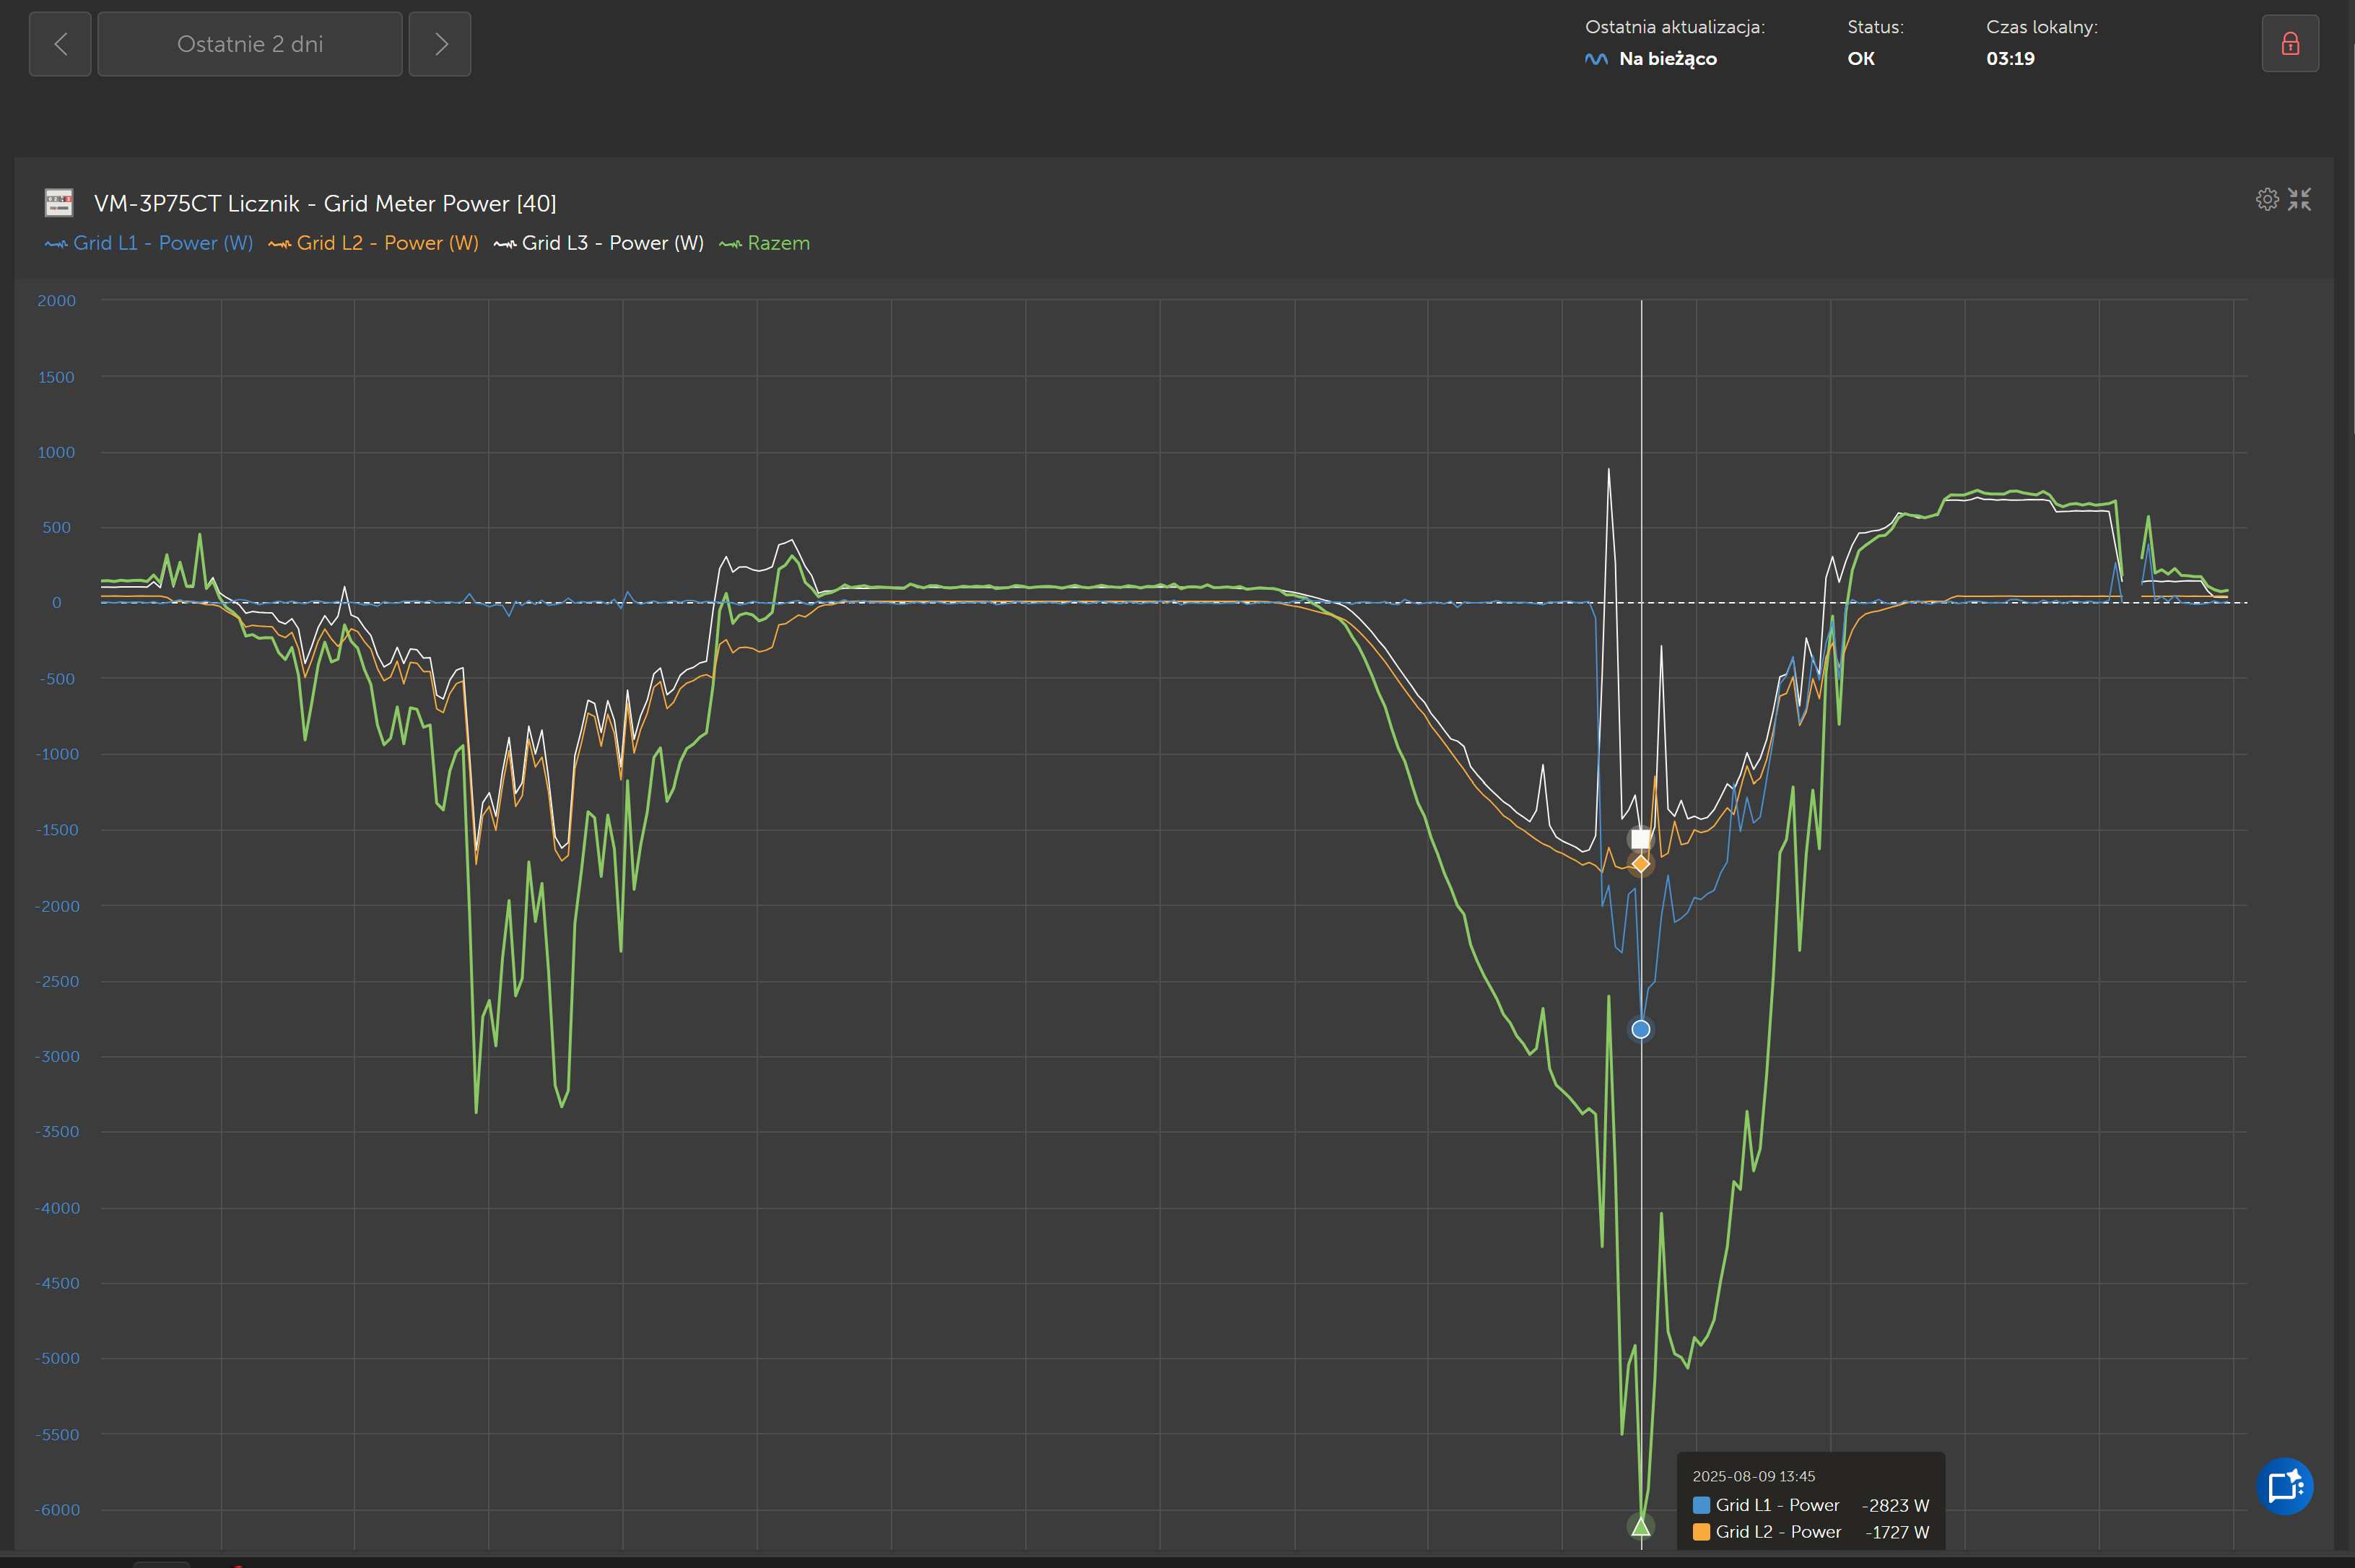
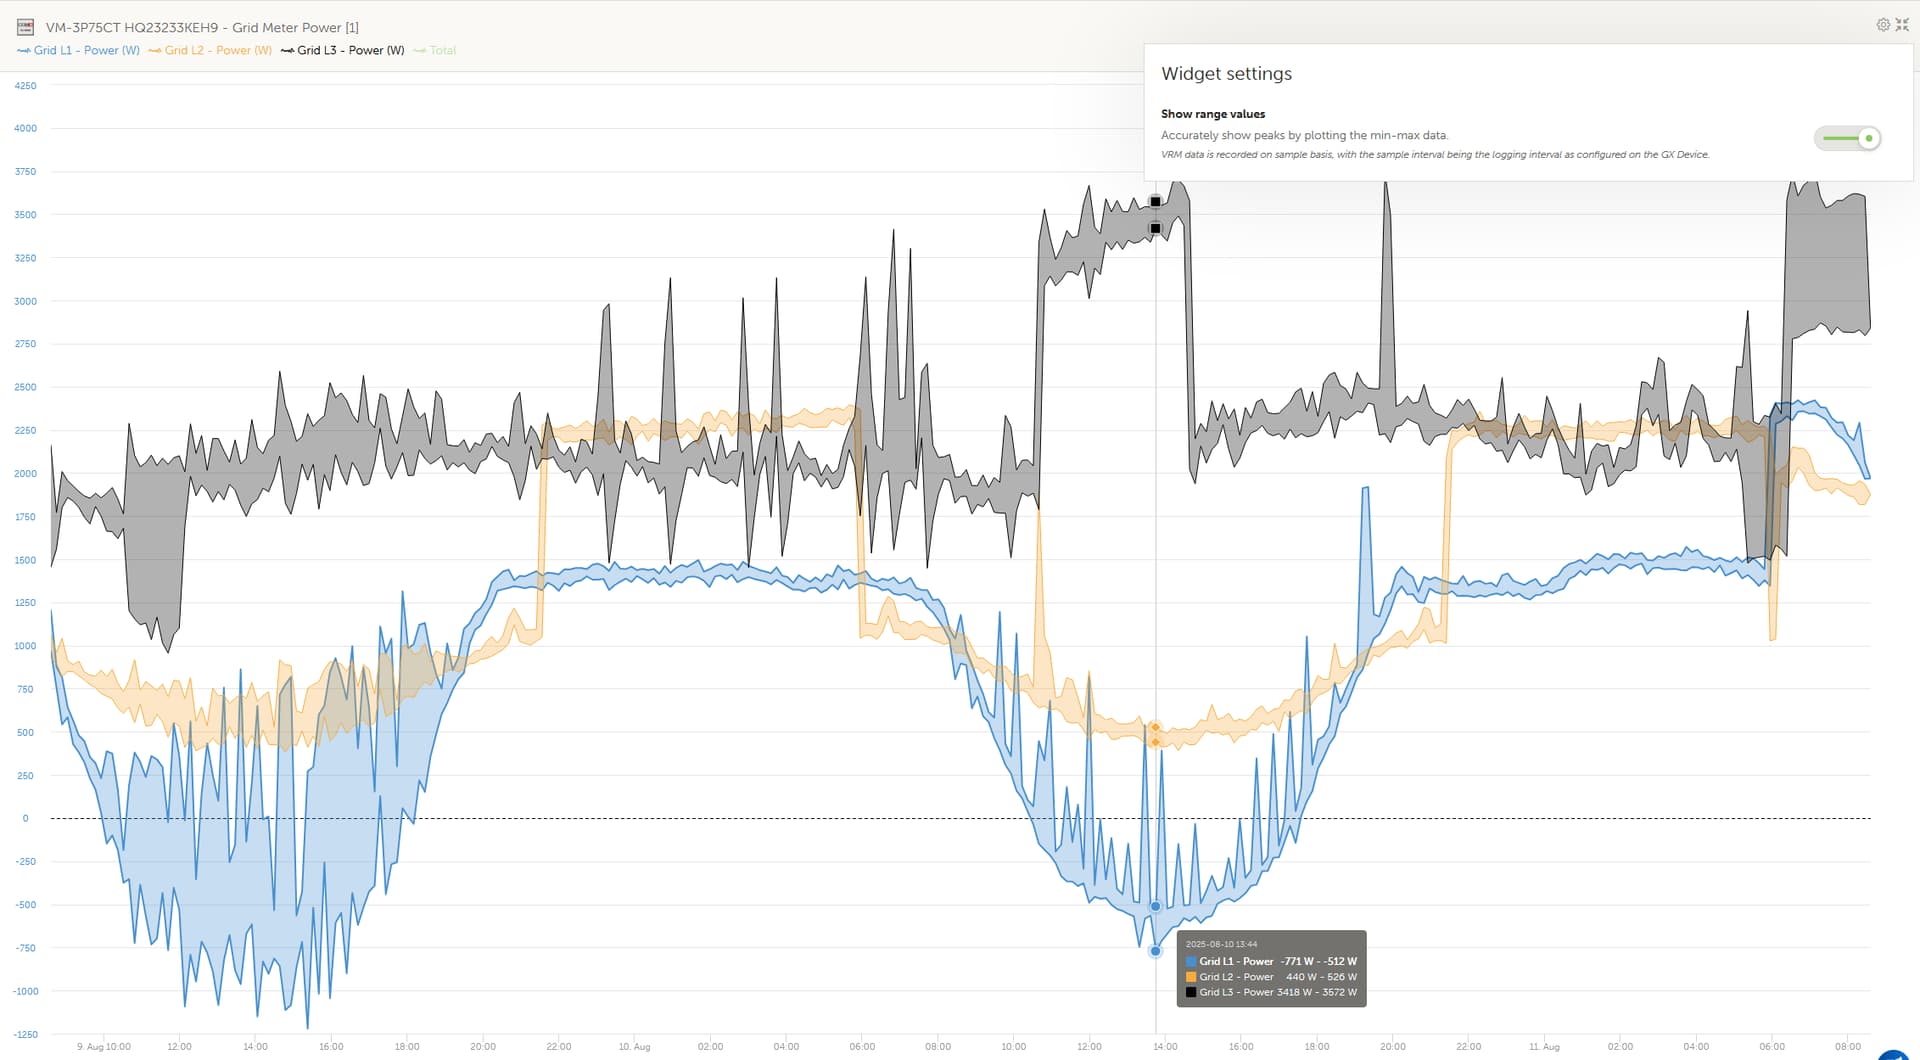
Hi @Andrzej, a smoothing filter is applied when looking at larger timeframes. You can display the min-max values by applying the “Show range values” setting for your advanced graphs.
Dzięki za podpowiedź
This topic was automatically closed 14 days after the last reply. New replies are no longer allowed.