Unwanted Reboots

nano comes to mind.

These are the values from load average in top or uptime.
Load average 3.00 4.00 5.00
In this example, 3.00 is the current value, 4.00 is short-term average (max-load-5) and 5.00 is long-term average (max-load-15). You should change both if you observe values larger than the default settings. The long-term value tends to be lower if the system load is generally manageable for the CPU.

My load values are scattering from 1,7 to 6,5 without any changes in the system. Sometimes Venus seems busy with anything. At least, there were no more reboots since changing the watchdog values but needs some more days to be proven.

root@einstein:~# uptime
 21:10:35 up 10:39,  load average: 1.71, 2.30, 2.69
root@einstein:~# uptime
 04:29:34 up 17:58,  load average: 2.92, 3.00, 3.16
root@einstein:~# uptime
 05:48:27 up 19:17,  load average: 6.48, 4.68, 3.82
root@einstein:~# uptime
 09:05:52 up 22:35,  load average: 5.94, 6.09, 5.92
root@einstein:~# 

Beside I noticed further issues with the project. In case of regulator saturation, my current shows overshoots to about 55 Amp with a 50 Amp AC circuit breaker. Circuit breaker does not trigger but the Ziehl EFR triggers occasionally at sunny afternoons for overshoots of more than 3 seconds. Now increased the Ziehl EFR values with some hope the circuit breaker will not trigger. Probably I have to shorten the regulators cycle time from 10 seconds to 5 or 2 seconds. Anyway we have to consider that power regulation is a typical realtime task but neither Venus nor NodeRed are realtime systems. Solar yield changes from 10 to 100 kW in less than 10 seconds with cloudy sky.

Very good. I’ve made the same observation with my system. With default settigs of watchdog, it would reboot several times a day, the load average creeping up and down from below 1 to more than 6.

If you’ve got Multiplus 2 in your system and using them in ESS configuration, I’m afraid we are out of luck in regards of realtime regulation. The Multiplus 2 has a firmware limitation for the speed of load changes hard-set to 400W/s (IIRC). I’m running my Node-red flows in 1s resolution, yet there are always overshoots in cloudy weather or when cooking that taper off over a couple seconds.

There are several threads in old and new forum for the 400W/s and any answer by Victron to this question is still unknown.

My observations for using a 9 pcs MP2 array as controlled system (Regelstrecke) in my closed loop regulator is that speed could be typically faster than 10kW/sec. Power output changes are not linear but approximate in e-curve shape like all regulators do. It is typically faster than every clouds are.

After reboot or resynch after grid failure, the MP2 AC regulator goes into another state what is much slower. 400W/s or slower below. To reach a grid setpoint of 30kW it takes several minutes! This speed limit is valid for both directions, increasing and decreasing power. It is that slow, that you can test with any ESS changing the grid setpoint manually in the menue.

If grid failure or system reboot is not frequently, the slow AC regulator speed doesnt hurt as it occurs only once while ramping up power to the grid setpoint after switch on. If reboot happens several times a day (our hour), this will cause a high percentage of drop in power production. Production is not only stopped while reboot or grid failure but also several minutes after while ramping up to the grid setpoint. Up on now, I have no idea what the conditions are to change from slow to fast state of the Multiplus AC regulators. Probably its doing itself without external events after some time of successful maintaining the grid setpoint.

Core question here is if you are “fighting” the right thing with regards to your problem. If the gx is highly loaded, the watchdog DOES the emergency reboot in order to clean out everything and restore a properly reacting system. (In terms of response-time)

Defering that reboot will just cause the the gx to continue running with high load, eventually not reacting in timely fashion to changing values.

So, you should rather look to fix the cause (what causes system busyness, what makes the watchdog reboot kicking in too often), not avoiding the (required) reboot to happen.

Apparently your node-red and systemcalc load are pretty high. So, most likely node-red does a lot of calculations / publishing which results in systemcalc becoming quite busy in handling these as well.

Also 9.9% Load from dbus-shelly-3em-inverter is an insane load for reading a meter. That smells like a pretty bad implementation there…

Just checked that on github, it is polling shelly data every 250ms in an synchronous way.
That absolutely makes no sence for two reasons:

1.) The shelly does not update it’s internal values at this pace.
2.) A synchronous web-request to a wifi-device on a single-thread control loop is a terrible bad idea. It’ll cause everything to stuck (every 250ms) until the shelly responded.

After changing the watchdog values to the setup suggested by @Ektus the stability hits its records. Therefore it seems not any cumulative problem like memory allocation what is solved from time to time by cleaning the system by reboot.

root@einstein:~# uptime
 10:37:13 up 2 days, 6 min,  load average: 3.36, 4.11, 4.68

The reason is clearly NodeRed and inside the flow it seems Modbus TCP communication what causes high scattering of load values. I use the node-red-contrib-modbus read node with the node-red-contrib-buffer-parser by Stephen McLaughlin to convert the Sunspec IEEE float values. Polling intervall is 1 sec what should not be such a big thing. For the moment, only a Ziehl EFR4001 IP and a Fronius snap inverter are connected.

The system does not have any Shelly hardware installed. Maybe this code is also used for other RS485 / Modbus RTU communication? The installation uses ABB meter model B23-113-100 what fits the need to connect by currenct transformers. The flow does not communicate with this meter

There are no Wifi and no Bluetooth devices connected. Radio polling could be stopped completely.

NR flow does not use any http get / rest APIs. Internal ethernet uses high responsive glas wired Gigabit switch, almost no other loads.

There is a connected USB Hub with several CAN interfaces using the “Geschwister Schneider” driver what comes within the kernel. They are intended for aggregation of more than 15 BMS without hub but for the moment this CAN interfaces are not in use.

Ah, nvm. That process-list extract showing the dbus-shelly-3em-inverter was posted by Ekkehard FlessaEktus, not by you.

However, as to your latest post, seeing load values of ~ 4 is about fine. Mind that in unix this just means the number of processes waiting to be executed or beeing executed on average, it gives no indication about the “heaviness” of each process.

So, a bit better indicator for load / system responsiveness is to look at the dbus-roundtrip time, as logged in vrm. That should stay reasonably low at a few miliseconds.

Just ask the ai helper for “dbus roundtrip time”, and it will graph that for you:

In my case, the poll intervall should be at 750ms (haven’t touched this in more than a year). And it is polling not one, but two Shelly 3 EM, one for the grid connection and the other for solar production from the old SMA inverter. The 3EM was way cheaper than adding RS485 to the inverter. The wifi network has very low load, and my system has been running with very little problems for a long time now. 3 months uptime tell me there’s no reboot necessary. The D-Bus graph shows the same picture: fluctuates all over the place, but always comes back down again. And what are even 160ms delay if the control loop is running every 1s and both the meters and the Multiplus 2 are slower than that? No realtime actions needed, system is good enough.

Stability is clearly improved with watchdog values inherited from @Ektus

root@einstein:~# uptime
 15:55:04 up 3 days,  5:24,  load average: 4.61, 3.44, 3.25

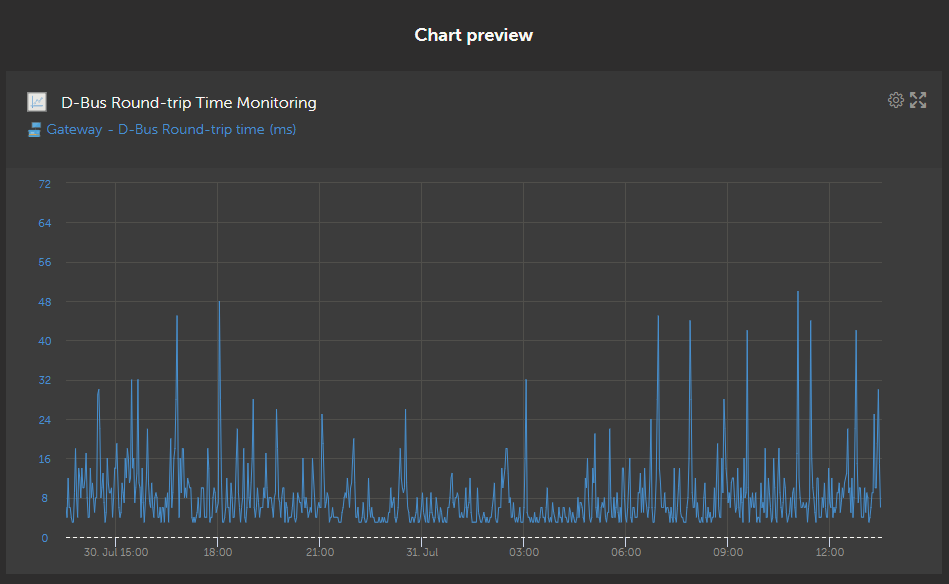
Here ist the diagram of my recent dbus cycle time. I setup the widget without ai manually. The average loads do not show any trace for unknown reasons. Over the night hours, the peaks seems to calm down, why I added other values for correlation.

As this morning was cloudy with rain, I disabled Node Red at 8:20 complety. This location is the 3rd peak from the right with about 50 msec height. At about 3pm another peak with about 85mS is recorded.

Assume all, NodeRed seems to increase occasional peaks only a little but not too much. They are typically around 100msec. With the default watchdog values I saw frequently peaks up to about 500msec probably caused by the reboot process itself. I am going to enable NodeRed again, possibly testing the current regulator with a cycle time down to 1 second for a faster response until the physical grid current limits.

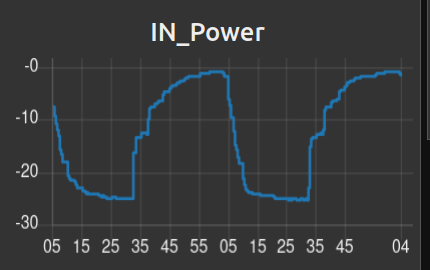
Edit: After changing the poll intervall of the Ziehl EFR @Modbus TCP down to 333 mSec, there was no visibile impact to the CPU load. Therefore I started to examine the “myths and legends of 400W/s”. Image shows shaking of grid by change of grid sepoint between 0,25 and 25kW every 30 seconds.

Next image is same but meassured by ABB meter->Modbus RTU->USB-dbus instead of Ziehl EFR-

Both diagrams are much faster than 400W/s. For both instruments I assumed a significant averaging of the values why I repeated the same experiment with current clamp and scope. The records were done with only one phase of current, no absolute power why I did not save any images from. What the scope shows are 2 seconds absolute delay from writing the value to dbus until anything happens. After this, current goes to end value inside 4 seconds what is more than 6kW/second. Assume the change of process value by any load instead the setpoint value, the regulator probably changes without any delay, at least if grid is offline. This behaviour needs to be examined in another experiment. The reason for 2 seconds delay is unknown. Its annoying if they are inside a external regulators loop what governs the ESS. Any case, they do not contribute anything to system stability. So far, there is no reason to make any NR flows cycle time or Modbus polling shorter for the moment.

Without any meassurements or instruments, the humming sound of the Multis torroid transformer is a good indicator on how the power increases at sudden loads.

In the meantime, the changes in watchdog setup can be considered as proven. System including NR flow now works for 30 days unattended.

root@einstein:/etc# uptime
 09:01:36 up 30 days, 13:42,  load average: 3.20, 3.32, 3.16
root@einstein:/etc# 

1 Like

This topic was automatically closed 14 days after the last reply. New replies are no longer allowed.