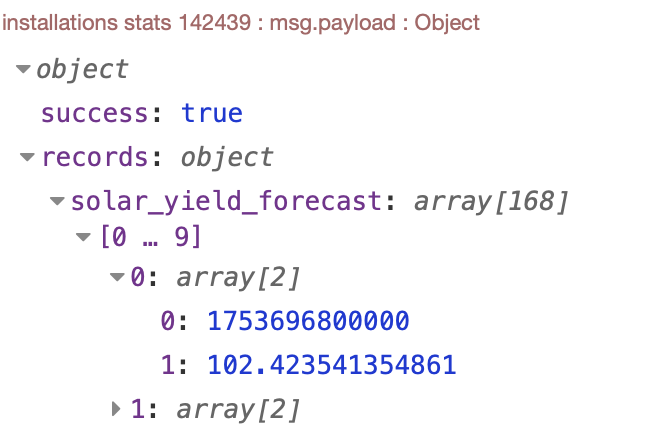
If you use the node config you did for VRM shown previously and connect it to this flow, it will format the data correctly and draw a bar chart.
[
    {
        "id": "0fa1146700efe238",
        "type": "function",
        "z": "9170653ac436c1aa",
        "name": "Chart PV",
        "func": "\nlet input = msg.payload.records.solar_yield_forecast;\nlet formattedArray = [];\n\n// Iterate through each element in the array\nfor (let item of input) {\n    let date = new Date(item[0]);\n    let dayName = date.toLocaleDateString('default', { weekday: 'long' }); // Get the weekday in the local language\n    let dayOfMonth = date.getDate(); // Get the day of the month\n\n    formattedArray.push({\n        day: `${dayName} ${dayOfMonth}`,  // Format the day as \"DayName DayOfMonth\"\n        yield: (item[1] / 1000).toFixed(1),\n        series: \"yield\"\n    });\n}\n\n// Return the formatted array as payload\nmsg.payload = formattedArray;\n\nreturn msg;\n",
        "outputs": 1,
        "timeout": 0,
        "noerr": 0,
        "initialize": "",
        "finalize": "",
        "libs": [],
        "x": 440,
        "y": 1000,
        "wires": [
            [
                "59b72fee48c13546",
                "5cd9f8cafabe2dde"
            ]
        ]
    },
    {
        "id": "59b72fee48c13546",
        "type": "ui-chart",
        "z": "9170653ac436c1aa",
        "group": "90a5c95cd3c30a40",
        "name": "VRM API forecast",
        "label": "VRM PV forecasted",
        "order": 6,
        "chartType": "bar",
        "category": "series",
        "categoryType": "property",
        "xAxisLabel": "Day",
        "xAxisProperty": "day",
        "xAxisPropertyType": "property",
        "xAxisType": "category",
        "xAxisFormat": "",
        "xAxisFormatType": "auto",
        "xmin": "",
        "xmax": "",
        "yAxisLabel": "kWh",
        "yAxisProperty": "yield",
        "yAxisPropertyType": "property",
        "ymin": "0",
        "ymax": "40",
        "bins": "",
        "action": "replace",
        "stackSeries": false,
        "pointShape": "circle",
        "pointRadius": "2",
        "showLegend": true,
        "removeOlder": "7",
        "removeOlderUnit": "86400",
        "removeOlderPoints": "",
        "colors": [
            "#1f77b4",
            "#aec7e8",
            "#ff7f0e",
            "#2ca02c",
            "#98df8a",
            "#d62728",
            "#ff9896",
            "#9467bd",
            "#c5b0d5"
        ],
        "textColor": [
            "#666666"
        ],
        "textColorDefault": true,
        "gridColor": [
            "#e5e5e5"
        ],
        "gridColorDefault": true,
        "width": "8",
        "height": "8",
        "className": "",
        "interpolation": "linear",
        "x": 730,
        "y": 1020,
        "wires": [
            []
        ]
    },
    {
        "id": "90a5c95cd3c30a40",
        "type": "ui-group",
        "name": "Charts",
        "page": "1f3f6aba836b135f",
        "width": "10",
        "height": "1",
        "order": 3,
        "showTitle": true,
        "className": "",
        "visible": "true",
        "disabled": "false",
        "groupType": "default"
    },
    {
        "id": "1f3f6aba836b135f",
        "type": "ui-page",
        "name": "Home",
        "ui": "20a0d5584e491036",
        "path": "/page1",
        "icon": "Home",
        "layout": "grid",
        "theme": "199c1371468ee29c",
        "order": 1,
        "className": "",
        "visible": true,
        "disabled": false
    },
    {
        "id": "20a0d5584e491036",
        "type": "ui-base",
        "name": "Home",
        "path": "/dashboard",
        "includeClientData": true,
        "acceptsClientConfig": [
            "ui-notification",
            "ui-control"
        ],
        "showPathInSidebar": false
    },
    {
        "id": "199c1371468ee29c",
        "type": "ui-theme",
        "name": "Default",
        "colors": {
            "surface": "#ffffff",
            "primary": "#0094ce",
            "bgPage": "#eeeeee",
            "groupBg": "#ffffff",
            "groupOutline": "#cccccc"
        },
        "sizes": {
            "pagePadding": "12px",
            "groupGap": "12px",
            "groupBorderRadius": "4px",
            "widgetGap": "12px"
        }
    }
]
Looks like so: