Has anybody made a function to convert the vrm_pv_charger_yield payloads from a VRM API node for a chart table in the node red Dashboard?
Would appreciate a share, a pointer, a flow hint or an example.
Thanks!
So I use dashboard 2.0 which is prettier but works differently.
This is the js from a function that formats a message for the chart.
It pulls one PV variable from a flow variable and takes the other from the msg payload.
It creates a new message array with two objects, one for each series.
var pv = msg.payload;
var pvgenerated = flow.get("yield");
msg.payload = {};
msg = { "payload": [{
    "series" : "remaining PV",
    "y" : pv },
    {"series" : "Yield" ,
    "y" : pvgenerated
}]
}
return msg;
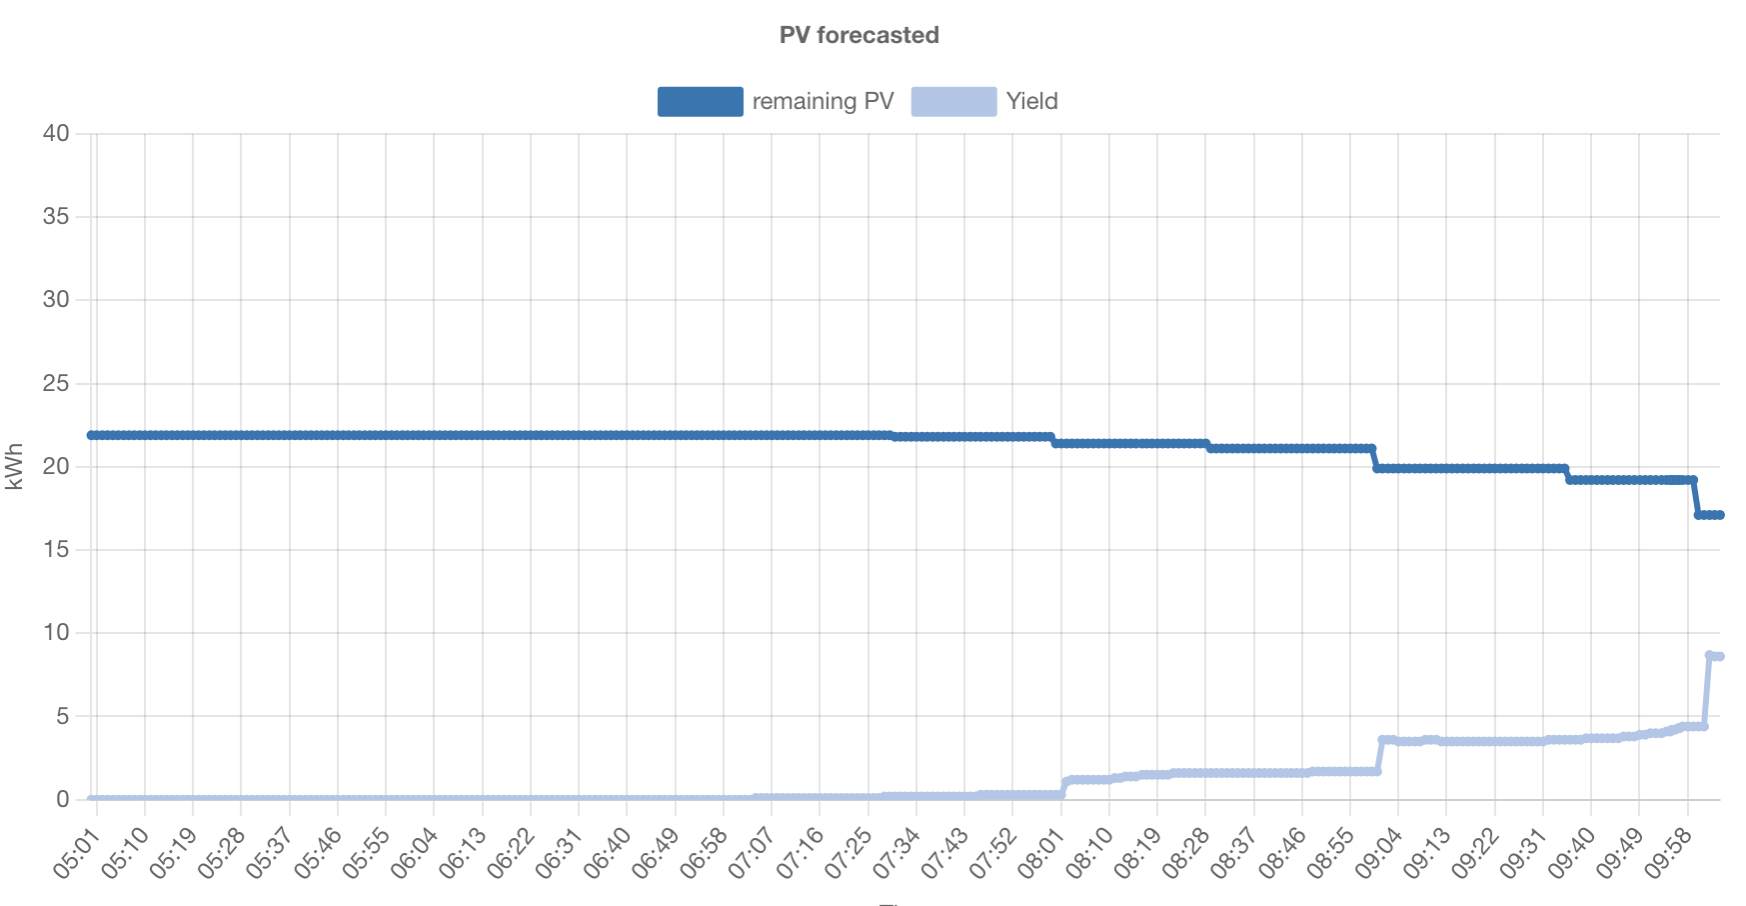
The chart is then configured to use the key “series” for the series and the key “y” for the y axis.
X is set to timescale.
And it results in something like this:
1 Like
Thanks @nickdb !
This looks like exactly what I need.
Also using V2 FWIW.
A few questions when/if you have a minute?
Do we wire the function node directly to the Victron API node?
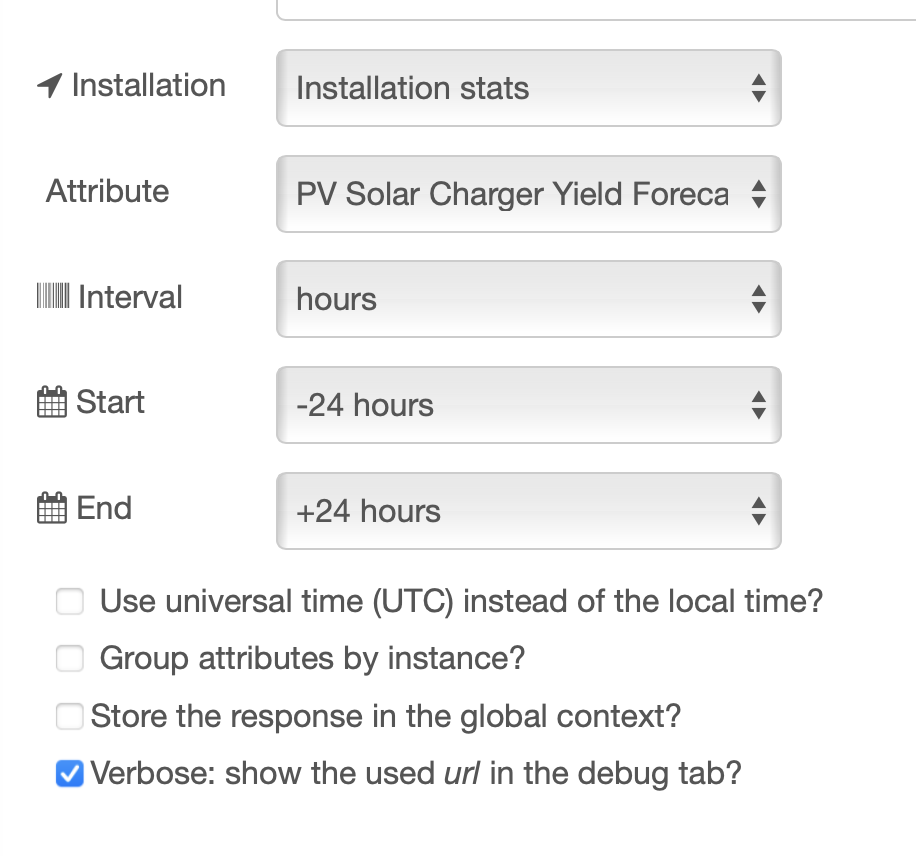
What are the intended settings:
-
in the Victron API node here:
-
in the X-Axis limit in the chart?
I get the topics in the legend but no data in the chart so far.
The VRM api node can be a little bit unfriendly.
In theory that sends you the hourly forecast over a 48 hour period, 24 hours on either side of the current time.
So you will get 48 records back and a total at the bottom of the message.
I have had better luck just making an api call and not using the vrm node.
You should use debug nodes at the output of the function, and other nodes, to confirm you are getting the right data out. Also be sure you have set the axis to use “key” and the correct object.
Either you are not sending data or it is being sent/processed incorrectly.
Also be sure your VRM node is retrieving the right data.
Debug nodes are your friend to see where in the flow it is breaking.
1 Like
Ok. Thanks for that!
I do use debug notes all the time but this is maybe a little above my skillset to figure out.
Will do some trial and error tweaks over the next few days and see where that
lands. Thanks again.
I do also have a working old flow that connects directly to Solcast and gives me three days of forecasts as daily sums that then count down as the day goes. It works great and I guess I will continue to use that for now. As I understand it Solcast is what Victron are using now and that it will be updated to do a few more days of forecasts at some point. Will want that when it arrives.
I really need just that: daily sums as textfields. VRM gives us the deeper stuff and nice graphs.
But we shall see ![]()
If you get stuck, come back and ask.
Good luck.
1 Like
A post was split to a new topic: Nodered using VRM PV forecasts
This topic was automatically closed 14 days after the last reply. New replies are no longer allowed.