I thought I’d play around with adding my PV power into VRM dashboard through Node Red given the new features of v3.6, but Im struggling to get things working nicely…
I guess the net effect on me from getting it working is minimal/cosmetic so not super important but a niggle never the less, although secretly I was hoping it might improve the DESS forecasts…
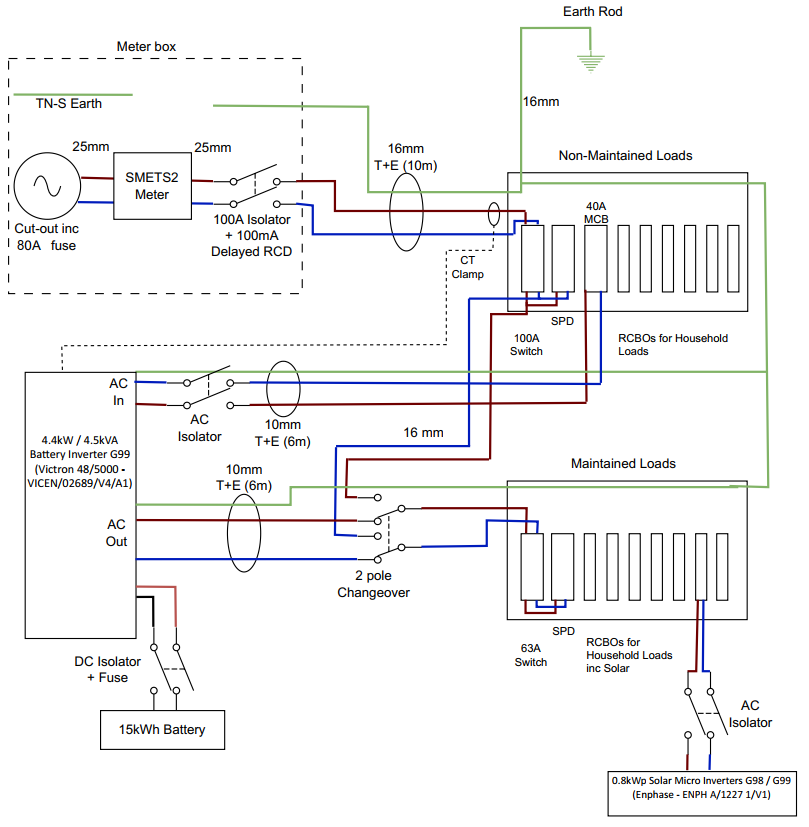
My PV is connected to AC Out 1, and the Multiplus 2 sees the net household power usage with a CT on grid tails. It does an OK job of minimising grid draw when it wants to (except for some random errors that I need to understand better when it draws from the grid at peak times…). I thought it would be nice for the AC Loads to be sensible in the dashboard (currently the AC Loads appear as 0 whenever PV is generating more than house load)
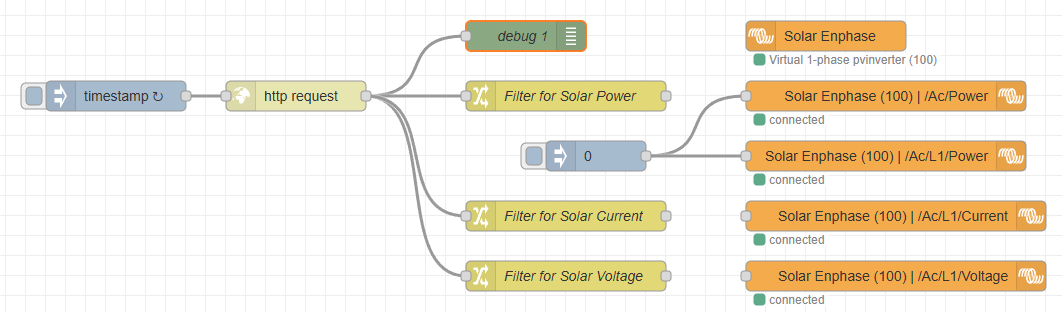
After adding my PV generation, through Node Red web requests (requests sent to an Iotawatt that has 12 CTs on various circuits) I find that the Multiplus no longer minimises grid draw instead it quite regularly ends up drawing from the grid when it shouldnt. I assume this is because the Multiplus is doing a calculation on PV generation which I cant understand. Does anybody have any knowledge about what happens in this case? (Ive currently got everything set to 0 in node red due to these problems, but initially the flows were connected with straight lines from filter to Custom Control)
And system diagram as below: