From tomorrow onwards, all data we receive from the pricing data providers related to Europe (Entseo e and others) is in 15 minute intervals.
This change is part of a large European wide change related to the energy market, with the direction being that pricing and trading is per 15 minute intervals. No longer hourly.
For the Victron VRM Portal and Dynamic ESS, pricing per 15 minutes is nothing new. For some countries this had been already the case for a long time.
However, especially with the European countries in mind, a change was deployed just now:
The system will calculate hourly prices, by averaging the available 15 minute prices.
As a result, the system has both 60 minute pricing as well as more granular 15 minute pricing for all (European) systems.
What to do for your system or the systems of your customers:
in case your energy provider still works with hourly prices, leave the setting to hourly
in case your energy provider works with 15 minute prices, change the setting to 15 minute.
That 60 vs 15 minute setting is found on the VRM Portal → Settings → DESS.
Note that your 60/15 setting won’t be actively changed, as -for now- it still differs per Energy provider.
Developer API notes
Two notes for more technical use cases, ie. developers using the VRM API either directly or via Node-RED:
The type of pricing provided by the API depends on above mentioned setting.
In case you are using the Victron Node-RED DESS implementation (which is planned to be phased out), then you have to leave your setting to 60 minute intervals. This is required because that Node-RED implementation doesn’t work with 15 minutes.
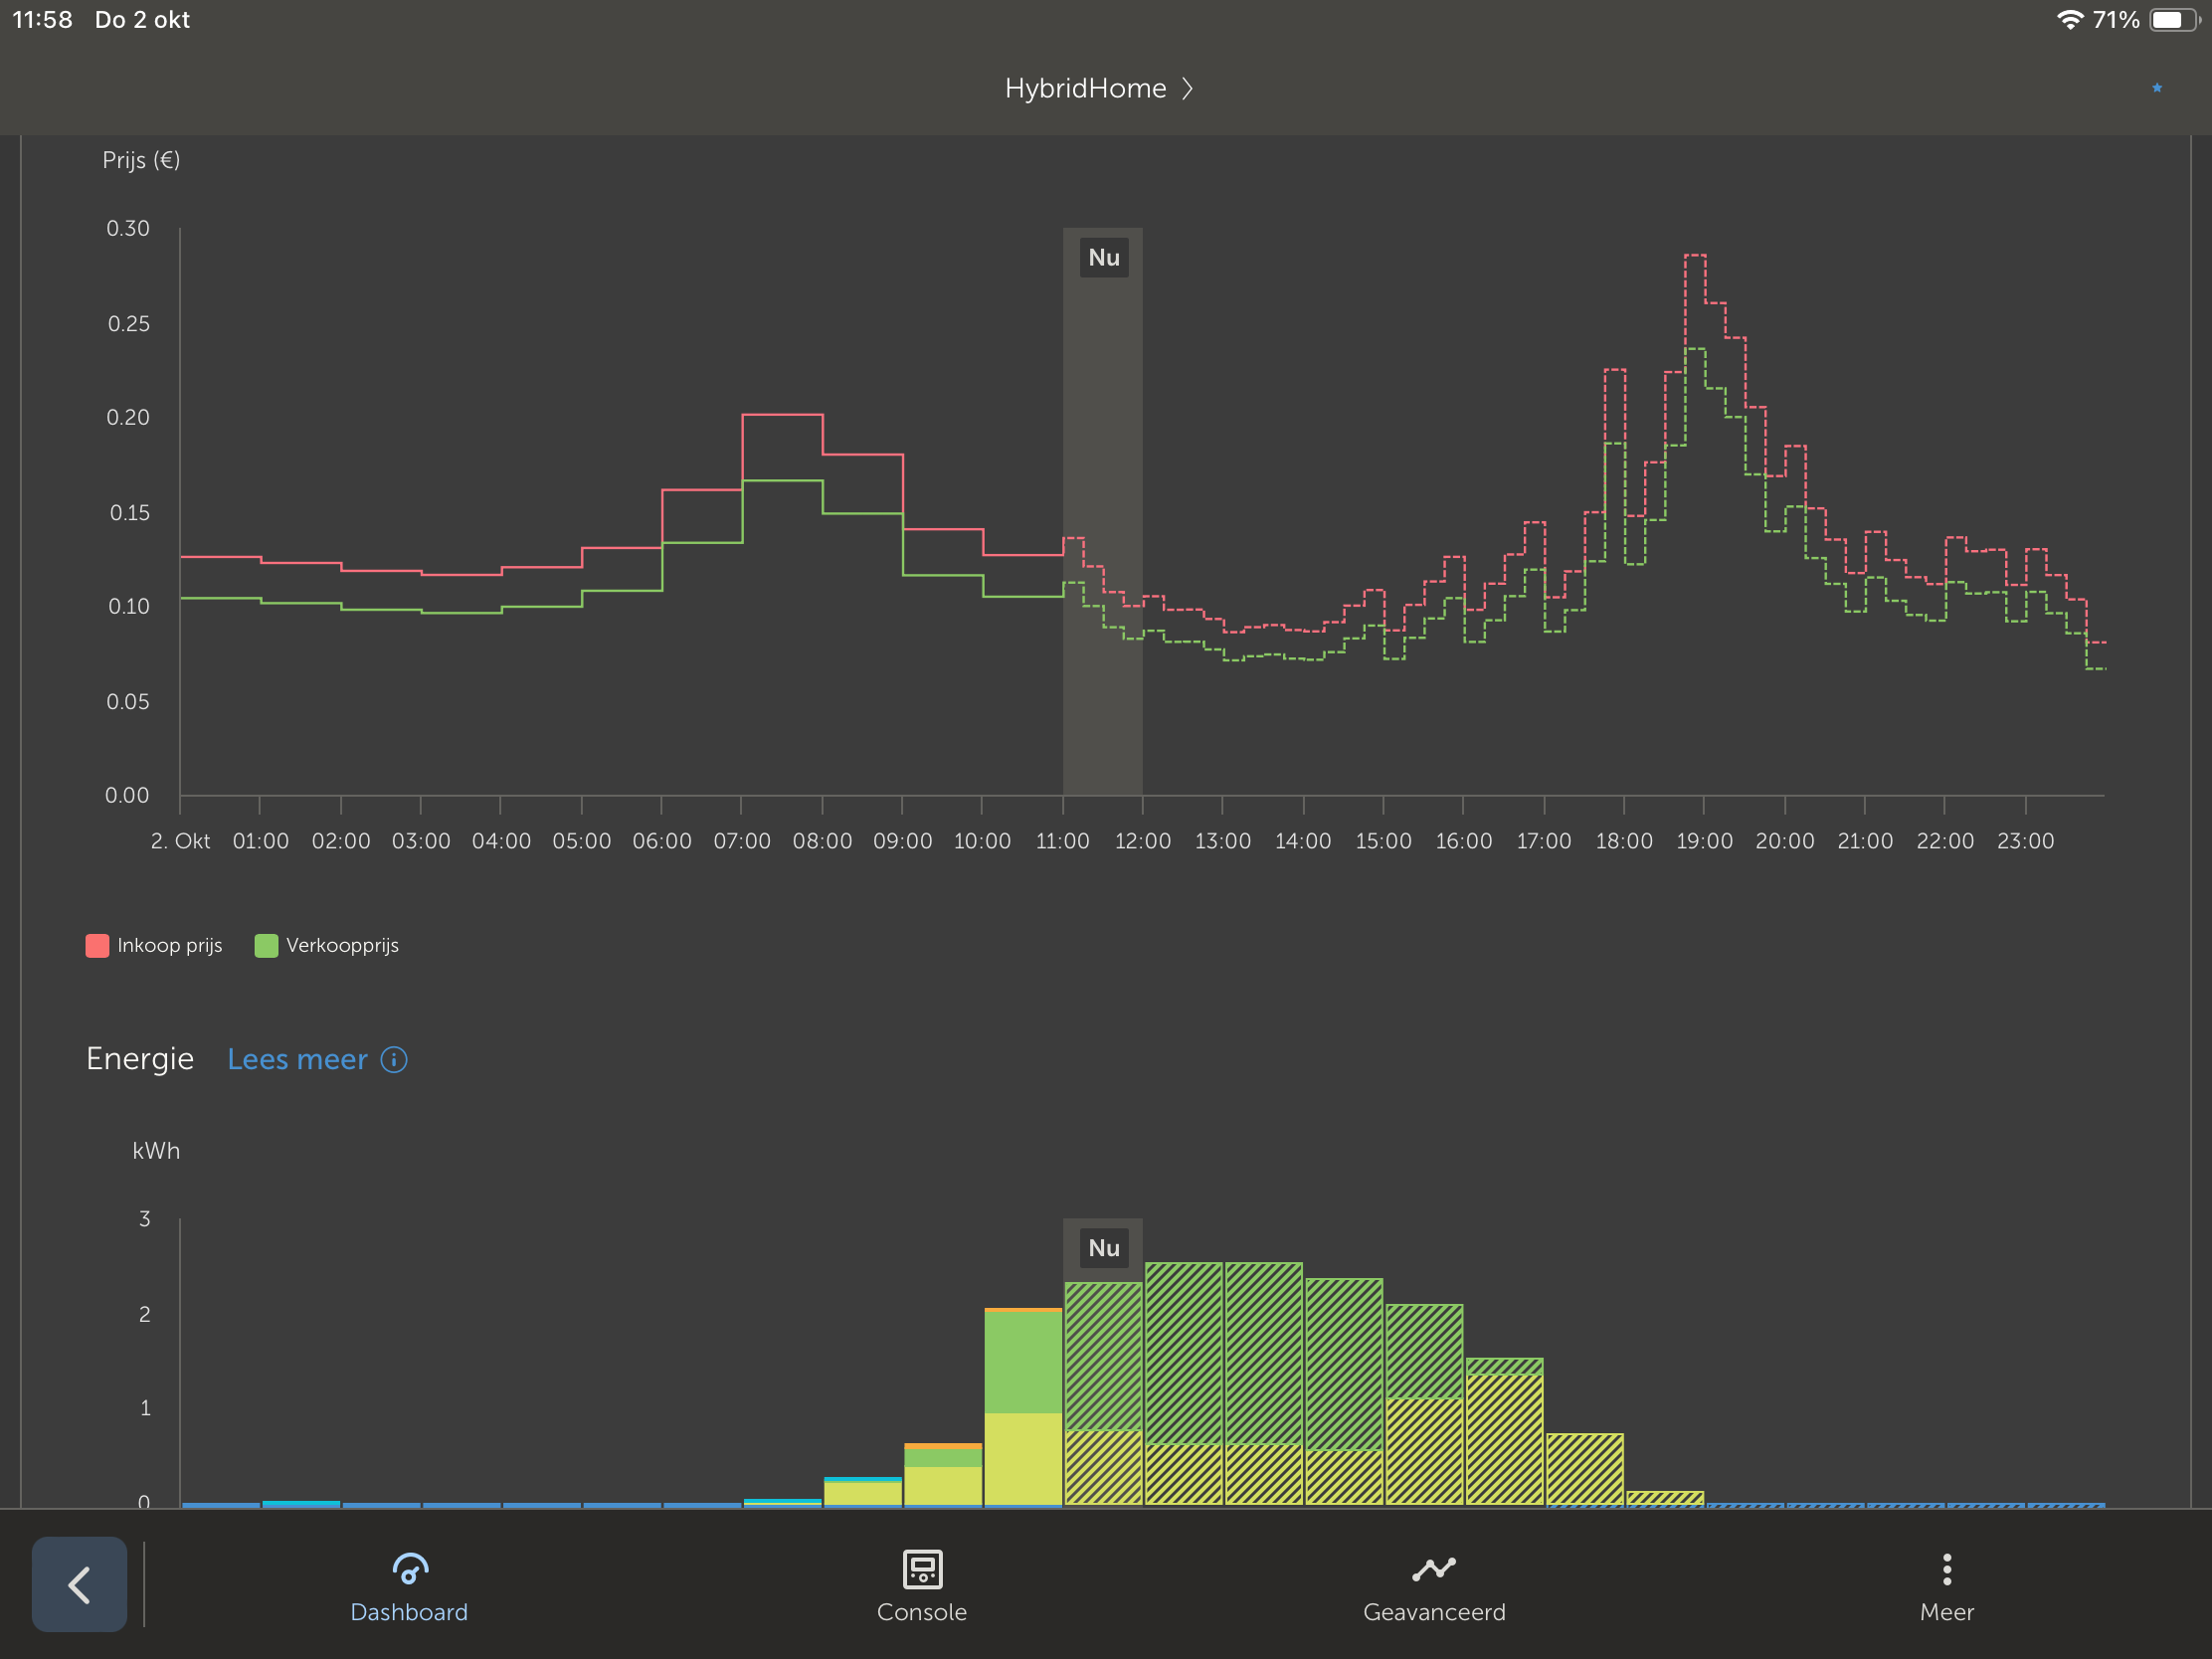
If you are unsure if your energy provider will invoice based on hourly or 15 min prices: check the app of the energy provider. If their prices for tomorrow are in hours still, likely they did not implement 15 min price changes (yet).
Hi Barbara!
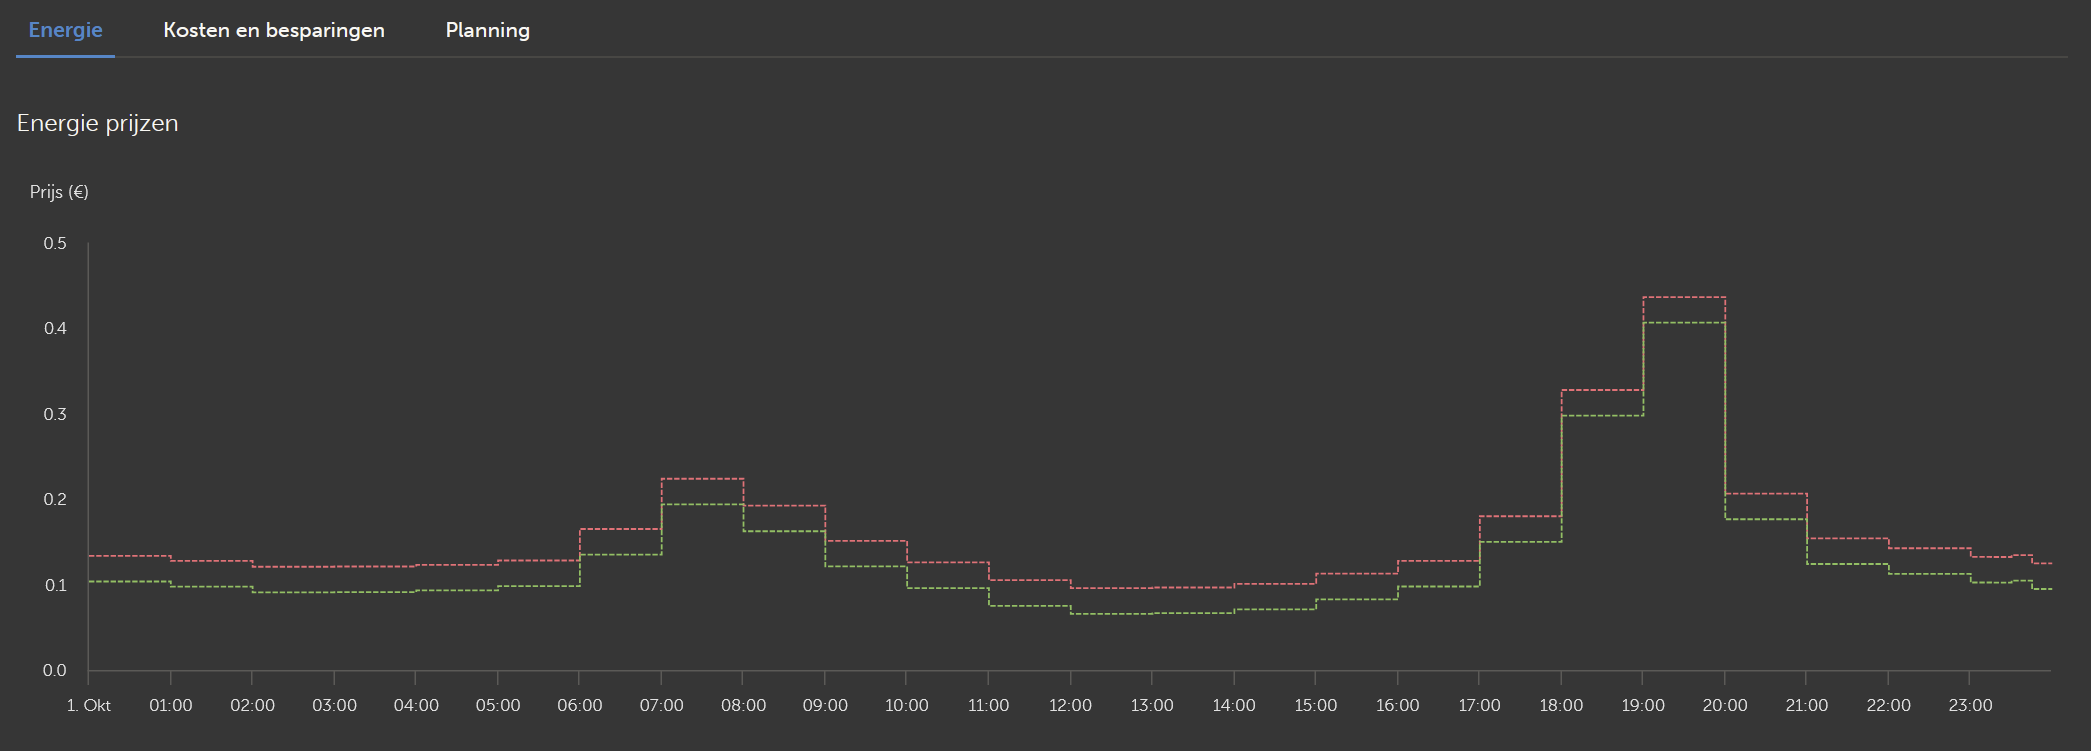
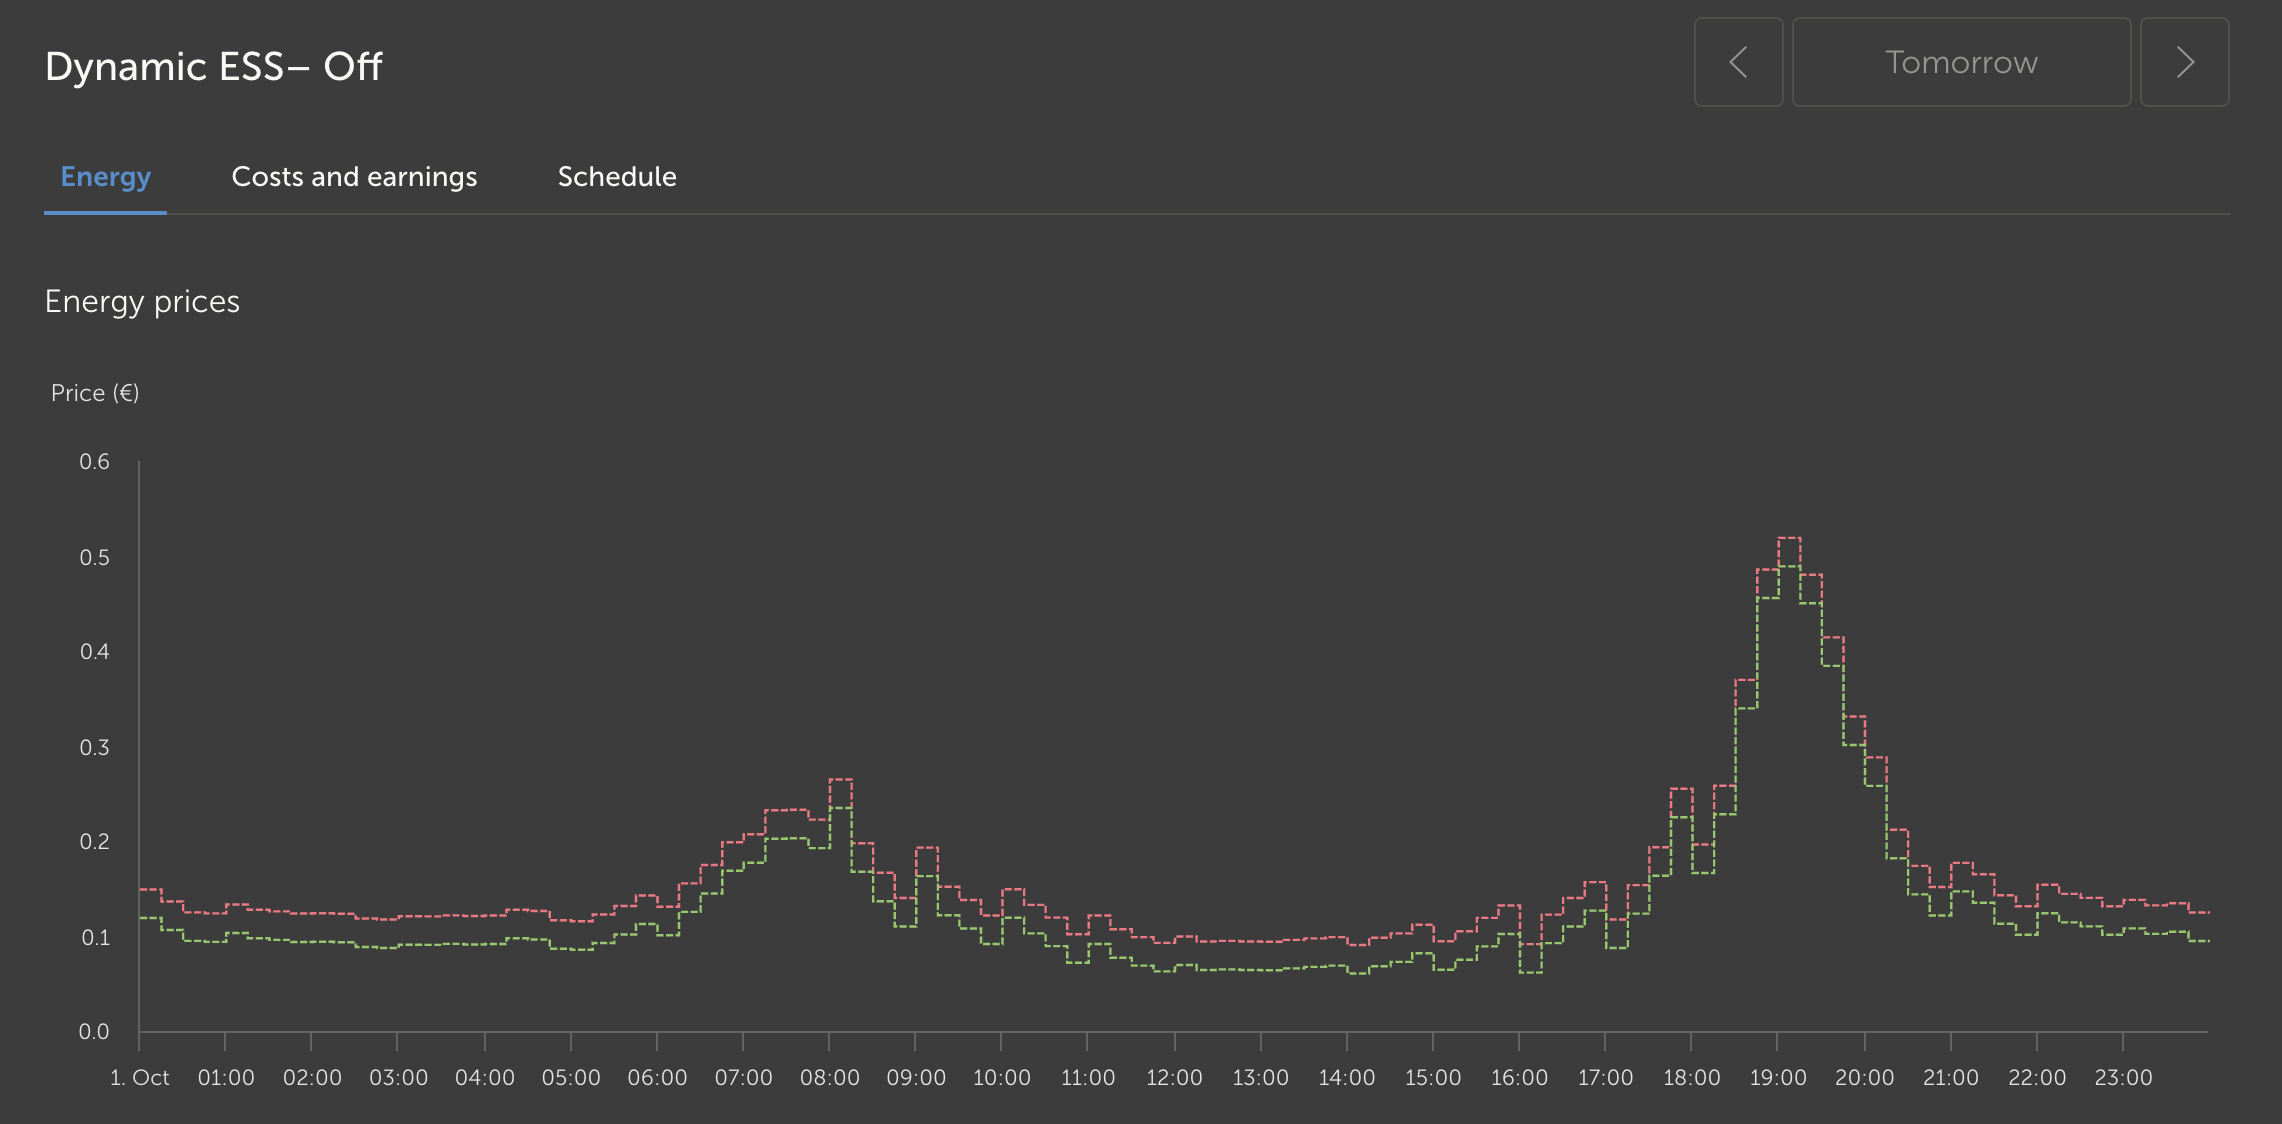
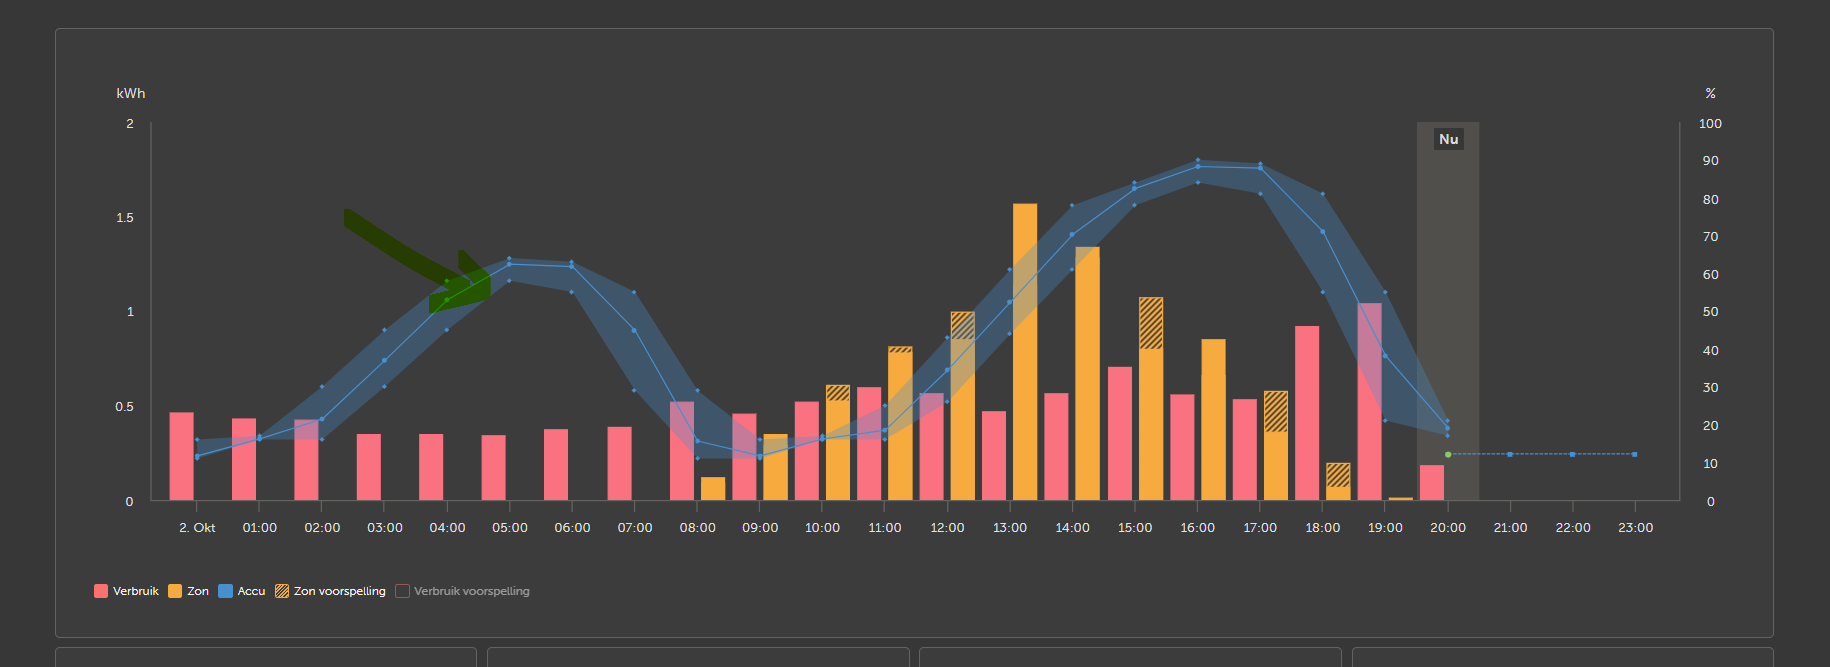
As a Tibber user in the Netherlands, my prices will go to 15min tomorrow, so I have changed my settings to 15 minutes. However when I look at the energy prices for tomorrow, I still see the 60 min averages instead of the 15 min:
Yes, the schedule will for now still show per hour, in experience with other countries that implemented 15 minute prices already, the energy graph became very difficult to read in 15 min bars.
I can imagine that it would be incredibly difficult to read, however.. Does this mean the actual schedule is still in 1 hour blocks, or it is actually divided into 15min blocks (but without the graphics in 15min). What I mean by this, if the price is high for 15 minutes, but low again the next 15 minutes, does DESS adapt to this, or does it only take the 60min average to work with.
That seems quite counter intuitive to me, the graphs are a tool to visualize the data. If that tool is hard to read the solution should be to improve the visualization, not to hide the data.
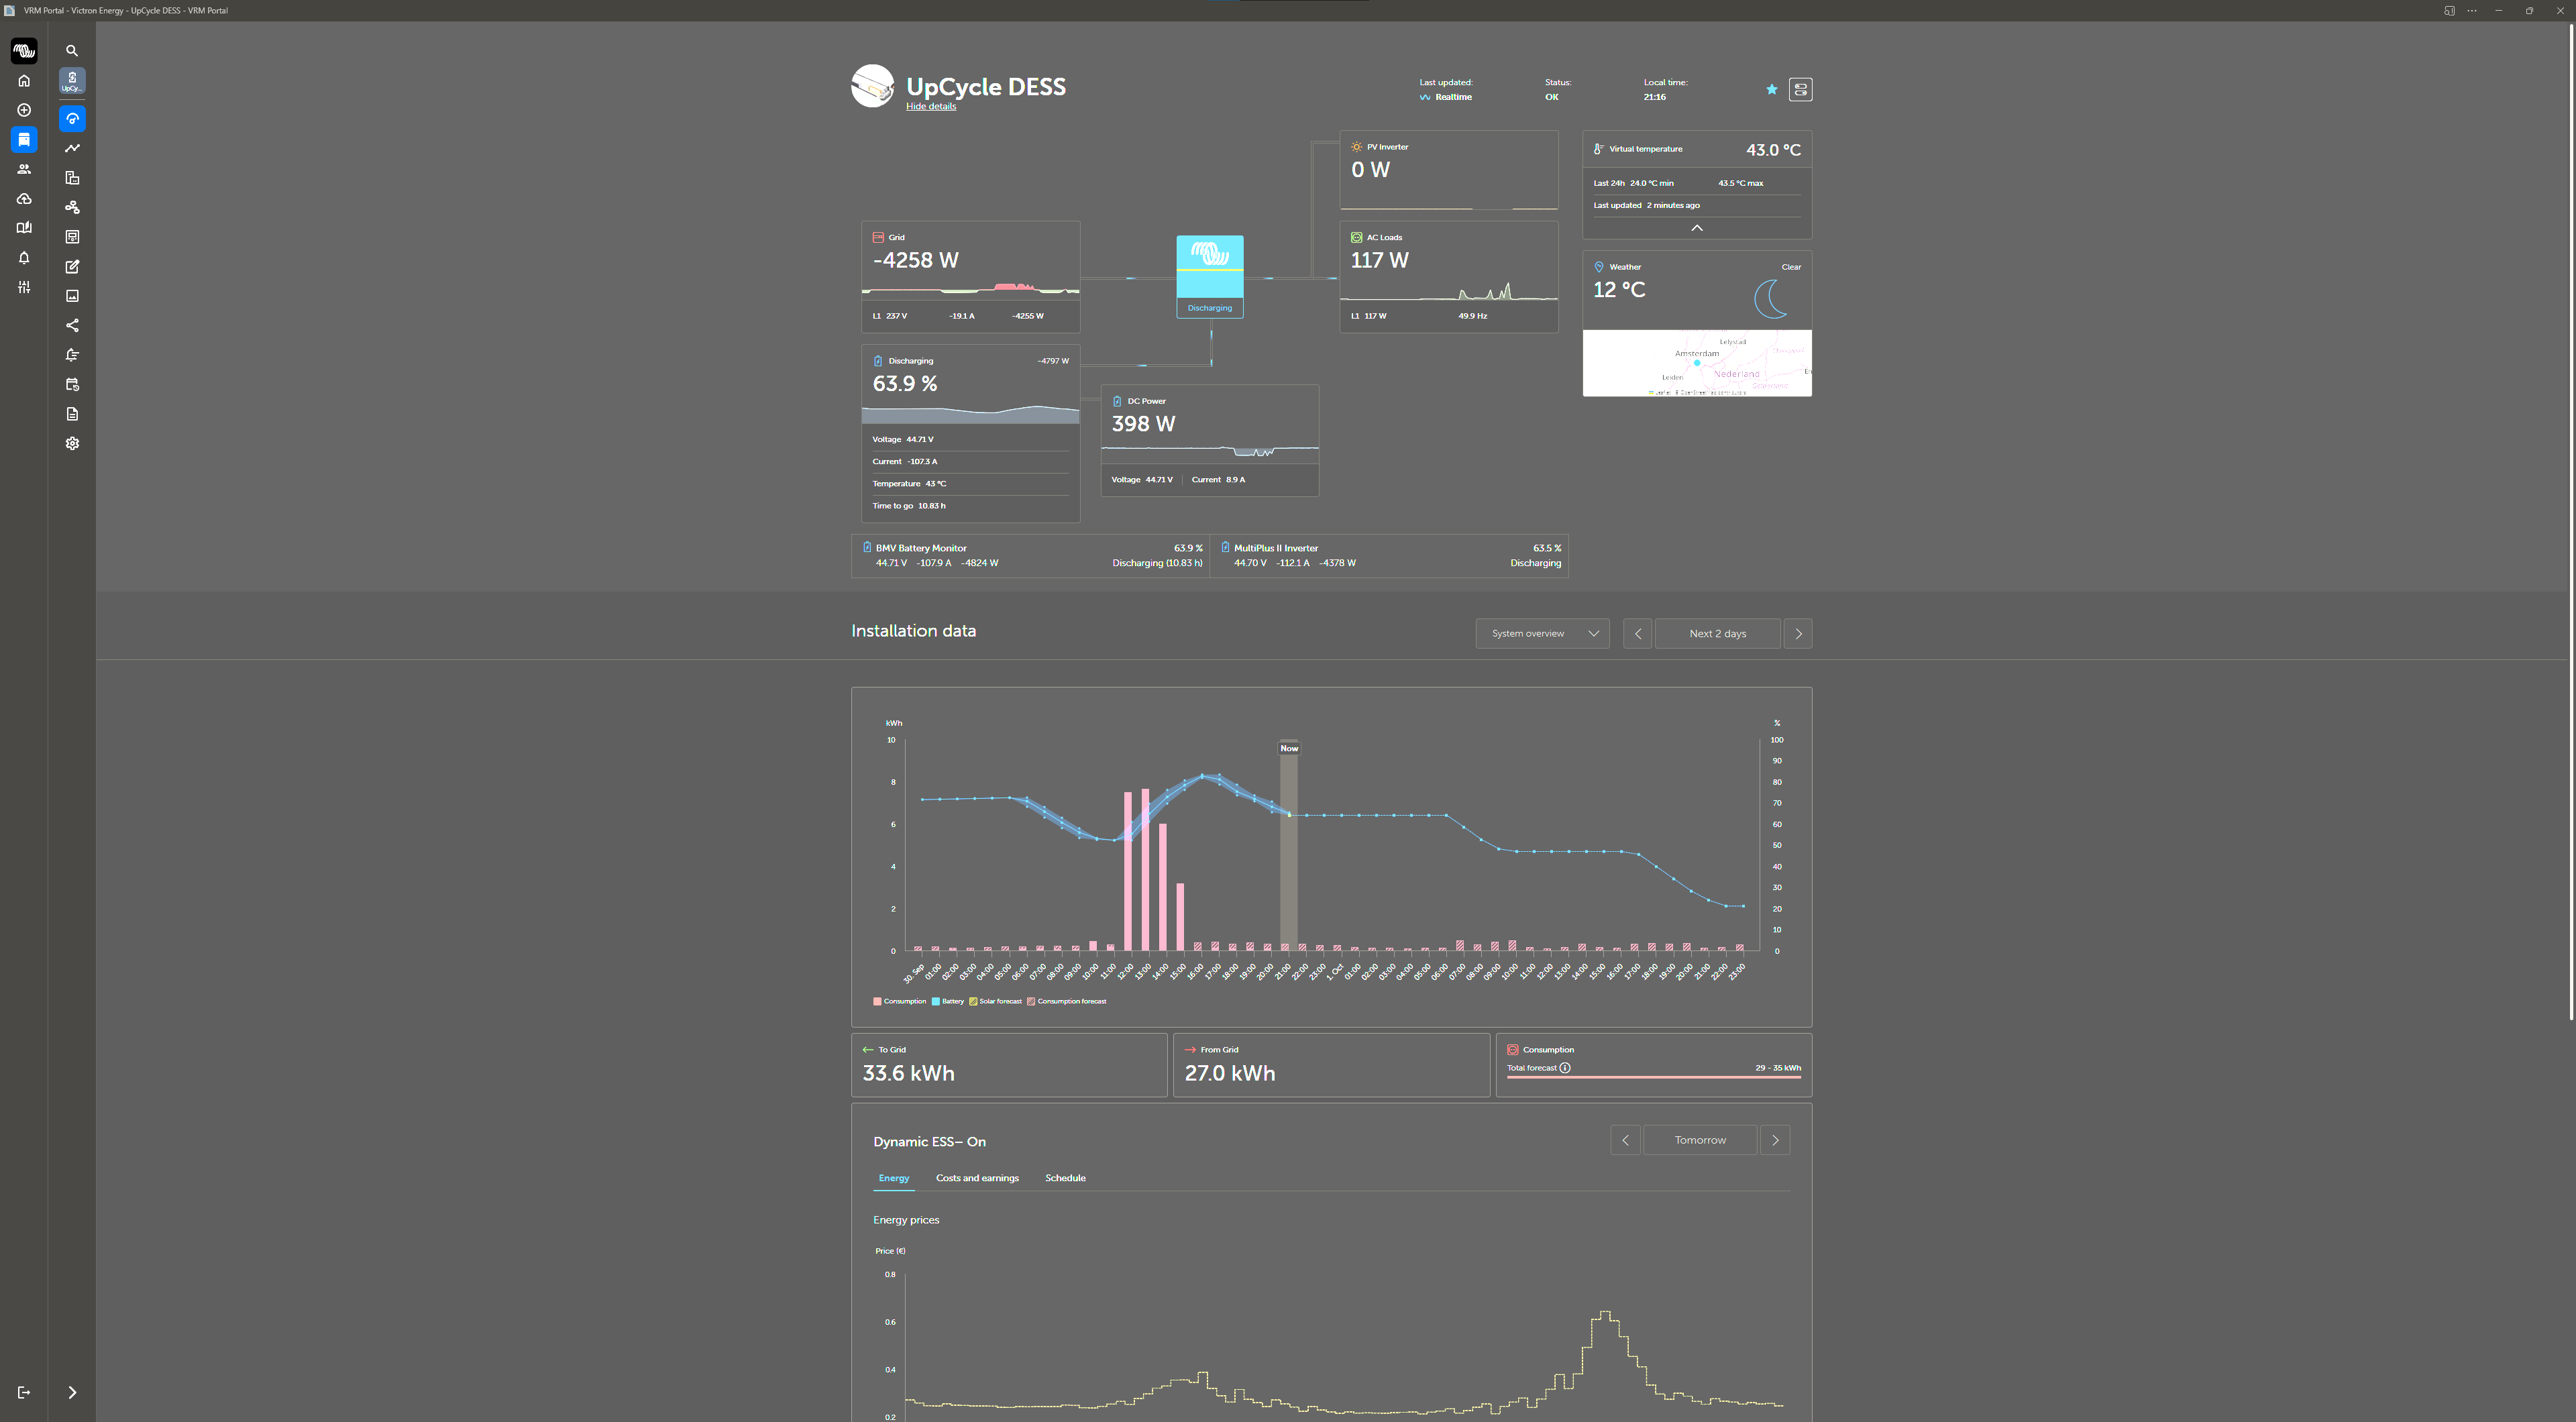
There are pros and cons here. From a user perspective, I don’t mind that the energy flow and it’s forecast staying hourly. Having that per 15 minutes - 4 times more bars - would have several disadvantages I’d say.
It becomes impossible to quickly “hover” 4 bars and do some rough maths - you would need to go through 16 bars then.
I’m very used to a “hourly yield” my system is capable off. Having that split into 4 chunks would obfuscate that and not “on one glance” tell me, how sunny it will be.
With a battery-rate setting of like 14 kW, seeing a “14 kWh charge bar” very quickly and intuitively tells me, the battery will be operating at “maximum” in that hour.
But ofc. if a “7 kWh charge” is expected, I would not know in which parts of the hour that is scheduled to happen.
Probably the best could be to not “tie” that appearance to the price model, but just add a setting to switch between hourly and quarter-hourly bars, with a “memory” function for desktop and phone settings. (15 minutes on a phone will just be dashes I fear)
What about the solar and consumption forecasts? I use these in Node-RED. Will these continue to be delivered in hourly arrays, or as 15-minute arrays in quadruple length?
I’m not involved with node red - but yeah, there is quite a chain of things to consider, when changing these figures to 15min as well. (Depending on how they are stored, not aware of that either)
I personally would really love to see the actual representation in 15 minutes. Like @UpCycleElectric says, there is lots of screen space wasted.
I do not have so much of a problem with the bars itself being hourly, but the graph of the charge state could still represent the 15 minute intervals.
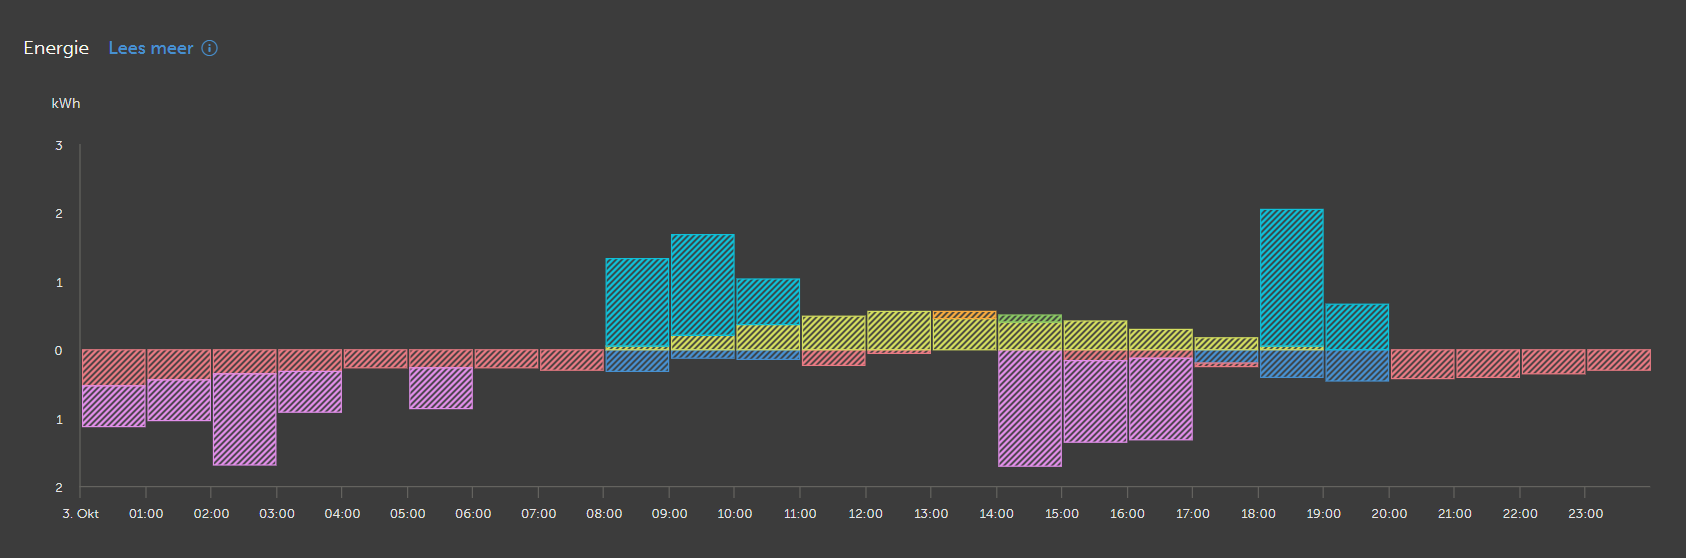
The other thing i would prefer in 15 min is the energy bars, i think this would be far less of an isue to represent in 15 min intervals because unline the top graph it only has one bar per hour (so no parrellel bars in same hour block).: