Hey @Ardano , we started training a forecasting model on heatpumps. Unfortunately, not many energy meters in VRM are labeled a heatpump, so because of this lack of data, the heatpump forecast does not outperform the generic consumption forecast.
Hopefully that will change when there are more devices the model can learn from.
I can understand why, i installed a victron VM-3P75CT to do some testing and using it for a heat pump did not appear to do anything. Doesn’t show in VRM dashboard, doesn’t show in widgets, doesn’t show in remote console overview.
Knowing it will be used to train a forecast model is great news and i will leave the meter connected to the heat pump for now!
If you want more meters set up for heat pumps i suggest either adding more functionality for them (easier said than done) or make people aware the meter is being used to train a model, for example in the VRM release notes.
Hi @Barbara - that’s good to hear! On the EV charger forecast, I added a VM3 meter a couple weeks back to measure the charger. The forecast is still quite weird for two reasons:
We only charge 3-5 times a month (on random days).
Our EV charger is ‘managed’ by our utility, so each charge sessions is broken up into multiple segments throughout the day / night (during favorable for grid conditions). These sessions look pretty random throughout the daytime, but a bulk happens overnight.
The combination of these two means the charges are quite random / unpredictable.
I was hoping that if that VRM sees a charge at 2am on Monday, and no charge the following Monday at 2am, then an EV charge would not be forecasted for the next coming Monday. Though we are still seeing ‘spikes’ in the consumption forecast.
Should we continue to wait a few more weeks, or will this behavior persist? If so, would it be possible to add an option to exclude EV chargers from the forecast?
I checked this also, you are right that the forecast is shifted one hour but it is still in sync with the real consumption. So this issue is different from the initial issue. Everthing is one hour shifted. I think it has to do with the wintertime
So, after one more week I am sure that it is the same issue as it was before.
Consumption forecast is again an hour earlier.
Dear @Barbara,
I will be very appreciated if you check my installation, because I am sure, I am not only person who has the same issue.
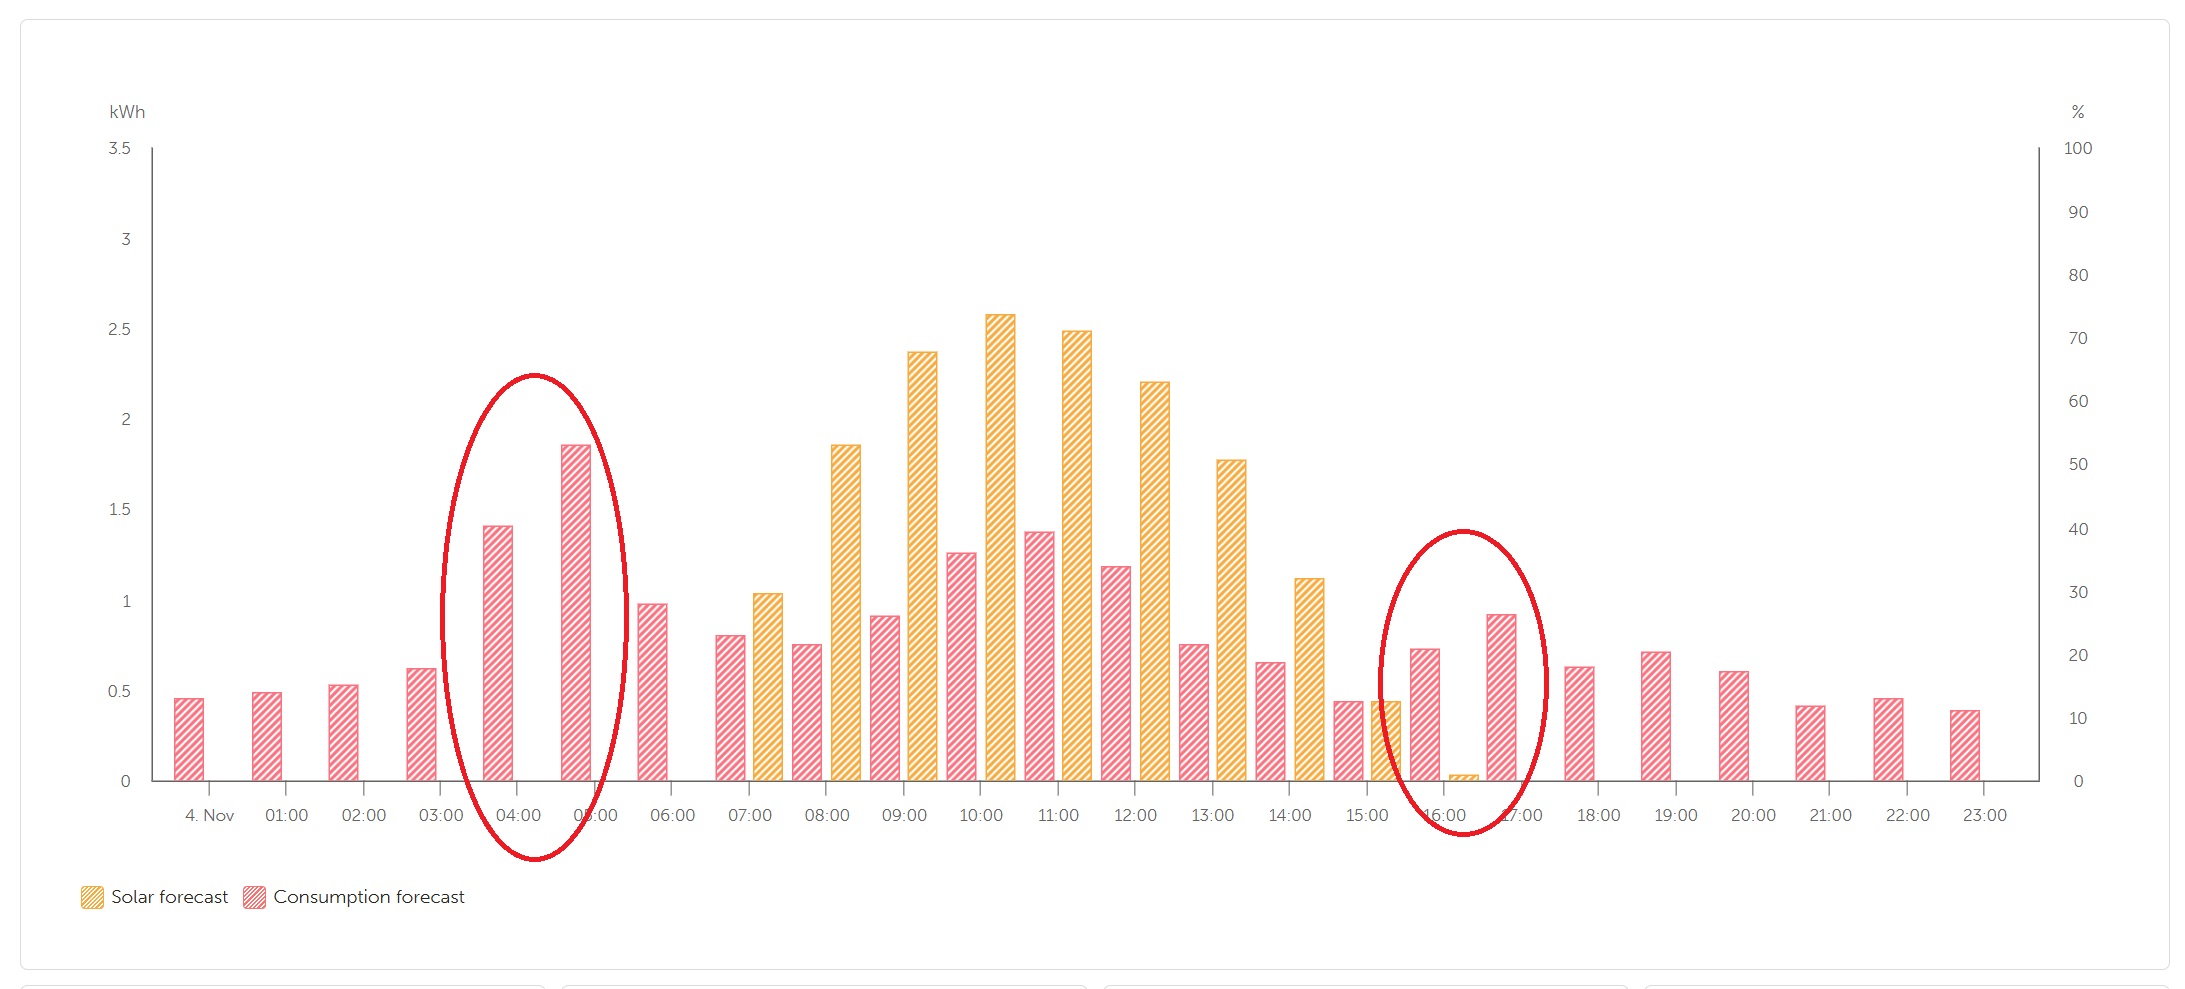
Please, take a glance at the picture - marked peaks, by fact, have to be an hour later.
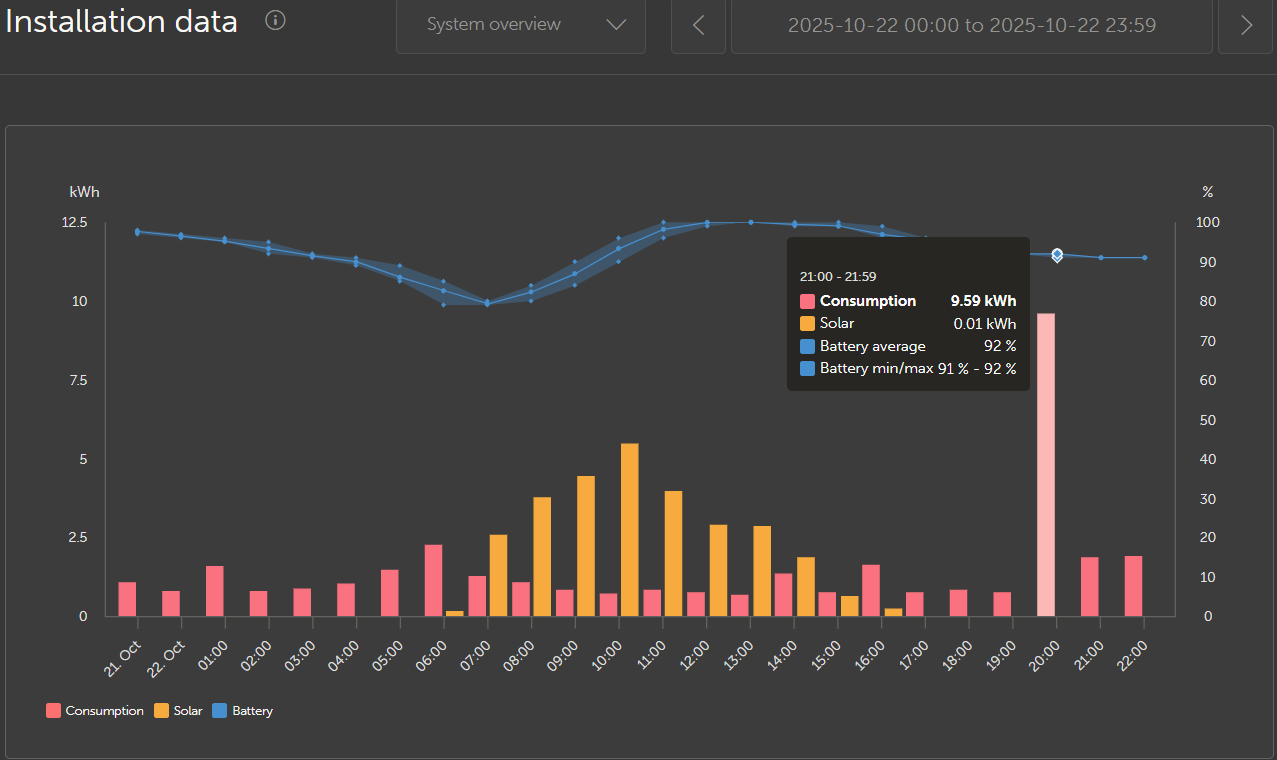
I think you may be right, but I’m also thinking this will correct itself after a few weeks. Our DST ended this past weekend, and looking back at the historical consumption before DST ended, I see the figures shifted by 1 hour on the charts. Notice the x-axis shows 20:00, but the hover-over shows 21:00