Battery/System efficiency only 70%?

Ok, here is my scenario:

Totally Off Grid

AC loads only

1 x Odipie 100A Battery
. . . in parallel with

1 x 304A Self-built Battery (with excellent tested cells max 2mA discrepancy in operation on Seplos 200 10E)

2 x 250/100 Victron MPPTs (1 per group of strings)

2 x Multiplus II 5000 in parallel

Average battery temp 29ºC (during charging hours)

Average MPPT temp 29ºC (during charging hours)

62/63% seems to be consistent even on a monthly basis

You probably should use empiric values to determine the efficency not rely on momentary measurements. At the end, it doesn’t matter if you “compute” some theoretical 80-90% Efficiency but the actual values just workout to something like 70%.

  • Take the Value (Grid-Usage Graph yearly) “To Battery” per month
  • Take the Value (Consumption Graph yearly) “From Battery” per month
  • Create a Excel-Evaluation for it.

There may be “slight” offsets, because obviously power that is causing “To Battery” on the 31st would correspond to “From Battery” on the 1st of next month. (But when looking across all months, that will cancel out)

here’s an example for my figures since I use the system (first month probably not representative):

image

Recently I lowered the CVL, which seems to cause much shorter phases, where the battery is consuming 300-500 watts while sitting at 100%. (I assume that is balancing, and cranking up the voltage to 53.4V+ causes a lot of energy beeing wasted, when 90% of cells are enabling their bypass-resistor during the balancing process)

Also, I have ~ 10 Watts of DC-Loads directly connected to the bus bar. These sum up to ~ 7.2 kWh taken from the battery per month that are reflected in “to battery” but not in “from battery” figures.

1 Like

This is correct. I have a constant DC load of 25 Watt. Occasionally up to 60 Watt. They are meassured by a 500Amp smartshunt very accurate. For unknown reaons this DC load is not displayed by the dashbaord as soon as there is a grid counter.

This is apparently, because the Option “Use External Meter” affects both: AC Load-Measuring and DC Load-Measuring.

So, when selecting “Use External Meter”, you would need to setup a Meter for the DC Loads as well and set the Meter-Type (in cerbo) to “DC Meter”.

I’m currently working on a “MQTT2DCMeter” Plugin, eventually get that working, so own metering can be used to simulate an official supported DC-Meter. (Not sure If I will succeed, documentation on that is kinda thin)

Yet, I read somewhere that DC-Load values are just a display thing and do not influence any calculation and therefore Stats / accumulated values I assume. (May be untrue, when properly metered)

Settings->SystemSetup->HasDCLoads ist enabled. Smartshunt is displayed in the device list with correct values. This is not true for the graphical dashboard only.

Screenshot from 2024-09-12 12-56-41

Do you have the Option to configure that shunt as “meter of type DC System” as outlined here?

Thanks for asking again. To be honest, I cannot find the menu location on where to setup the shunt as a energy meter of type DC system. Attached are the available setups for my SmartShunt as found in the device list (Cerbo FW 3.41). Its also NOT in Settings->EnergyMeters where intuitive users would probably expect. Unlike my eHZ18 grid meter connected by ModbusRTU, there is no Setup menue for meter role beside the displayed values.

Screenshot from 2024-09-12 14-04-05

The values displayed in the device list are roughly ok. The found resolution is 0,1 Amp for this 500 Amp Smartshunt. This equals a 16 bit AD converter to cover both directions of charge and discharge. On the other hand, this resolution limit is approx. 5 Watts. In comparison, we are looking for the missing 10% inside a 30kVA system.

@Janvi that Topic may be better over here:

last post of JohnC also said, he could only set the type DC Meter through bluetooth, not through the UI.

@JohnC
Do you know if the power consumed by the GX, multi, chargers and other battery-connected equipment is taken into account in the figures? Would an internal battery BMS capture them? What is the best alternative way to capture them
What I’m getting at is a situation where you have no DC loads, except, of course, Victron gear.

In the meantime I stumbled about a Ve-Direct2USB cable in my drawer (dont have BT/mobile). After connecting the Smartshunt to VeConnect I can confirm the setup for DC counter. DC Counter shows about 150kWh what is again not the 10% efficiency we are searching for. Anyway, it would be nice to see the counter values in dashboard/vrm for both, AC and DC counters.

DC load increased to 120Watt while connecting the smart shunt. This are additional 20 Watt for the windows PC to run VeConnect and 2x40W LED panels to illuminate the inverter room.

My remaining 20 Watt are not representative for the Cerbo consumption as I also run a W10 PC (most time standby mode) and a USB HUB directly.

@Fideri
As far as I can tell they’re not included in GX or VRM calcs. And I doubt even if a means could be devised that it would be very accurate anyway, as a lot of estimates would need to made.
There’s a few little things need tidying up before then anyway, like mppt output on Connect is reported on panels, where VRM is on the battery side. I’ve reported this. And also that DC Load isn’t used by the GX interface to Pylontech, and that causes the Pylons to cycle between 99 and 100% over a wide V range.

Hi guys,

I believe, that the main misconception (mistake) here is that you take that particular VRM report (fields Battery → Charge kWh and Discharge kWh) as a source of information, without deep understanding, how those values are computed. These values may reflect some assumptions, simplifications, and imprecisions… we can not even rule out a possible bug (or imperfection) in VRM. This is something that also @JohnC has mentioned…

You also need to strictly separate, if you are talking about the efficiency of only the Pylontech batteries (or any other brand), OR about the efficiency of the whole system.

If you want to measure the efficiency of batteries themselves, you need to take into account only values reported by BMS and you ned to integrate them manually (you can do it easily in NodeRed).

If you want to measure the efficiency of the system as a whole, you need to compute the difference between the sum of input power and the sum of output power. This can be estimated either from:

  • the instantaneous power balance
  • the day statistics in VRM
  • manual integration of relevant live values (e.g., in NodeRed)

I don’t have the “hard data” at this moment to support for my claim, but I believe the actual efficiency of the Pylontech batteries is “very high” (I suspect, that the real capacity inside US5000 is slightly bigger than claimed, and also the SoC reported by BMS is slightly “shifted” towards high end – a typical trick of battery manufacturers to achieve good “numbers” on livespan and charge/discharge ratings).

Also, I believe the efficiency of the whole system (3-phase ESS) is I guess ~93+% (all losses are around 7%, I guess).

Two examples of such estimations:

1. From Instantaneous power balance:

This morning, at two different time points (both under relatively high load on MultiPluses), I got:

Time: 7:32 (high AC load, high battery load)
OUT: 7667 W (to grid) + 600 W (cons.) = 8267 W
IN : 1760 W (solar) + 7179 W (from bat.) = 8939 W
SYSTEM EFF.: 92.48%

Time 9:29: (high AC load, low battery load)
OUT: 6913 W (to grid) + 527 W (cons.) = 7440 W
IN : 6784 W (solar) + 789 W (from bat.) = 7573 W
SYSTEM EFF.: 98.24% (may be biased upwards)

2. From day statistics:

Date: 4.3.2025 – battery went from 61% → 40% → 100% → 48%
OUT: 29.3 kWh (to grid) + 9.6 kWh (cons.) = 38.9 kWh
IN: 37.4 kWh (solar) + 0.1 kWh (from grid) + 3.5 kWh (from bat - SoC diff.) = 41.0 kWh
SYSTEM EFF.: 94.87%


Since this topic is quite interesting, probably I will implement some stats in the NodeRed. If successful, I will get back to this topic…

2 Likes

I’m a Pytes user, not Pylontech, but this is also quite a hot topic for me and I do not fully trust the energy measurements reported by the BMS from my Pytes batteries (2x 52V 5.12kWh E-Box 48100R-C) because they are clearly much lower than the >=95% round-trip battery efficiency reported by the manufacturer (though I don’t know to which charge/discharge rates this refers to, hopefully it’s not 0.0001C but more like 0.5C).

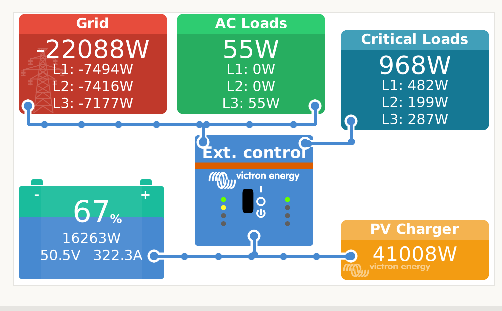
Anyways, after almost a year the BMS is reporting the following all-time-totals via CAN-BMS to my single-phase Multiplus II 3000 and it’s a 100% AC-coupled system, no DC MPPT chargers involved:

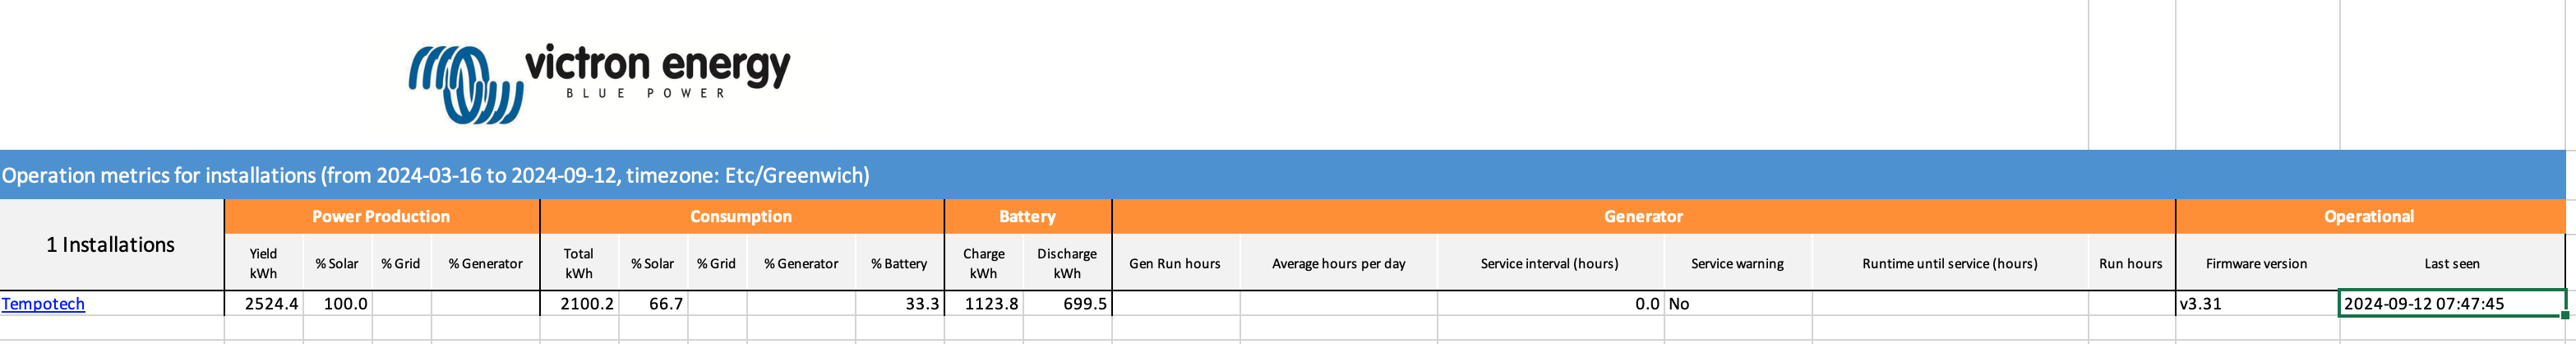
Discharged energy: 779.3kWh
Charged energy: 941.9kWh

(these numbers are truely coming from the BMS and can be found on Venus OS GUI in Device List → Pytes battery → History)

=> 83% battery round-trip which in conjuction with inverter/charger efficiencies of 92% each would result in .83x.92x.92 = 70% total round-trip. (to minimize DESS charge losses I have limitted charge current to 22A which is roughly 62% of max, discharge is not limitted at all, but rarely exceeds 2kW)

And if I take into account the current SoC of 30% and the initial charge of 50% when installing the batteries, the numbers do not change considerably.

But one thing I found out about Pytes BMS is that the energy counts reported to Victron via CAN-BMS are based on current integration (“Coulomb”) a fixed voltage of 53V. I.e. internally the BMS is counting the energy in Ampere seconds, not taking into account the voltage drop from loads and the higher voltage during charging which is necessary to compensate for internal losses and actually pump energy into the cells.

So in theory the battery-roundtrip numbers should be even worse.

But on the other hand I’m wondering how good their energy counters are in terms of sampling rate vs. integration errors, i.e. when there are strong fluctiations / pulses - either from the charger or from the loads (just imagine a heating plate here) - there might be a considerable integration error.

So what I would be highly interested in would be some reference measurements with a highly accurate Smart Shunt featuring a sufficiently high sampling rate that integrates over both: voltage and current.


PS: Using instantaneous measurements for computing the energy balance or system efficiency like @falkon is only valid for truely constant loads and constant PV production because for these calculations to be accurate all measurements involved need to be taken at exactly the same point in time, which is usually not the case.

And also the manual integration of power values (production, charge, discharge, consumption) based on numbers reported by BMS / MQTT / whatever is very much prone to integration errors. It’s better to rely on internal energy counters here (within PV inverter, within BMS, within grid meter) that are integrating the power at sampling rates in the order of 100…1000Hz.

1 Like

Why battery manufactureres always use the SOC (State of Charge) and not SOE (State of Energy) what takes the voltage into account, is the reason of high Coulomb efficiency. For LiIon this efficiency is typically anything between 0,99 to 1.0. It does not depend from other parameters like temperature, currents or Peukert coefficient. We also do not know, how accurate the current meassurements and resolutions are. For small values below 2 Amp, the JK BMS is limited to about 0,4 Amp. what makes an error of more than 100%.

Only if Coulomb counting is assumed as accurate, we might estimate the energy efficiency of a pack. 10% SOC does not mean, there is 10% of remaining energy availbale. The diffrence of my own meassurements is always about 2-3% if I reset the Coulomb Counter at 100% SOC.

On the other hand, we are searching for minimum 10% deviations. One of the things I am going to examine next, is Victrons feed in power display in Watt. Recently I installed a calibrated Ziehl Power relais what displays Watt and not Volt-Ampere apparent apparent power with very accurate multiplication timings.

The problems with my Victron Smart Shunt are also still unsolved. While the DC consumption value is displayed in the device list accurate constant with 25 Watt, the V1 dashboard does not display anything. The V2 dashboard displays DC loads what jumps between -200 and +2000 Watts. Therefore the smart shunt is useless and calculations of round trip efficiency simply wrong.


Let me add another data point: I’m tracking and adding up the values from vebus.ttyUSB0/Energy/*ToInverter and InverterTo* which to my understanding represent what goes in or comes out of the battery on the AC side.

For February, this gives me 92.8kWh of discharge vs 161 kWh of charge, or a round trip efficiency of 58% (with the SOC at the start and the end of the month being around 40%).

This sad number is partially explained by running 3 MP-II 3000s with only around 200W of average load, and with low charging power due to it being winter. Additionally, nobody knows how accurate those measurements are.

I’ve change the title to a much broader scope… :wink:

2 Likes