can’t express how much this is messing with my head ![]()
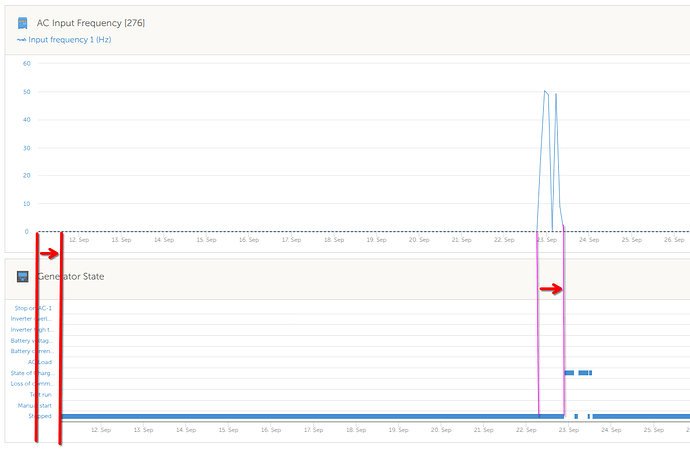
I’ve posted this example below, which is pretty obviously (when zoomed appropriately) just offset due to the different title widths of the AC Input Frequency and Generator State graphs. I’ve also seen instances where different graphs in the advance view have different x-axis scaling (!?!… next time I see that, I’ll add a pic to this thread).
It’s a pretty common diagnostic process to compare the “state” graphs (eg VE.Bus) with some other value to try and establish root causes of faults - it’s going to take a regular technical VRM user two seconds to figure out this pairing (and why the timing of the events is of interest).
Yeah, I know, in an ideal world, I’d be a genius savant who could discombobulate all of that in my head ![]()
