@dfaber needs to message you.
It’s down again, I’ll go out and restart it.
@Maxs Can you share a screenshot of the edit panel of the api node settings? And / or tick the Verbose checkbox and copy/paste the url part of the debug output? (or everything without the X-Authorization: header)

@MiPaul don’t post the cxxxxxxxxx number, that isn’t secure. Use the digits in the vrm url in your browser, between /installation and /dashboard.
That wasn’t very clear. 737062
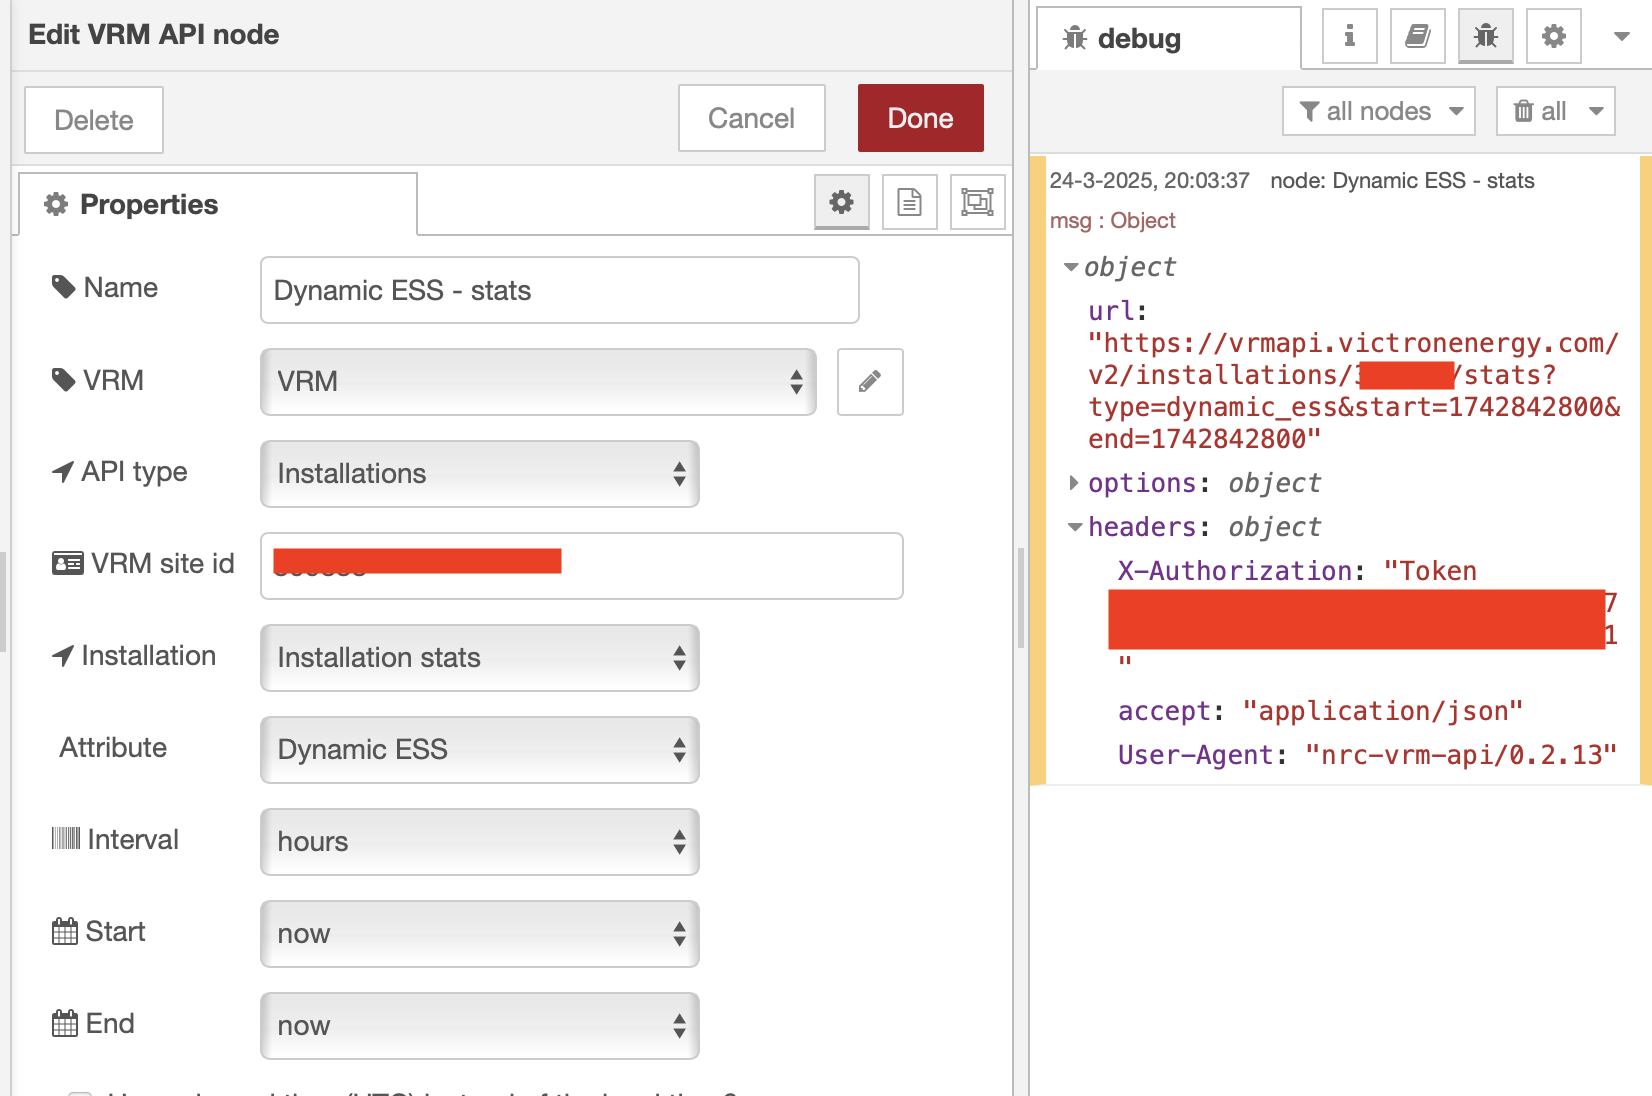
Thanks. I believe that the problem is that you have both the Start and End set to Now. Try setting the end to +24 hour.
I just (briefly) tested Node Red on my CerboGX MK2 running v3.60~49 and relay seems to work again.
When I enable a dashboard and try to connect to it, Node Red seems to crash though.
VRM ID 735182 with Remote Support enabled.
1 Like
Thanks Dirk-Jan Faber. After set the end to +24 hours it is working again. Strange thing is that it Wass working with the old settings in the official release. But I’m happy again!
1 Like
Thanks all. As far as I have figured out so far is that there clearly is still something going wrong with the dashboard on ~49. I am able to reproduce that crash now, but it doesn’t seem directly straightforward to solve. There is no clear reason for it showing up in the logging. So can’t give a clear indication on how long that will take.
Btw I don’t think that the disclosing of the number is more (or less) secure than the 6 digit number. But Nick is right that the policy is to ask for the number. I’ll make that more clear next time.
1 Like
The Victron GUI or node red dashboard?
I’ve had pretty much the same issues since I loaded ~47
Is there any way to get images of previous beta? ~25 was very stable for me, but I wouldn’t mind finding the version that doesn’t behave.
The node-red dashboard (definitely version 1 of that, nr 2 not sure).
And the old ones are no longer available.
1 Like
Quick update: Initially I had no dashboard running or installed.
When I slapped together a rudimentary dashboard on v3.60~49 (after testing the Relay Control Node works in the Workflow Editor), Node Red seemed to crash when I tried to access the dashboard.
Rebooting back to v3.54 and the dashboard works.
Upgraded to v3.60~49 again and the dashboard still works.
Edit: discard the above line, I’ve tried it for ~5 times now and more often than not, Node Red crashes (?) when trying to access the Node Red dashboard when running v3.60~49.
I got a “File not found” error for a short time when trying to access the Node Red dashboard while running 3.60~49 but couldn’t copy or remember the exact file or error though.
Also: Remote Console over VRM can be very difficult to get a connection when running v3.60~49.
Unfortunately, v3.60 beta seems to be plagued with issues lately.
1 Like
It seems to be just on the MK2 devices. If you close all instances of the node red dashboard, ~49 runs as expected. I forgot that my laptop inside the coach had a dashboard instance open, once that was closed it stopped locking up.
Beta always has issues, getting two softwares to play nice while both are changing is a big task, throwing a hardware change into the mix only makes it worse.
1 Like
Good point on the MK2s.
Unfortunately my other test devices are offline atm so I could only test with a Cerbo MK2.
And yes, this is expected behavior when running beta software - you won’t hear me arguing about that.
Victron will get it fixed and I joined the beta program specifically so that bugs like this can be found & fixed faster ![]()
Hello i am also adding myself to this issue. Node red seems to be working okay but dashboard is very laggy / long to load/ connection interupts. It looks to be the same on local network and remotely. I have enabled the cpu usage counter and it is always above 90%. I have older Cerbo GX (Not MK2). If there is anything i can do to help fix this issue let me know.
Keep up the good work !
Last night I tried the NR dashboard to enable a charger, The MK2 would not connect to my modbus tcpip relay device (connected with a crossover cable). I noticed a few hours later it had stopped responding on wifi. I walked out and saw my 3rd party BMS still being polled, but I could not connect to the MK2 on wifi or locally on BT. Power cycled, ran all night. I’m pretty positive it was on 3.54.
Today I factory reset NR, then repeatedly cut & paste small sections of flow to see where it would die. It didn’t die, dashboard appears to function AND the tcpip modbus now shows connected, a first for my MK2. I’m mostly certain it was on 3.54, I was busy.
Switched to ~49 and NR also worked there too! Although I noticed ALL of my USB connected devices are missing, Victron & 3rd party BMS. Cycling the USB plugs on the MK2 brought them back. Strange, first time I’ve had that happen.
Back to 3.54, only some of the USB devices (Victron) are missing and NR does not connect to tcpip, dashboard doesn’t work ![]()
3.54, Power cycle, all USB devices are back, NR doesn’t connect to tcpip.
3.54, factory reset NR, imported again, missing some USB devices and no tcpip. Cycled the RJ45, still no tcpip. Moved a node to change, deployed, and I have tcpip again, and dashboard. Okay…
3.54, Reboot and All 4 of the mppt are still missing, NR connects to tcpip, dashboard works. Those 4 devices are on one USB plug and are all Victron mppt w/official USB dongles.
From this I kinda get that a switch to ~49 corrupts node red.
And corrupted node red appears to affect the network (not sure which end).
And a reboot != power cycle.
And the serial starter prefers my aftermarket stuff and often ignore yours. ![]()
edit:
After a bit more testing on 3.54, it seems like all USB devices do come back after a power cycle, but not from a reboot. I have 7 devices total on USB and 2 more with ve.direct cables. I swapped ports with the USB cables at the MK3, it follows the USB devices which are the 4 mppt units.
About 50% of the time after power cycle or reboot, it took a flow redeployment to get the tcpip to reconnect. I could not see any pattern to it, but it doesn’t take a firmware change to get it to act up.
I’ve migrated my system to an older Cerbo-S on ~49 to continue testing.
It’s been a full day. Node red dashboard runs fine, no WiFi dropouts, and the modbus TCP/IP works as expected. All of the devices reconnect after multiple reboots and power cycles. Shore power transition testing is next up.
The only issues I’ve noticed are the electron animations don’t show in the overview and there are some errors in the log file for my bootleg IP22 charger on ve.direct.
I can confirm Dashboard issue was fixed for me.
1 Like
This has indeed been fixed in ~53.