question

mvader (Victron Energy) avatar image
mvader (Victron Energy) asked

Venus OS v3.40~13 available for testing

Good evening!

With Venus OS v3.31 officially released, its time to continue v3.40 beta testing.


Highlight: our new UI, gui-v2 beta

1700597863477.png

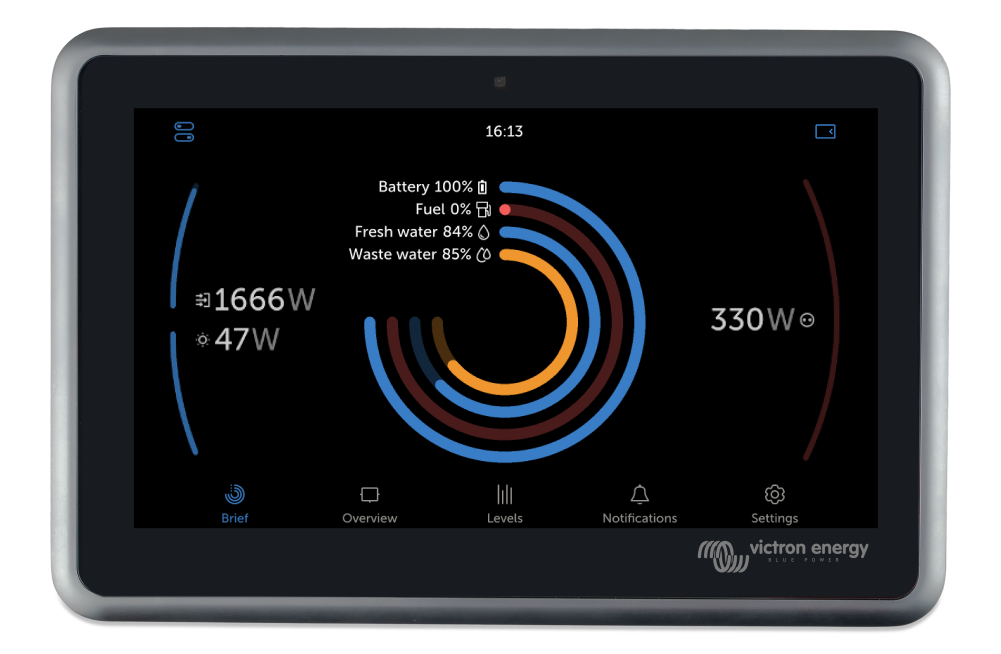
Available in public beta testing for several months already; and receiving continuous updates and progress towards official release.

The details:

  • It is still in beta, porting all the features and functions of the old UI over to the new one is an enormous task, and I expect that to take several more months.
  • Beta testing is best done using a browser, http://<ipaddress>/gui-beta. And you need to enable the MQTT on LAN (Plaintext) setting for that to work, but having it on screen on an Ekrano GX as well as GX Touch is possible as well.
  • More screenshots and details are in this presentation:

    https://bit.ly/gui-v2

  • Known issues - no need to give comments or answers on these, they are being worked on:
    • Keyboard navigation is not yet supported in the Remote Console
    • Drill down for AC loads, showing the split between normal and critical loads is not available yet
    • Solar and wind priority controls are missing.
    • Connecting to wifi / setting wifi password doesnā€™t work.
    • The arcs aka gauges on both brief page and overview page don't work well yet.
    • Various other things.


Instructions: Venus OS beta testing & how to join/install

In case you don't know what this message is about, please start with reading this link, which explains the Venus OS beta program. Venus OS is the software running on all our GX devices, such as the Cerbo GX.


Instructions: How to post an issue?

By posting an answer below. Do please keep all findings organised: one answer issue per issue. So first check the existing threads if your issue has already been seen. And if it does, add a comment saying "me too". And preferably some more details. And in case its not listed yet, add a new Answer.

Note that Answers and Comments are two different things on this portal.

Lastly, before posting issues, preferably first revert to the latest official release, to double check if the issue you're seeing was present there as well. Regressions require a different treatment than other issues and bugs.

And include information about the results/differences in behaviour in your report.


Instructions: Node-RED, Kevinā€™s GuiMods or other add-ons?

In case you are running Node-RED or SignalK, then please at least say so in your bug report.

GuiMods and other 3rd party add-ons: donā€™t report your gui issues here. Do it elsewhere instead.

Changes made by us can cause a compatibility issue with the GuiMods; and these betas report pages are for official firmware only.


Change log


v3.40~11, v3.40~12 and v3.40~13

Managed batteries

  • Fix issue that causes Freedomwon batteries to sometimes disappear after a reboot, causing the Inverter/charger and other components to show "Error 67 - no BMS". In more technical terms: we fixed an issue that caused the BMS-Can interface to somtimes hang on high traffic during boot.
    • The issue and fix only involve the BMS-Can interface on the Cerbo GX as well as the earlier EasySolar-II GX and MultiPlus-II GX production that had a BMS-Can interface.
    • CAN ports marked as VE.Can are not affected. Therefore the new Cerbo GX MK2, Ekrano GX, as well as later production of the EasySolar-II GX and MultiPlus-II GX that have a VE.Can port, rather than a BMS-Can port, are all not affected.
    • This is a relatively new problem, since the high traffic is caused by a recent BMS Firmware/Profile released by Freedomwon since late 2023.
    • We're not aware of any other batteries that have the same issue; and if there were then that problem is now also solved.
    • For any system/user/installer with a Freedomwon battery, we recommend to await an official release of Venus OS that includes this fix - if testing goes well then we expect to make the official release in June at the latest. For systems that can't wait, either install this beta version or contact Freedomwon to install an updated BMS profile (requires USB connection, laptop + remote access by Freedomwon).
    • Thank you to Warwick C. and other South African professionals for highlighting this and helping to get to the bottom of this. Fixing this in Venus OS was quite involved, and much appreciated since updating Venus OS is the most efficient solution to deploy.

Dynamic ESS

  • Fix problem where the error code sometimes gets stuck. But was present since Dynamic ESS introduction (Venus OS v3.30)

gui-v2 beta

  • Add settings page that allows to set min and max values for the gauges ranges, as well as enable and disable auto-ranging. By default, auto-ranging is enabled.
  • Various improves to gauges on the Brief and Overview page
  • Hide levels page if there are no tanks and temperature data
  • Jump to notifications page also when an alarm is received while in a sub-page
  • Pause page animations when the display is off (reduces CPU)
  • Enable upscaling of gui-v2 when viewed in a browser
  • Fix bug in switches that are part of a list item
  • Update translations
  • Show small 3-phase view for AC Loads widget when size <= S
  • Add high temperature and short circuit Solar Charger alarms
  • Show hidden ESS limit/max charge power setting
  • Fix Brief page showing percentages briefly after selecting the volume unit
  • Various layout fixes for overlapping labels on different languages
  • Rename incorrect AC input 'Grid meter' to 'Grid'

Venus OS Large

  • Add Victron-VRM-API node, a node that makes it easy to get data from the VRM database

Internal / developer / future

  • CAN-bus BMS HV profile: Add Pylontech HV protocol
  • CAN-bus BMS HV profile: Remove transmission of 0x307 messages
  • Lynx Smart BMS & Lynx Smart BMS NG: add feature to combine multiple Lynx Smart BMSes into one parallel redundant battery bank. Note that this feature also requires a firmware update / any public testing is not possible yet.


v3.40~9 and v3.40~10

  • Fix energy flow from DC bus to Inverter/Charger not correctly animating with Inverters, Inverter RS or Multi RS
  • restore showing a warning note when switching to gui-v2
  • Cerbo GX MK2: rename CAN ports from VE.Can and BMS-Can to VE.Can 1 and VE.Can 2.
  • Add forcing good settings for Meterboost batteries, see: https://www.victronenergy.com/live/battery_compatibility:meterboost

Developers:

  • Add selectable HV Canbus profile for VE.Can 2 port of both the Ekrano GX and the Cerbo MK2.
  • Add support for external back feed relay systems. More public information on this will be shared later.


v3.40~3 upto and including v3.40~8

  • gui-v2
    • Add multi-phase visualization for AC gauges
    • Separate AC and DC input gauges on Brief page
    • Show AC input gauge if valid even if disconnected
    • Always show AC load gauge on Brief page
    • Update solar arc gauges on Brief page
    • Improve min/max value ranging for all gauges; note that this work is not completed yet.
    • Fix bugs in and improve arc gauge animations
    • Add support for Passthrough in Multi RS
    • Use monospaced font for value labels, performance improvement / cpu reduction.
    • Hide display-off button during alerts
    • Prevent Qt crashing by avoiding UniformAnimator
    • Improve timezone support and date/time setting
    • Split AC/DC input side gauge into separate AC and DC input gauges
    • Support displaying tank volumes on the Brief page: select Settings > Display&Language > Brief levels > Brief view unit > Show tank volumes
    • Pause the Overview page animations during heavy CPU load (accumulated 80% all CPUs)
    • Improvements to the GUI v2 positioning and scaling on the browser
    • Fix dialogs appearing in a different scale than the rest of the GUI v2 on the browser
    • Various bug fixes: a crash on browser, Brief page stutter, radio button selection, etc.
    • Updated translations
  • Ruuvi wireless temperature sensors: Increase low battery alarm hysteresis to avoid repeated triggers
  • Modbus-TCP
    • Add registers for ESS MinSocLimit on Multi RS (register 4614)
    • Add registers for InverterCharger power and current summary

      These registers provide a single summary of what the inverter-charger (Multi RS or VE.Bus Multi) is doing on the DC bus. It provides a single place for user interfaces to find the value, and hence also for modbus.

  • VE.Can D-Bus driver: various changes related to the Multi RS, preparing for future features.

  • First version of Integrel E-Power integration; few more changes coming. Feature is monitoring.

  • GX Tank: remove limit of max 32 sensors

  • Fix problem where PV-inverters measured using the AC Current sensor accessory wired to a Multi disappears after doing firmware updates. This is done simply by adding a 5 second time delay. This is old code for old hardware that does not warrant spending much time on.

  • Generator integration: add generator engine oil temperature reading to the gui, works for those generator controllers that support that.


Changes that were all also released as v3.31 official:

  • Fix EVCS firmware updates over VRM failing on fast network connections.

  • Note that the fix for gui-v1 locking up on boot sometimes is not yet included, will be included in v3.40~9.

  • gui: fix alarm icon showing while there is no alarm, issue was introduced in v3.30
  • gui: remove DESS Minimum SOC menu entry, since that is now configurable on the VRM portal rather than in the GX menu structure.
  • Dynamic ESS: fix bug where PV from grid-inverter was fed back into the grid rather than used to charge the battery, in certain conditions.
  • SignalK-Server v2.5.0 -> v2.7.1 + signalk-venus plugin update.
  • VM-3P75CT Energy Meter: fix power readings not properly available when using multiple of these energy meters on the same VE.Can network.


Venus OS Large + Developers:

  • Node-RED: fix a bug that could cause relay 1 to be disabled. node-red-contrib v1.5.16.
  • Node-RED: update from v3.1.7 to v3.1.8. https://github.com/node-red/node-red/releases/tag/3.1.8.
  • vreg-tool: Fix binary output mode. There was a conflict with the -b common (velib shared) command line switch, which can be used to set the canbus bitrate. The vreg tool used the same switch for binary output mode, which has been changed to -B.
  • Add more pts as securetty. That is reported to improve tailscale connections.
  • Update Qt from v6.5.2 to v6.6.2
  • Change websockified VNC port, used by Remote Console on LAN. This traffic used to go over port 81, now its served by nginx on port 80 and 443, url is now http://<ip>/websockify and https://<ip>/websockify.


v3.40~2

  • New version of gui-v2
    • Show both grid and generator on the Overview page if availabe
    • Show arrow icon next to AC input gauge value when ESS feedback enabled
    • Fix display not switching off at user configured "Display off time"
    • Add manual display off button added to the status bar on the top. Allows user to quickly turn the display off again after looking something up, especially in the dark. Nice feature, thank you to those that suggested that!
    • Increase the size of status bar buttons (e.g. back button) for easier access
    • Overall performance improved, in other words: CPU usage by gui-v2 was reduced, by various improvements
    • Avoid stutter when leaving the main settings page
    • Fix inverted tank levels on the Brief page
    • Use custom name for tanks if available
    • Inverter / Charger details opening in the Overview page fixed
    • Crash when leaving the WiFi settings fixed
    • Fixed generator start/stop dialogs getting momentarily stuck on the screen on Ekrano GX
    • Hide the display brightness setting when gui-v2 is accessed using the browser
    • Various fixes to the Battery settings
    • Various smaller bug fixes and improvements
  • Various other changes and improvements that are in preparation of future functionality.

Venus OS Large


v3.30 -> v3.40~1

  • re-add gui-v2 beta
  • generator start/stop: some internal changes related to cooldown and warmup and ignoring AC in to prepare for a different new feature that relates to "ignoring AC in" coming soon.


Venus OS
8 comments
2 |3000

Up to 8 attachments (including images) can be used with a maximum of 190.8 MiB each and 286.6 MiB total.

Hi all! Per earlier today the new beta version is v3.40~13. Change log will follow later today or tomorrow. Have a good night
3 Likes 3 Ā·
andrii-podanenko avatar image andrii-podanenko mvader (Victron Energy) ā™¦ā™¦ commented Ā·
Installed on both MultiRS and MultiPlus II setups.

Noticable changes in gui-v2 - now it fits to the mobile screen. Thank you.


Green Mode in DESS on MultiPlus II - I see the difference and it makes sense for me. Was bothering in Trade mode charge happening in the end of the solar, while in Green Mode it tries to charge from solar sooner. Good change.


So far - both system are stable. Thank you

0 Likes 0 Ā·
Hey all! Right before the weekend, v3.40~10 is out for testing.
2 Likes 2 Ā·
Venus OS v3.40~13 change log is now included above.
2 Likes 2 Ā·
mfarkas88 avatar image mfarkas88 commented Ā·
Hi, I recently added an LPG level sensor to my setup, however I canā€™t seem to find a way to hide it on the brief screen. Is there any way to do this? I prefer having the large battery percentage and a full circle on the brief screen.
0 Likes 0 Ā·
pwfarnell avatar image pwfarnell mfarkas88 commented Ā·
Go into display settings, brief levels and deselect all tanks and you might then just see the battery.
0 Likes 0 Ā·
mfarkas88 avatar image mfarkas88 pwfarnell commented Ā·
Thanks for the reply, it doesnā€™t seem to have a way yo deselect them. I tried to change them all to battery and that didnā€™t work either. Hopefully they add a deselect feature..
0 Likes 0 Ā·
kurt-thu avatar image kurt-thu commented Ā·

Hi. First of all. Thx for the fantastic job you are doing for all og us :-)


Is it possible to activate "Charger only" and "Inverter only" were we choose the Inverter/charger mode?

Thx for your help

skjermbilde-2024-05-13-kl-120507.png

0 Likes 0 Ā·
36 Answers
pwfarnell avatar image
pwfarnell answered Ā·

Matthijs,

A few visual bugs with tank displays. The bugs are not consistent often needing a Cerbo reboot to correct any changes in display setting s.

Randomly the fill bar does not appear on a tank or several tanks, note black water at 27%. This has occurred viewing gui2 through VRM and on the Cerbo GX Touch. Screenshots taken a few minutes apart.

screenshot-20240424-200203.png

screenshot-20240424-194800.png

screenshot-20240424-202336.png

Secondly, when choosing to display the tank volume on the brief page rather than % I see a different behaviour. On GX touch it displays the % value with ā€Šl for lires but on VRM it displays the volume value correctly. However, on VRM it shows the black water tank in alarm when displayed as a volume, it is <30% but for black water alarm should be >70%, also the fresh water and fuel tank bars are wrong. When displayed as % the correct bar length and colours are seen.

VRM display as volume

screenshot-20240424-200122.png

VRM as %

screenshot-20240424-202313.png

GX Touch display as volume

20240424-195304.jpg


2 comments
2 |3000

Up to 8 attachments (including images) can be used with a maximum of 190.8 MiB each and 286.6 MiB total.

Hey @pwfarnell ok noted, thank you!
0 Likes 0 Ā·
jpetrell avatar image jpetrell commented Ā·

> when choosing to display the tank volume on the brief page rather than % I see a different behaviou

Tank volume showing briefly percentages after the unit switch should now be fixed in v3.40~13, please retest.

> Randomly the fill bar does not appear on a tank or several tanks, note black water at 27%.

Thanks! Reported.

0 Likes 0 Ā·
wizwaretech avatar image
wizwaretech answered Ā·

I had an overload and over temperature shutdown occur. I never heard an alarm go off, despite 'audible' being turned on. Is there a bug in GUI-v2 and/or Beta (3.40-x) that would stop the audible alarm from going off or is there something else that I need to do to enable it? I looked in VRM and I ran for nearly two hours under high temp, yet never heard a peep. What am I doing wrong? The Cerbo is in another compartment and if it was making a noise I would never have heard it. I expected the GX Touch to make the alarm noise. Am I wrong? Where should the sound come out of?

Also, I think a blinking red screen would be a great way to get the attention of someone, instead of just a little notification indication. I would love to see an option under 'audible' called 'visual' that you could enable that would cause the screen GX Touch to ALARM! between white and red backgrounds (RED 'ALARM!' on black background for 1 second, then BLACK 'ALARM!' on white background for 1 second, repeat until screen is touched to acknowledge). This would REALLY help it stand out just in case the audible doesn't work (like in my case) or for our hearing impaired citizens.

I suggest when the 'audible' is turned on, to trigger the alarm sound so someone can test to make sure it is sounding like it should. I have no idea what it sounds like because I've never heard it.

2 comments
2 |3000

Up to 8 attachments (including images) can be used with a maximum of 190.8 MiB each and 286.6 MiB total.

nickdb avatar image nickdb ā™¦ā™¦ commented Ā·
It comes from the Cerbo, not sure if the touch can "mirror" the alert noise.

The remote console (old style) would usually switch to the notifications section as well.

I can see even on grid loss, v2 GUI doesn't make it obvious.

0 Likes 0 Ā·
pwfarnell avatar image pwfarnell commented Ā·

I find setting all my alarms in VRM is a good way of keeping on top of issues, but it does depend on a good mobile connection. with a remote mounted Cerbo I would suggest using one of the relays as an alarm relay with a remote buzzer(s) or light(s) in your accommodation space / helm as it sounds like a boat install, very easy to set up.

0 Likes 0 Ā·
Alex Pescaru avatar image
Alex Pescaru answered Ā·

Hi Matthijs @mvader (Victron Energy)

Could you also please add for the Multi RS the (real) ActiveSoC ?

I've saw that this value is reported on the CAN bus on Victron register 0xD03A, but with 0.01 resolution instead of 0.1 resolution like the others.

So, I believe (and please excuse me if this supposition is wrong) that won't be too much of a problem to map it to a Modbus register.

Thank you!

Alex

2 |3000

Up to 8 attachments (including images) can be used with a maximum of 190.8 MiB each and 286.6 MiB total.

ojack avatar image
ojack answered Ā·

Nice idea to make one gauge per phase.

But I can't understand the ranging. L1 is about -2kW L2 is -4kW and L3 is -6kW.

1714046247958.png


1714046247958.png (7.7 KiB)
6 comments
2 |3000

Up to 8 attachments (including images) can be used with a maximum of 190.8 MiB each and 286.6 MiB total.

ojack avatar image ojack commented Ā·
Maybe zero could be in the middle and plus upwards color red and minus downwards color blue.
0 Likes 0 Ā·
ojack avatar image ojack commented Ā·

Same here.

Gauges not corresponding with the negative values.

1714047043228.png


0 Likes 0 Ā·
1714047043228.png (17.4 KiB)
nickdb avatar image nickdb ā™¦ā™¦ ojack commented Ā·
Gauges don't have a common scale. Each is relative to its own previous maximum value.
0 Likes 0 Ā·
ojack avatar image ojack nickdb ā™¦ā™¦ commented Ā·
Ok, but that's not a good solution I think. What should these gauges tell you then?
1 Like 1 Ā·
mvader (Victron Energy) avatar image mvader (Victron Energy) ā™¦ā™¦ ojack commented Ā·
For L1, L2 and L3 there is one and the same scale.


I think best is to wait a bit longer; weā€™re still working on the scaling.


Those gauges are on their way to be the most debated, discussed and worked on part of that whole new UI !

;o)


Weā€™ll get them right.


1 Like 1 Ā·
ojack avatar image ojack mvader (Victron Energy) ā™¦ā™¦ commented Ā·
Of course you will manage it, I am sure of it. ;-)

The gauges are the first thing you see of GUI V2. Therefore, they are the deciding factor in whether you like GUI V2 or not.

0 Likes 0 Ā·
ojack avatar image
ojack answered Ā·

Two Gauges moving downwards.

Representing three AC-PVs and two mppts. But not visible which Gauge represents AC and which DC. At screenshot DC should be 6kW and AC is 10kW.

1714047505662.png


1714047505662.png (11.8 KiB)
5 comments
2 |3000

Up to 8 attachments (including images) can be used with a maximum of 190.8 MiB each and 286.6 MiB total.

pf-1 avatar image pf-1 commented Ā·

In the case of the solar yield, the stripes represent the progression (from the inside to the outside)

0 Likes 0 Ā·
ojack avatar image ojack pf-1 commented Ā·
Unfortunately, that doesn't help. Here are two bars of roughly the same length. There are 3 AC PVs in the system, which have just under 2/3 of the power, and 2 MPPTs with 1/3 of the total power. Unfortunately, I can't see that at all in the graph.
0 Likes 0 Ā·
ojack avatar image ojack commented Ā·

Now there appeared 3 gauges for my 5 PV Sources (3x AC and 2x mppt).

But I have no Idea which gauge represents which of the sources??

1714132849142.png

At the moment one oft the AC-PVs makes nearly 2kW and the other 2kW are devided to the other 4 sources.

All sources are in the devicelist

1714133188193.png


0 Likes 0 Ā·
1714132849142.png (8.0 KiB)
1714133188193.png (27.8 KiB)
pf-1 avatar image pf-1 ojack commented Ā·

Then I would like to try to explain it another way.

The quadrant at the bottom left of the short page represents the sum of all solar yields. The various bars represent the history, i.e. show the progression of the total solar energy generated.

0 Likes 0 Ā·
ojack avatar image ojack pf-1 commented Ā·
Oh dear, then in my view it is even more nonsense. All gauges show current performance, only solar shows any history. Without any possibility of interpreting it properly, because there are no units, no axis labels, and no mouseover explanations.
0 Likes 0 Ā·
pf-1 avatar image
pf-1 answered Ā·

A smal bug and a question:


In the menu of the Energy Meter (EM 540 in my case), the menu item ā€œSetupā€ (to set the role as a grid meter) cannot be called up. It works perfectly in the old gui.


Can the values displayed in the new Gui for the ā€œtotalized solar powerā€ and the ā€œtotalized consumptionā€ be called up directly in registers, or do they have to be calculated by an external script if I want to read out these values?

2 |3000

Up to 8 attachments (including images) can be used with a maximum of 190.8 MiB each and 286.6 MiB total.

ak68 avatar image
ak68 answered Ā·

ThereĀ“s a mistake at "short-page":

The shown "LPG" doesnĀ“t exist :)


1714110688045.png

1714110719137.png

Couls you please add:

1. Change Tanks/ Temperature (sequence)
2. Show more details (Currant, Voltage) at "Overview" for Solar- like at battery


1714110920108.png


1714110688045.png (20.1 KiB)
1714110719137.png (33.7 KiB)
1714110920108.png (17.6 KiB)
3 comments
2 |3000

Up to 8 attachments (including images) can be used with a maximum of 190.8 MiB each and 286.6 MiB total.

pwfarnell avatar image pwfarnell commented Ā·
You are wrong about the LPG, you have 2 LPG tanks, Kocher and Grill with 56% and 100%. I assume these are the same volume so the average of 56% and 100% is 78%. The short-page shows the combined volume of ALL tanks of each type, if you had multiple frischwasser tanks you would see the combined level of all tanks here.
0 Likes 0 Ā·
ak68 avatar image ak68 pwfarnell commented Ā·
This is corrct, I can change it to LNG, but how can I change the sort of displayed devices or can I show 5 different types ?
0 Likes 0 Ā·
pwfarnell avatar image pwfarnell ak68 commented Ā·

You can only have 4 measurements in the Brief page, I would like 5 and have mentioned this before.

In gui2, sel setting, "Display and Language", "Brief View Levels", and you can select which types of battery or tank to display.

screenshot-20240426-182316-kindlephoto-325376922.png

screenshot-20240426-182401-kindlephoto-325420959.png


0 Likes 0 Ā·
bohne avatar image
bohne answered Ā·

Mion


1. mir ist aufgefallen das der Orion xs keine Daten aufzeichnet. Dadurch ist keine Verlauf Verfolgung mƶglich.

img-1750.png

img-1799.jpeg

2. wie man hier sieht wird der Wert vom Solar nicht in amper dargestellt alle anderen wert wurden von Watt auf amper umgestellt

img-1798.jpeg


img-1798.jpeg (3.7 MiB)
img-1750.png (219.0 KiB)
img-1799.jpeg (3.0 MiB)
2 |3000

Up to 8 attachments (including images) can be used with a maximum of 190.8 MiB each and 286.6 MiB total.

andrii-podanenko avatar image
andrii-podanenko answered Ā·

Updated from 3.40~2 to 3.40~8 on my MultiRS hybrid system

https://betavrm.victronenergy.com/installation/370388/share/c0152a83

gui-v2 placement is not centered ( do not recall it was reported or not )

1714118169490.png


Scroll artifacts - UX


Node-RED 3.1.8 works, no issues with my flow

I can see MinSocLimit via Node-RED dbus driver

1714120207693.png

Other updates, related to MultiRS not visible just yet
Thank you @mvader (Victron Energy) - I'm excited to see MultiRS progress


1714118169490.png (409.4 KiB)
1714120207693.png (180.9 KiB)
8 comments
2 |3000

Up to 8 attachments (including images) can be used with a maximum of 190.8 MiB each and 286.6 MiB total.

andrii-podanenko avatar image andrii-podanenko commented Ā·

Upgraded my MultiPlus-II setup as well

From 3.31~4 to 3.40~8

  • DESS works
  • Node-RED flow works
  • AC meter Card works

1714119710347.png

Doesn't work - Click on it shows empty data ( It's a single phase, no AC meter in a setup, just MultiPlus-II )
1714119734825.png

https://betavrm.victronenergy.com/installation/380883/share/813a14fb


0 Likes 0 Ā·
1714119710347.png (68.1 KiB)
1714119734825.png (57.4 KiB)
Alex Pescaru avatar image Alex Pescaru commented Ā·

Hi @Andrii Podanenko

That MinSocLimit is there alright, but is not updated with the real value...

Alex


0 Likes 0 Ā·
andrii-podanenko avatar image andrii-podanenko Alex Pescaru commented Ā·
It shows real value in my system.


I'll double check once back to my laptop
0 Likes 0 Ā·
Alex Pescaru avatar image Alex Pescaru andrii-podanenko commented Ā·
In my system I have it set to 40% and it always shows 10%.

Both SocLimit and MinimumSocLimit...


0 Likes 0 Ā·
andrii-podanenko avatar image andrii-podanenko Alex Pescaru commented Ā·

Does work for me for MultiRS Dual Tracker @Alex Pescaru

1714468262668.png

0 Likes 0 Ā·
1714468262668.png (100.3 KiB)
Alex Pescaru avatar image Alex Pescaru andrii-podanenko commented Ā·
Hi @Andrii Podanenko


If you set the path from Node Red maybe.

But set that value from Victron Connect and see if it is reflected in that key...


0 Likes 0 Ā·
andrii-podanenko avatar image andrii-podanenko Alex Pescaru commented Ā·
I've set 10 to 11 via VictronConnect and found it is changed via Node-Red

So it does work for me. Node-Red is just for debugging here @Alex Pescaru

0 Likes 0 Ā·
Alex Pescaru avatar image Alex Pescaru andrii-podanenko commented Ā·
Strange, but maybe because I have the small image, not the large one with NodeRed...
0 Likes 0 Ā·
ojack avatar image
ojack answered Ā·

In the Solardetailpage there is still an inconsistency in presentation. For DC, today's yield is displayed in Wh and for AC, the long-term yield is displayed in kWh or MWh. That is confusing.

And for the three Phase inverters (4th and 5th entry) some values are missing.

1714133496141.png


1714133496141.png (90.7 KiB)
1 comment
2 |3000

Up to 8 attachments (including images) can be used with a maximum of 190.8 MiB each and 286.6 MiB total.

ojack avatar image ojack commented Ā·
still current at v3.40~13
0 Likes 0 Ā·
Tony avatar image
Tony answered Ā·

Connected to one of the digital inputs on my Cerbo GX I have a room thermostat, so that I can get warnings if the room with the equipment in gets to hot. Since moving over to the GUI V2 this device has disappeared from the device list.

1 comment
2 |3000

Up to 8 attachments (including images) can be used with a maximum of 190.8 MiB each and 286.6 MiB total.

Tony avatar image Tony commented Ā·
I have just rebooted the Cerbo GX for a second time and it has detected the thermostat connected to the digital input.
0 Likes 0 Ā·
ak68 avatar image
ak68 answered Ā·

With 3.40~10, details of solar (MQTT Solar) are not seen any more :(

(ist not possible to scoll more up :)

1714299431906.png

With MQTT Battry it works fine :(


1714299431906.png (19.8 KiB)
2 |3000

Up to 8 attachments (including images) can be used with a maximum of 190.8 MiB each and 286.6 MiB total.

Tony avatar image
Tony answered Ā·

VRM seems not be updating in real time since updating to v3.40~10. I have rebooted my Cerbo GX. But that has not resolved the issue.

2 |3000

Up to 8 attachments (including images) can be used with a maximum of 190.8 MiB each and 286.6 MiB total.

Kevin Windrem avatar image
Kevin Windrem answered Ā·

Inverter mode selection in gui-v2 (from overview drill down and also device list) has Charger only and Inverter only grayed out. It's been this way since the beginning and reported before but still an issue in v3.40~10.

Multiplus Compact, Cerbo GX

Both local and WASM gui-v2. In gui-v1, all 4 options (On, Off, Charger Only, Inverter Only) appear in / Device List / Multi... and work properly.

2 |3000

Up to 8 attachments (including images) can be used with a maximum of 190.8 MiB each and 286.6 MiB total.

dutchsolarfreak avatar image
dutchsolarfreak answered Ā·

Hello

I found two bugs in GuiV2. Maybe already mentioned somewhere but better twice than not mentioned:

Not all ESS settings are visible in GUIV2. (Max laadvermogen is missing)

1714413855442.png

1714413940512.png


In system-setup when I change "Heeft DC systeem" the setting is not saved.

1714414092816.png

In GuiV1 it is.

If these bugs are known please ignore this message


1714413855442.png (48.4 KiB)
1714413940512.png (32.4 KiB)
1714414092816.png (7.2 KiB)
2 comments
2 |3000

Up to 8 attachments (including images) can be used with a maximum of 190.8 MiB each and 286.6 MiB total.

dutchsolarfreak avatar image dutchsolarfreak commented Ā·

@mvader (Victron Energy)

Today the "Maximaal laadvermogen" is also not visible in GUI V1?!

1714924235600.png

Is this bug a known bug? Or is this option not visible in case you activate DVCC?

0 Likes 0 Ā·
1714924235600.png (108.9 KiB)
dutchsolarfreak avatar image dutchsolarfreak commented Ā·

@mvader (Victron Energy)

I installed the latest beta 3.40-13 and according to the changelog this issue should be fixed.

In both GuiV1 and GuiV2 the switch limit laadvermogen and Maximaal laadvermogen is missing for my installation 360507

1715063998025.png

0 Likes 0 Ā·
1715063998025.png (24.1 KiB)
lucekp avatar image
lucekp answered Ā·

Hello,

1714418548382.png


Both VRM and gui V2, it show Ac loads and DC power, but AC loads are in Watts only:

Phoenix Inverter is not reporting in W:

1714418662739.png

while Multiplus does:

1714418703592.png

As the effect of that the overview and all charts are off by power usage from phoenix, in that case off by 100W:

1714418804667.png


While I understand that VA and W are not the same thing, in many usages we can just ignore the difference for simple overview purposes. If it is not possible to display W, can we at least have toggle "consider VA as W"? It will be much closer on graphs anyway than ignoring it like it is now.


1714418548382.png (64.2 KiB)
1714418662739.png (31.8 KiB)
1714418703592.png (66.0 KiB)
1714418804667.png (89.2 KiB)
2 |3000

Up to 8 attachments (including images) can be used with a maximum of 190.8 MiB each and 286.6 MiB total.

mnts2023 avatar image
mnts2023 answered Ā·

after the weekend I noticed that my bluetooth sensors (ruuvi, mopeka) are not showing, tried to restart, upgraded fw to v3.40~10 - but no joy. then tried to disable Bluetooth, hoping that could reset someting, but noticed that you cannot disable Bluetooth. if you do that and go back, then check - it's again showing as on:
1714461113527.png Back and open Bluetooth again and it is still on:
1714461166287.pngI'm not on site, so cannot physically inspect LEDs. but looks like a bug, hence reporting here.


1714461113527.png (7.1 KiB)
1714461166287.png (7.4 KiB)
1 comment
2 |3000

Up to 8 attachments (including images) can be used with a maximum of 190.8 MiB each and 286.6 MiB total.

mnts2023 avatar image mnts2023 commented Ā·
BTW after I have switched back to Standard GUI and turned off and on Bluetooth the sensors came back to life on the display.
0 Likes 0 Ā·
Tony avatar image
Tony answered Ā·

screenshot-20240430-0941582.png

My Android tablet is not loading UI V2, it is been stuck at this screen for 30 minutes.

Is anyone else experiencing this issue?


2 |3000

Up to 8 attachments (including images) can be used with a maximum of 190.8 MiB each and 286.6 MiB total.

hjohnson avatar image
hjohnson answered Ā·

@mvader (Victron Energy) am running the latest beta and liking the Beta GUI, especially the overview page. The one request I would have is a small change in how it handles boxes for sources that come and go.

would it be possible for the source boxes to be sticky? I have a wakespeed WS500 in my system, and itā€™s a little annoying that it just disappears. It might be nicer if it were to still be displayed, but as ā€œoffā€ or some such. My multiplus continues to display on the screen when itā€™s off, so this wouldnā€™t be unprecedented.

1 comment
2 |3000

Up to 8 attachments (including images) can be used with a maximum of 190.8 MiB each and 286.6 MiB total.

Kevin Windrem avatar image Kevin Windrem commented Ā·

I had to make a change to systemcalc to solve a similar issue in GuiMods. The issue is /Dc/0/Power goes invalid for Wakespeed when it is stopped. The stock systemcalc code does not include the value in /Dc/Alternator/Power. I changed this so if the device exists, a power of 0 is used when /Dc/0/Power is not valid.

I would agree that device summary tiles should remain visible on the overview even if all devices previously reporting values don't exist any longer. The current gui-v2 behavior hides a fairly serious system fault by removing devices that previously reported values from the overview page. Users need to know a device is no longer responding and the tile going away isn't something that many users will identify as a fault.

2 Likes 2 Ā·
penfold1970 avatar image
penfold1970 answered Ā·

I'm running Cerbo GX and after updating to beta then reverting back to 3.31 remote console no longer works when away from home but works fine locally.

2 |3000

Up to 8 attachments (including images) can be used with a maximum of 190.8 MiB each and 286.6 MiB total.

andreas-siebenmorgen avatar image
andreas-siebenmorgen answered Ā·

It looks like DVCC is not working.

I've set it to 53.3V, but my MPPTs are still charging to the locally defined setpoint.

I am using a Lynx shunt with my battery, no Can-bus BMS. No ESS.


1714983571127.png

1714983855397.png


1714983760163.png


1714983571127.png (68.4 KiB)
1714983760163.png (68.7 KiB)
1714983855397.png (37.1 KiB)
2 comments
2 |3000

Up to 8 attachments (including images) can be used with a maximum of 190.8 MiB each and 286.6 MiB total.

Hi Andreas,


That is the correct behaviour. This limit only applies if there is a managed (verwalteten) battery in the system, in other words, one that supplies a charge voltage.

The purpose of this feature is to work around problems with batteries that requests a voltage that is too high, or sometimes brand new batteries needs some time to properly top-balance, which requires charging them to a lower voltage for the first few weeks.

Since you have no CAN-bms, there is no managed battery to limit. Please set the desired charge voltage on the MPPT with VictronConnect.

0 Likes 0 Ā·
andreas-siebenmorgen avatar image andreas-siebenmorgen Izak (Victron Energy Staff) ā™¦ā™¦ commented Ā·

Thanks for the clarification Izak.

The dokumentation could be more precise that DVCC max. voltage is not used with ā€žnon smartā€œ batteries.

0 Likes 0 Ā·
ojack avatar image
ojack answered Ā·

I just installed v3.40~13.
Very cool that the color of the graphs on the grid now changes from blue for consumption to green for feed-in!
But the length of the graphs is not yet consistent. In the screenshots below, L1 is the longest line, but the smallest value regardless of whether it is green or blue. Conversely, L3 is the shortest line with the largest measured value.
Could you perhaps put zero in the middle and have the graphs for feed-in point downwards and consumption point upwards?

1715003078026.png


1715003078026.png (143.3 KiB)
8 comments
2 |3000

Up to 8 attachments (including images) can be used with a maximum of 190.8 MiB each and 286.6 MiB total.

ojack avatar image ojack commented Ā·

Same here. The larger the value, the smaller the graph.

1715003263093.png

0 Likes 0 Ā·
1715003263093.png (20.7 KiB)
ojack avatar image ojack commented Ā·

For the loads it's correct. Larger value is longer graph

1715003425674.png


0 Likes 0 Ā·
1715003425674.png (12.2 KiB)
Kevin Windrem avatar image Kevin Windrem commented Ā·
Having a zero point with consumption and feed-in grow in opposite directions is what I did in GuiMods. I think showing both in the same direction (but with different colors) is confusing. Plus as seen in one picture, L 2 & 3 have consumption while L1 is feeding in but there's only one direction arrow.


In the screen shots, I see two different mechanisms for showing multiple phases. The brief page is showing gauges side by side while the overview tile is showing them stacked. Side by side is much more readable. In the stacked version it's difficult to separate the gauges.

0 Likes 0 Ā·
ojack avatar image ojack Kevin Windrem commented Ā·

The most confusing thing is that for feed-in it seems that the non-'lit' part of the graph shows the value.

0 Likes 0 Ā·
Kevin Windrem avatar image Kevin Windrem ojack commented Ā·
That is extremely confusing! If you don't want to take space for feed-in below consumption, why not grow the "lit" section from the top rather than the bottom?
0 Likes 0 Ā·
ojack avatar image ojack Kevin Windrem commented Ā·

Growing the 'lid' section from top to bottom when feeding in and from bottom to top when buying from grid would be easy to understand I think. Good Idea! The only problem may occur if one phase is feeding in and another phase is buying at the same time? I'm not sure if this would be confusing again?

But I would like to see this in another coming beta and for sure I would comment it then ;-)

0 Likes 0 Ā·
Kevin Windrem avatar image Kevin Windrem ojack commented Ā·
In my opinion, the best approach is to establish a zero point and grow consumption in one direction and feed-in in the other.

In GuiMods, I ended up adding labels at the ends of the gauges to show the actual direction: C for consuming power, S for supplying power This was requested because positive numbers are not always for suppling power: Loads are a positive number even though they are consuming power and really should be a negative number. The Victron ecosystem attempts to eliminate negative numbers completely and I'd agree a negative number for a load is technically correct but confusing if you don't have a mathematical background. Negative numbers are still used: negative for AC in for feed-in, negative for battery when consuming...

0 Likes 0 Ā·
ojack avatar image ojack Kevin Windrem commented Ā·
I completely agree with you. A zero point would be best. I also think that there should be at least a rough scale. So at least a negative final value, 0 and a positive final value. Then you can do something with the magnitude of the graph without overloading the diagram with details. Depending on the systems specs the '0' needs not to be the middle if for example maximum consumption peak is much higher then maximum feed-in.

And for me the scale should not be dynamic because if the scale is dynamic you can't get an idea of the value with only one short view.

0 Likes 0 Ā·
ojack avatar image
ojack answered Ā·

I discovered another bug in GUI V2.
On the DVCC page it's displayed automatically set 'none', although in reality and in GUI V1 'Pylontech Battery' is correctly set and displayed.

1715065300149.png


1715065300149.png (86.5 KiB)
2 |3000

Up to 8 attachments (including images) can be used with a maximum of 190.8 MiB each and 286.6 MiB total.

ojack avatar image
ojack answered Ā·

Small translation error.
Autorange for measured value scaling is not ā€œAutoreichweiteā€ in German but ā€œAutoskalierungā€.

2 |3000

Up to 8 attachments (including images) can be used with a maximum of 190.8 MiB each and 286.6 MiB total.

ojack avatar image
ojack answered Ā·

Maybe a 'copy and paste' error in translation.

If you click the Reset range values button, a message ā€œReset access pointā€ appears in german.

1715065926598.png


1715065926598.png (48.3 KiB)
2 |3000

Up to 8 attachments (including images) can be used with a maximum of 190.8 MiB each and 286.6 MiB total.

ojack avatar image
ojack answered Ā·

No units are mentioned on the Minimum and Maximum Ranges page.

And Units apparently used in different ways? And why so many decimal places?

1715067360621.png

And some are called 'power' and others are called 'current'. That's confusing.

1715067568240.png


1715067360621.png (141.0 KiB)
1715067568240.png (34.6 KiB)
3 comments
2 |3000

Up to 8 attachments (including images) can be used with a maximum of 190.8 MiB each and 286.6 MiB total.

jpetrell avatar image jpetrell commented Ā·
Thanks! The units and precision is currently being fixed.
0 Likes 0 Ā·
ojack avatar image ojack jpetrell commented Ā·

No it's not fixed. The issue I described is at v3.40~13. And there is no newer version available yet.

Edit: sorry I might missunderstood. Are you part of the developing team and you wanted to say that it'll be fixed in the next beta?

0 Likes 0 Ā·
jpetrell avatar image jpetrell ojack commented Ā·

> Are you part of the developing team and you wanted to say that it'll be fixed in the next beta?

Yeah we are looking into it. Hopefully makes to the next beta.

1 Like 1 Ā·
pwfarnell avatar image
pwfarnell answered Ā·

V3.40~13 is still throwing a few inconsistent bar charts for the levels on both web view and the Cerbo touch 50 but improved from ~8.

screenshot-20240507-074405-kindlephoto-594162287.png

20240507-073947.jpg


2 |3000

Up to 8 attachments (including images) can be used with a maximum of 190.8 MiB each and 286.6 MiB total.

cc5084 avatar image
cc5084 answered Ā·

One new thing that I noticed compared to the current version is that it will show its own block for the alternator charging to the battery that is being monitored.

My question is this. Is this somehow autodetected as charge being put into the system from the DC load or does this require a victron orion XS in order to have this block operate as intended?

If no orion XS is needed, are there any special things that need to be done to monitor the alternator charge on the battery?

2 comments
2 |3000

Up to 8 attachments (including images) can be used with a maximum of 190.8 MiB each and 286.6 MiB total.

pwfarnell avatar image pwfarnell commented Ā·
If you have a Wakespeed WS500or a Zeus alternator controller connected by V Can to the GX device, these now have their own input box.
1 Like 1 Ā·
Kevin Windrem avatar image Kevin Windrem commented Ā·
The Orion XS can be connected to the GX device vis VE.Direct cable. Other chargers can not so will not show on gui-v2.

A smart shunt programmed as an alternator or DC-DC charger will report info to the GX device but again gui-v1 will not show the information on the flow page.

GuiMods does provide a flow page (DC Coupled) that will show it on the flow page for gui-v1. But GuiMods will not display that information on the simple flow overview page.

0 Likes 0 Ā·
tobe91 avatar image
tobe91 answered Ā·

Hello,

I have four questions/improvements:

1 Question)

I just updated my RPI4 from VenusOS 2.92 to the newest v3.40~13. I tried the new GUI via Remote Console http://[IP]/gui-beta. Works fine. Going to my RPI4 with it's 5,5" display and try to enable the new GUI, but under Settings -> Display&Language there is no selection for Display UI.. When I try the same via Remote Console under http://[IP]/gui-beta I have the possibility to select it. So I'm currently not able to enable the new GUI on my screen in the camper van. Did I miss there something?


2 Improvement)

I would propose an improvement. I have two tank sensors for fresh and waste water attached and two Ruuvi sensors (one inside, one outside of the van) via bluetooth. When I go to the overview page on the beta GUI via Remote Console there are charts for Battery, Fresh and Waste Water. Currently I don't see a possibility to get the temperature information on the overview page visualized or? Would it be possible to add the displaying of the temperatur information there?

If I go to the Levels tab, there I have the information regarding temperatur available.

Under Settings -> Display&Language -> Brief view levels there is also no option to add temperature sensors.

This was really nice with GuiMods before, to have a nice overview for two tank and two temperatur information.


3 Improvement)

Selecting the Multiplus II inverter mode or Shore current limit is somehow much more of an effort than before with GuiMods. I have to press 4 times compared to before just 2 times.

Before: Click on Multiplus Icon -> Select Inverter Mode -> done

Beta GUI: Click on Multiplus Icon or Icon in the upper left -> Click on the current Mode -> Select the Mode -> Click on the Set -> done

Regarding the statement that the Beta GUI is more touch screen friendly I find this much more touch "unfriendly" than before with GuiMods.


4 Improvement)

The Brief view levels are looking really cool, but I find them to be not to practical in the respect that the information beside the bars, e.g. Battery 96% is way to small especially if you are using it on some small display, e.g. 5" screen. The Solar yield or Loads information is much more present and prominent to be read than the others. Sometimes a little bit less fancy things, are much more user friendly :-) For sure I can go to the other tabs to see more information, but I like it simple.

Nevertheless thank you for this nice work, it really looks sick and has potential to be much more user friendly than before.

Thanks, Tobias

2 |3000

Up to 8 attachments (including images) can be used with a maximum of 190.8 MiB each and 286.6 MiB total.

dutchsolarfreak avatar image
dutchsolarfreak answered Ā·

Since the gui-beta scales nicely I have a request.

Is it possible to open the gui-beta (by url) directly in the overview page instead of brief page?

Maybe something like http://192.168.2.100/gui-beta/#overview

I am using the gui-beta URL embedded in my home assistant and I would like to see the overview page by default instead of the brief page.

2 |3000

Up to 8 attachments (including images) can be used with a maximum of 190.8 MiB each and 286.6 MiB total.

Kevin Windrem avatar image
Kevin Windrem answered Ā·

gui-v2 dialog that selects inverter mode is showing Charger only and Inverter only grayed out and not selectable. The only selections permitted are off and on.

This problem was reported fairly early in gui-v2 beta testing but still exists in the version included in v3.40~13.

My system uses a Multi Compact 120v unit. All 4 selections are shown and function in gui-v1 and also in GuiMods. Tested this without any third party mods just to be sure there is no interaction.

I've noticed this problem in gui-v2 both locally and on a computer calling up the WASM version.

Can I get some acknowledgement that this is being worked on please?

1 comment
2 |3000

Up to 8 attachments (including images) can be used with a maximum of 190.8 MiB each and 286.6 MiB total.

jpetrell avatar image jpetrell commented Ā·

Thanks. Yeah looks like accidental omission. We will check.

0 Likes 0 Ā·
thomasw-1 avatar image
thomasw-1 answered Ā·

I like to raise the suspicion that since addition of Dynamic ESS feature in GX the setgrid support does not work that good anymore than it was before. During a day with sufficient PV production and battery supply now I have a grid usage of min 4kWh (sometimes even up to 7kWh), whereas before it was between 0,1kWh and 0,5kWh!
Settings on my side have not changed.
During daytime setgrid ist set to -60W, during night to -20W.

Example now
You see that there was sufficient PV supply even allowing P2H usage. Don't be detracted by SOC. I limit typcially max charge SOC at 80%.

System overview graph

1715254194198.png

Grid consumotion graph:

1715254364942.png


Example before Dynamic ESS
In that case similar pattern, but grid usage is typically between 0,1kWh and 0,5kWh per day, in fact 10-times higher

System overview graph

1715254526453.png

Grid consumotion graph:

1715254628250.png


I would appreciate, if you coudl return your algorithms back to the accuracy, they had before!


1715254194198.png (96.1 KiB)
1715254364942.png (19.5 KiB)
1715254526453.png (93.4 KiB)
1715254628250.png (32.4 KiB)
4 comments
2 |3000

Up to 8 attachments (including images) can be used with a maximum of 190.8 MiB each and 286.6 MiB total.

ojack avatar image ojack commented Ā·
Is it Green mode or Trade mode?
0 Likes 0 Ā·
thomasw-1 avatar image thomasw-1 ojack commented Ā·

Dynamic ESS is not used/activated

0 Likes 0 Ā·
ojack avatar image ojack thomasw-1 commented Ā·

Ok, that's strange. I can't see any difference if DESS is not active at my system. Have you tried rebooting?

0 Likes 0 Ā·
thomasw-1 avatar image thomasw-1 commented Ā·
I downgraded to version 3.14 and will report about changes on Sunday night.
0 Likes 0 Ā·
elrubio avatar image
elrubio answered Ā·

I have installed a new sensor for water using a Tank GX 140. Under I/O Devices Analog I can switch on and off the channels of the Tank GX but there is no automatic saving of the adjustment. At the end I can not switch on or off a channel from the Tank GX 140. As a work around I did reboot the Cerbo GX under version 3.31 and make the adjustment without problems.

2 |3000

Up to 8 attachments (including images) can be used with a maximum of 190.8 MiB each and 286.6 MiB total.

dutchsolarfreak avatar image
dutchsolarfreak answered Ā·

I am running firmware 3.140~13 and VRM DESS in trade mode.

I noticed a DANGEROUS issue!

DESS sometimes doesn't not obey/respect the ESS max discharge/discharge power settings!

Today I set the ESS max charge and max discharge values using two node red flows.

The reason for this is the humming noise of the MP during nighttime

  • One flow for daytime (both max discharge and charge settings to 2400) 8:00~21:00
  • One flow for nighttime (both max discharge and charge settings to 1000) 21:00~8:00

In the next figure (AC-Input Power) you can see that it sometimes exceeds (with >3500W) the 2400W several times during daytime.

1715326560117.png

I have a energy meter at the ac-in side of the MP and this meter shows the same results.

When I disable DESS and run ESS only I don't see this behavior. The limits are obeyed.

I have a few questions:

  1. Does anybody experience the same behavior?
  2. I assume the 3500W peeks are coming from the AC-Input limit of 16A (in my case) Could somebody from victron confirm this?

Thanks for any feedback


1715326560117.png (35.0 KiB)
1 comment
2 |3000

Up to 8 attachments (including images) can be used with a maximum of 190.8 MiB each and 286.6 MiB total.

@Dirk-Jan Faber (Victron Energy)

Could you please confirm if it's normal (or a bug) that DESS AC charges/discharges with higher values than ESS AC charge/discarge limits?

It seems to occur only when DESS tries to catch up to get target hour SOC

0 Likes 0 Ā·
Tony avatar image
Tony answered Ā·

I have a 500A smart shunt, connected to a Cerbo GX, configured as a DC Energy Meter. This shunt is monitoring the output of my solar charger. When I look at the history in the GUI-v2 there appears to be no data. If I monitor the shunt in VRM the shunt appears to be showing the correct live readings.


screenshot-20240510-2223192.png


Has anyone else come across the same issue?


2 |3000

Up to 8 attachments (including images) can be used with a maximum of 190.8 MiB each and 286.6 MiB total.

Lars Filusch avatar image
Lars Filusch answered Ā·

I have connected a smartshunt and a 123BMS, and although the smartshunt is selected as the battery monitor in the system settings, the information from the 123BMS is used, which is clearly visible because the SOC is different.

2 |3000

Up to 8 attachments (including images) can be used with a maximum of 190.8 MiB each and 286.6 MiB total.

Related Resources