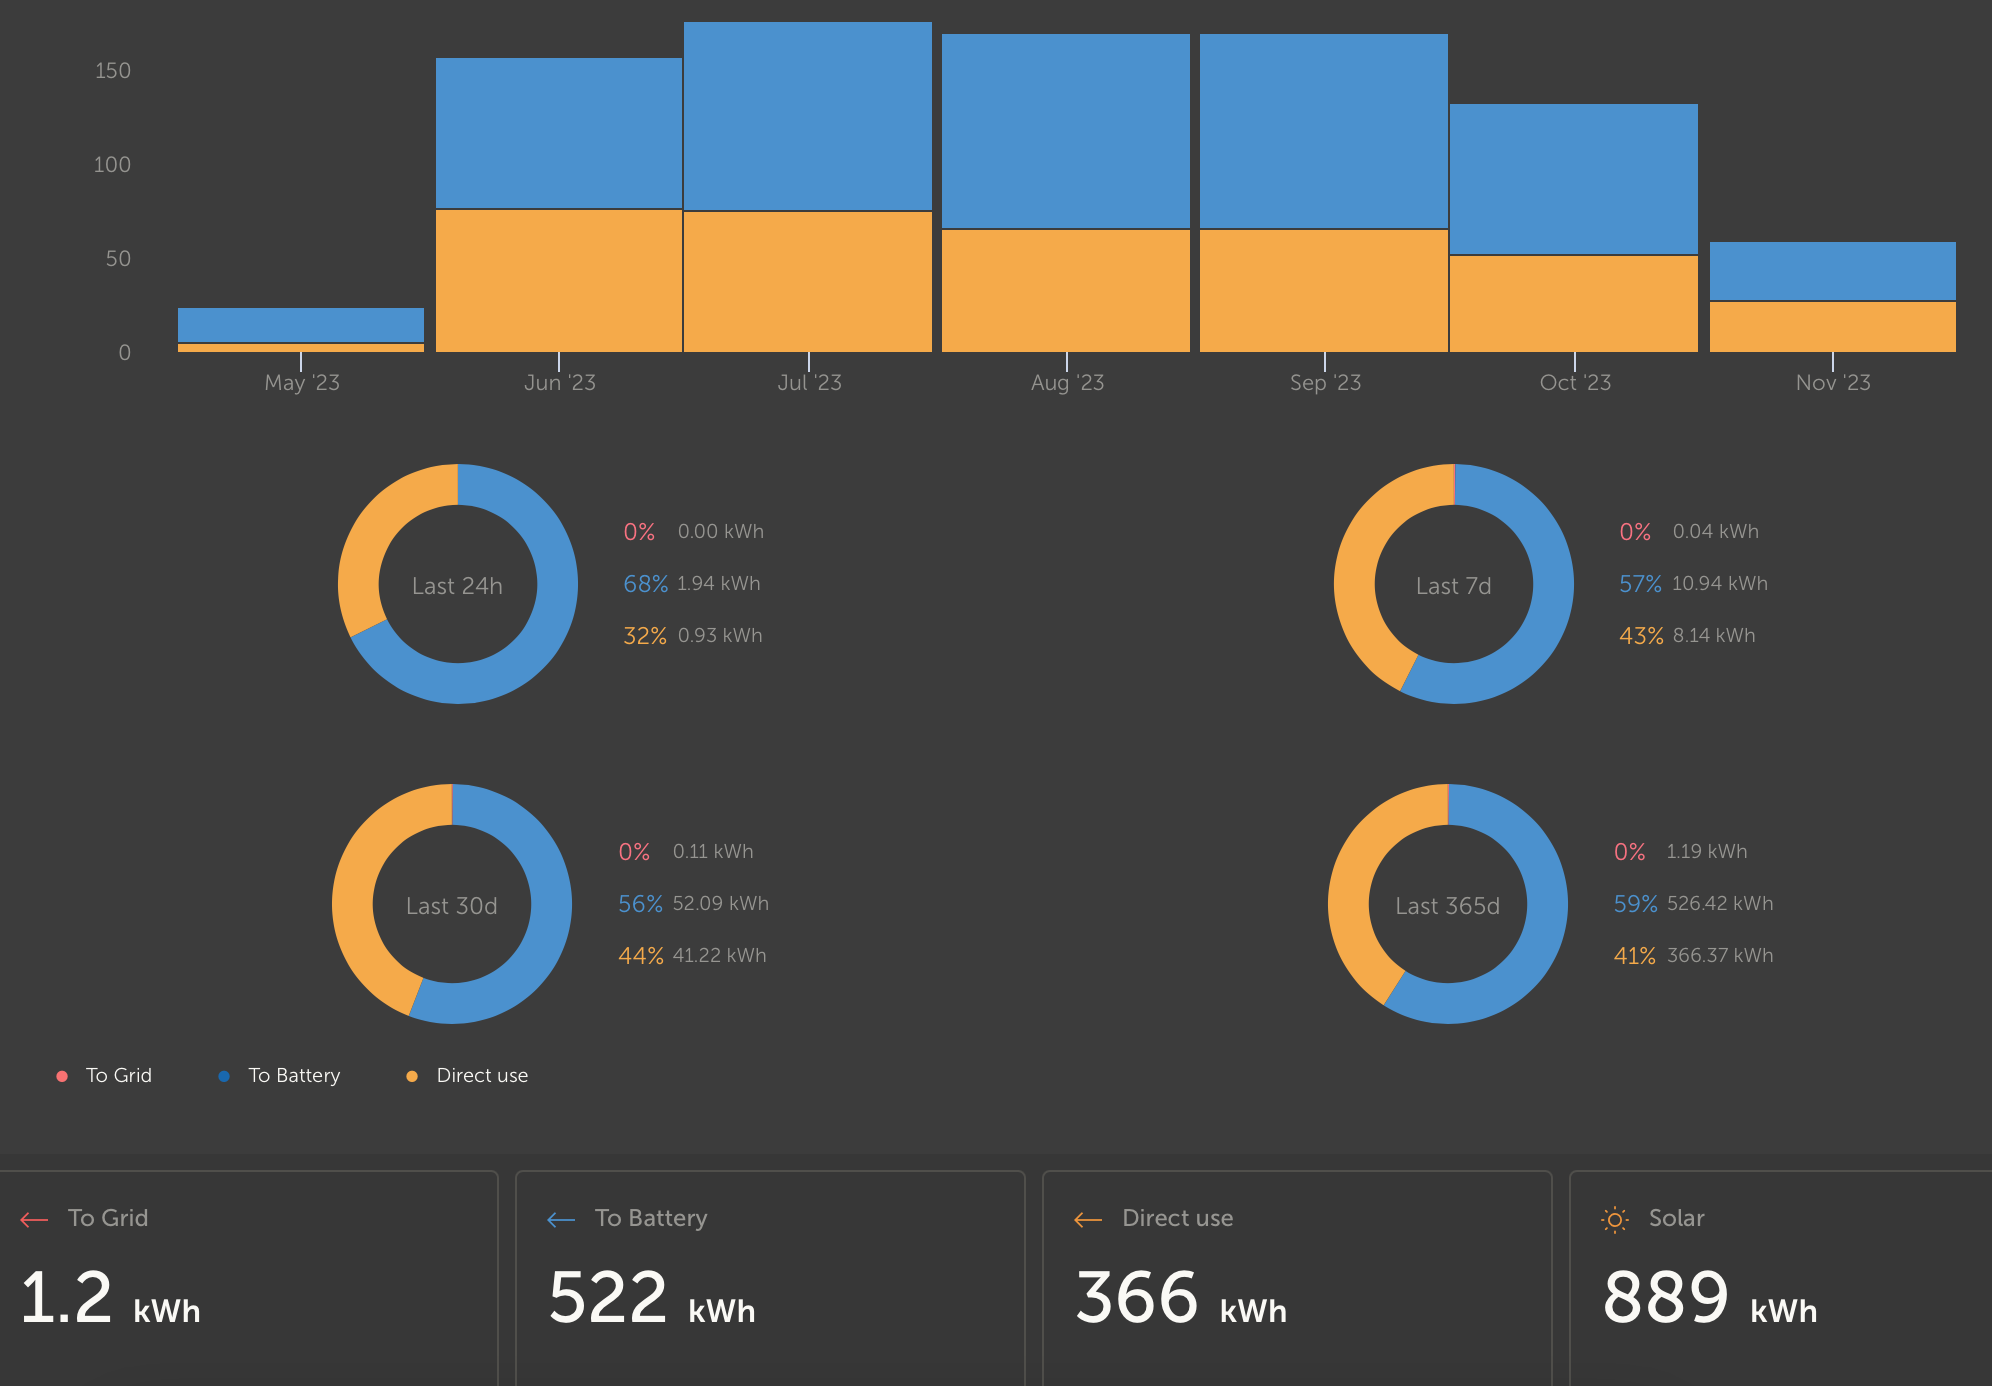
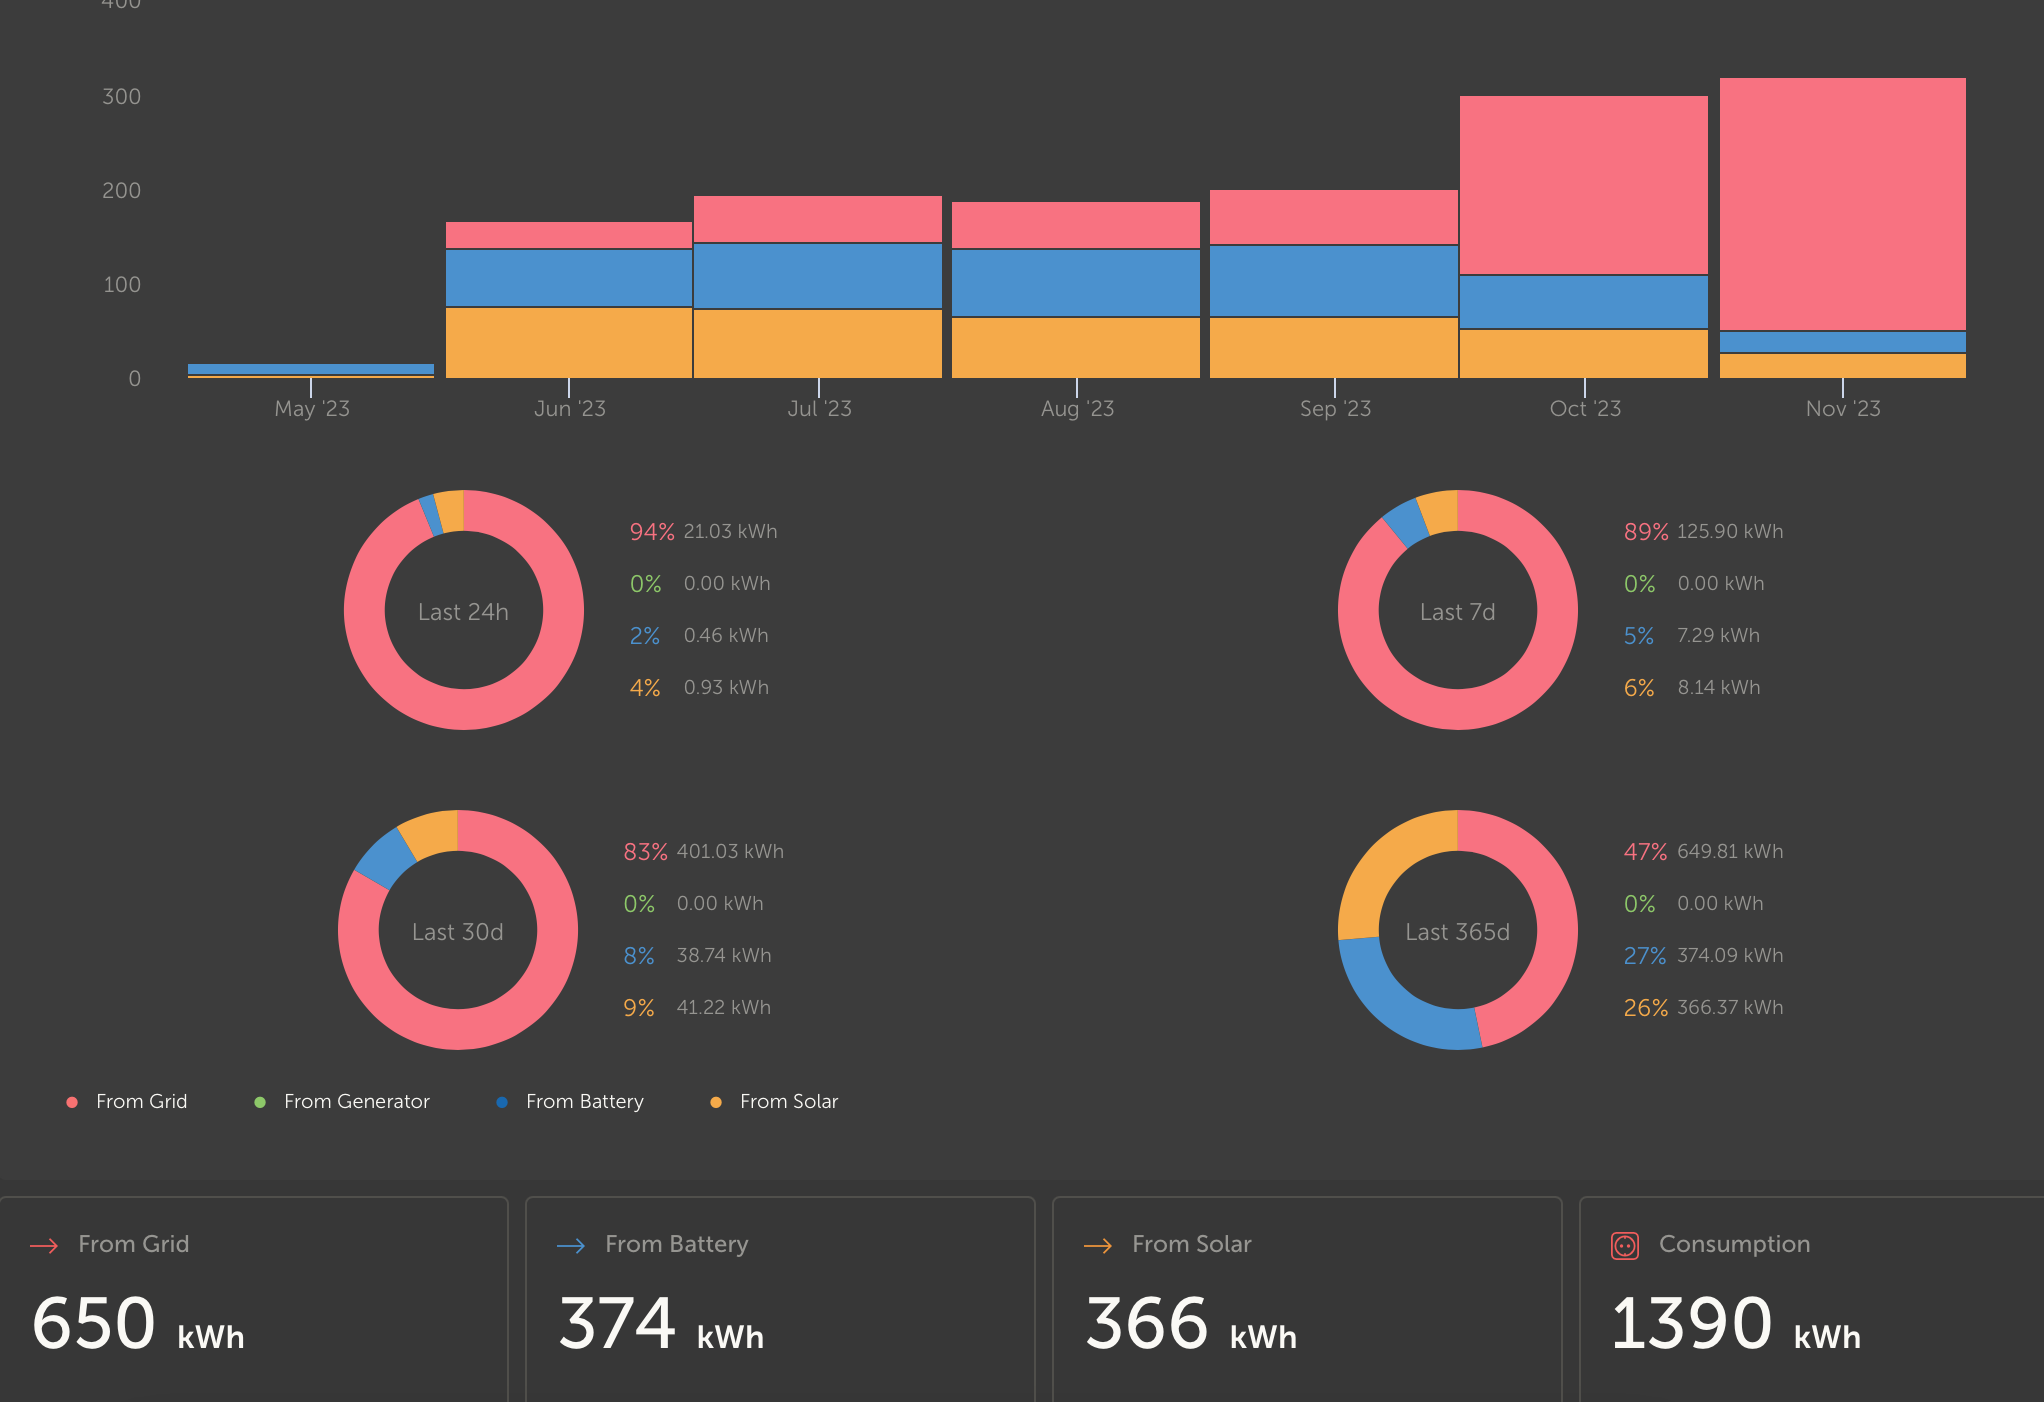
If I look to my statistics in VRM on 30 days there is a big difference between how many power that comes from or go’s to the battery. In my opinion this difference can only be as large as my battery size.
setup: multiplus II go 48/5000 , 6 x Pylontech 2000 battery and a mppt 450/100
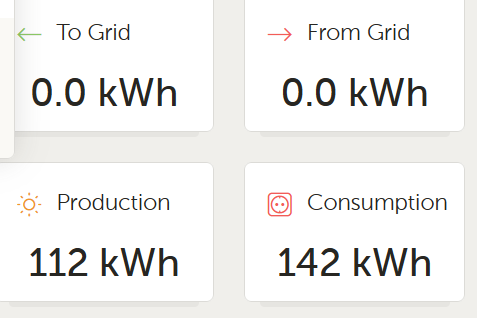
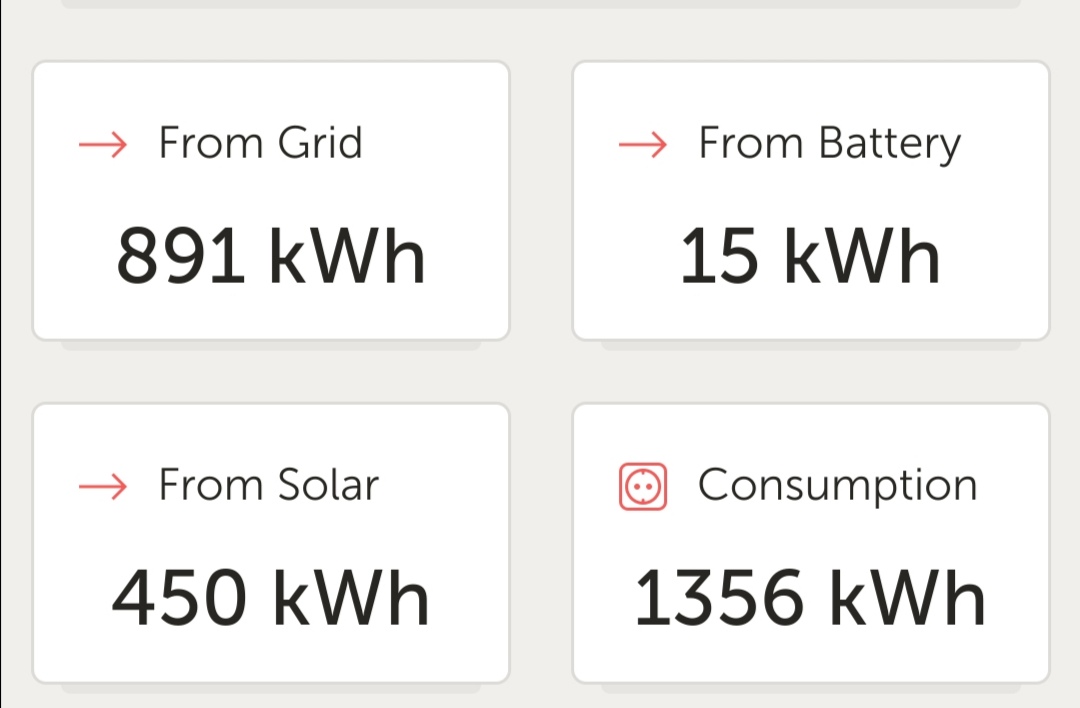
Consumption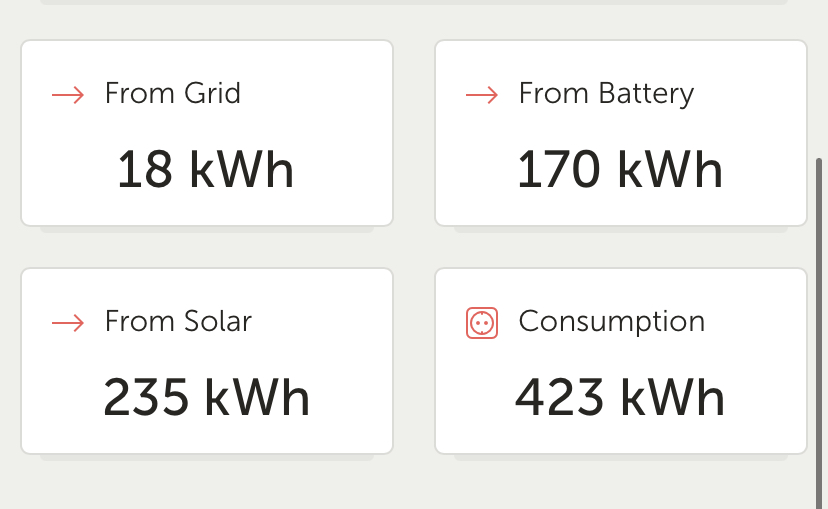
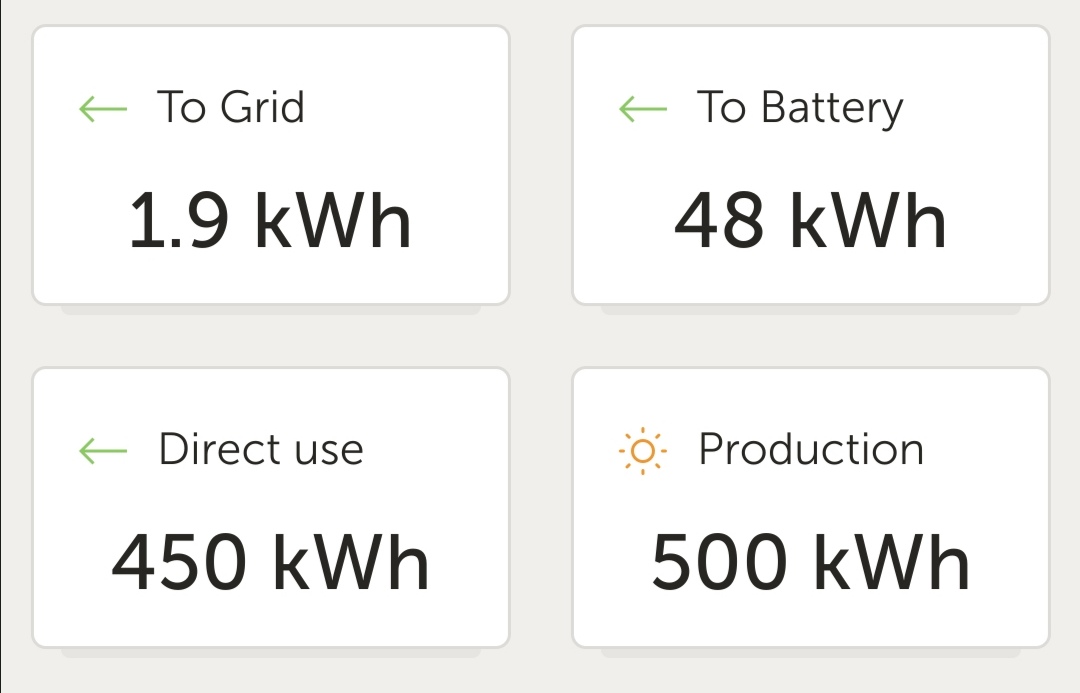
Solar:
if you look at the from solar and direct use there are the same