question

Finlay Knops-Mckim avatar image
Finlay Knops-Mckim asked

Ignore "load" current on SmartSolar 75/15 to measure solar yield

I'm looking to evaluate the output of a solar setup using an SmartSolar MPPT 17/15. The setup currently uses a 12V lead acid battery with a DC fan on the "load" output. The SmartSolar is set to turn the fan on at a high battery voltage threshold, and turn it off when a low threshold is reached.

This ideally means the solar panels are always being driven in MPPT mode, allowing recording of max power throughout the day.

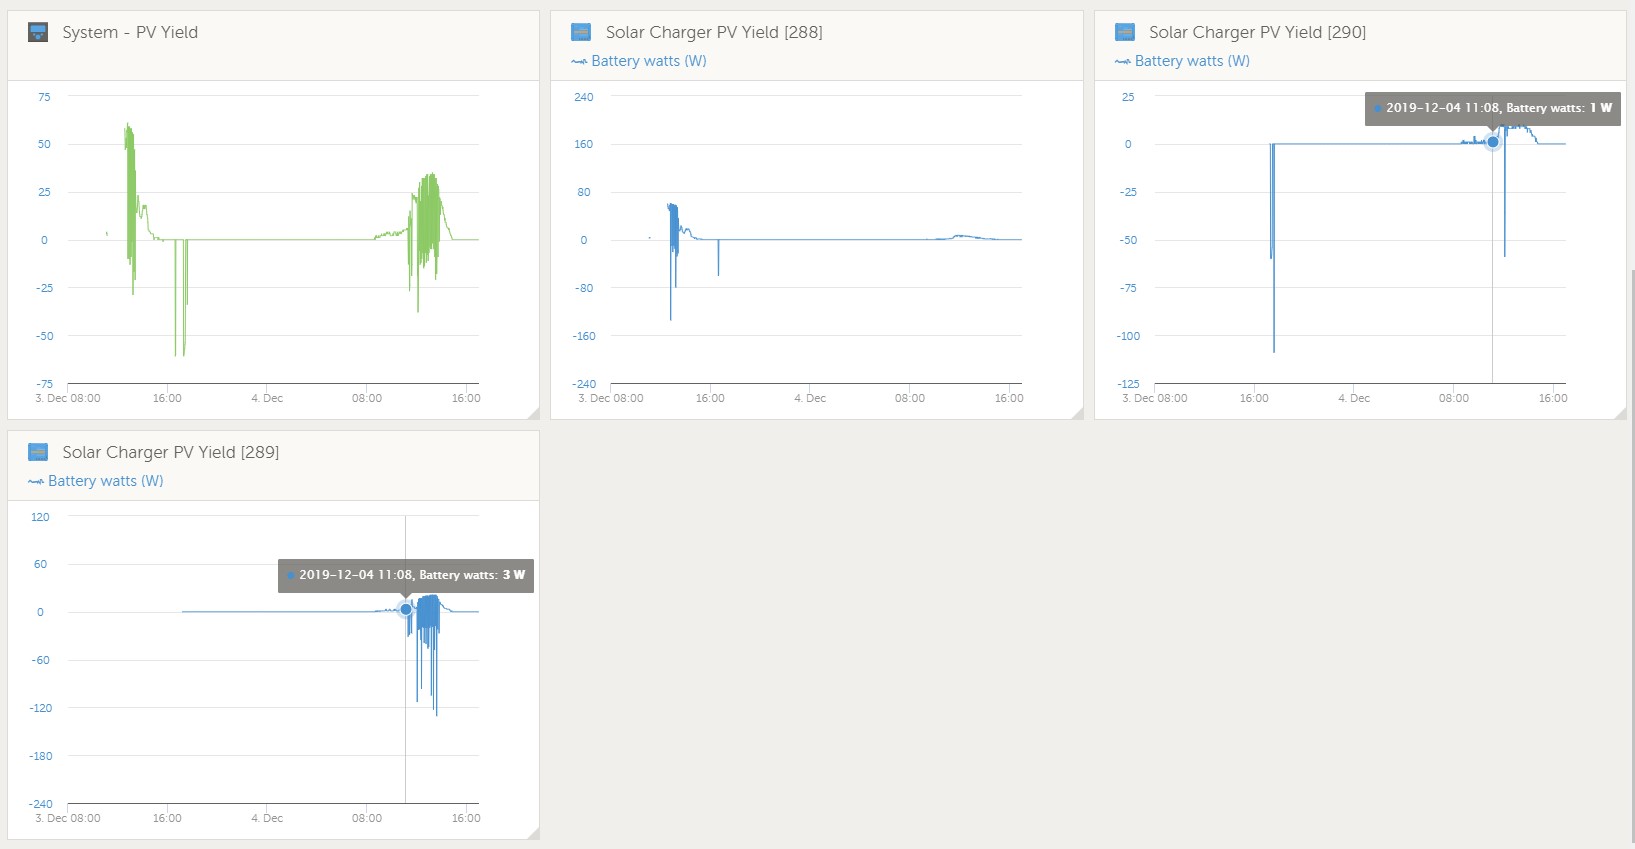
However, when monitoring this system in VRM the periods when the fan is running show a negative solar yield - with mention of "battery watts" I assume yield is being taken from the current flowing in/out of the battery.

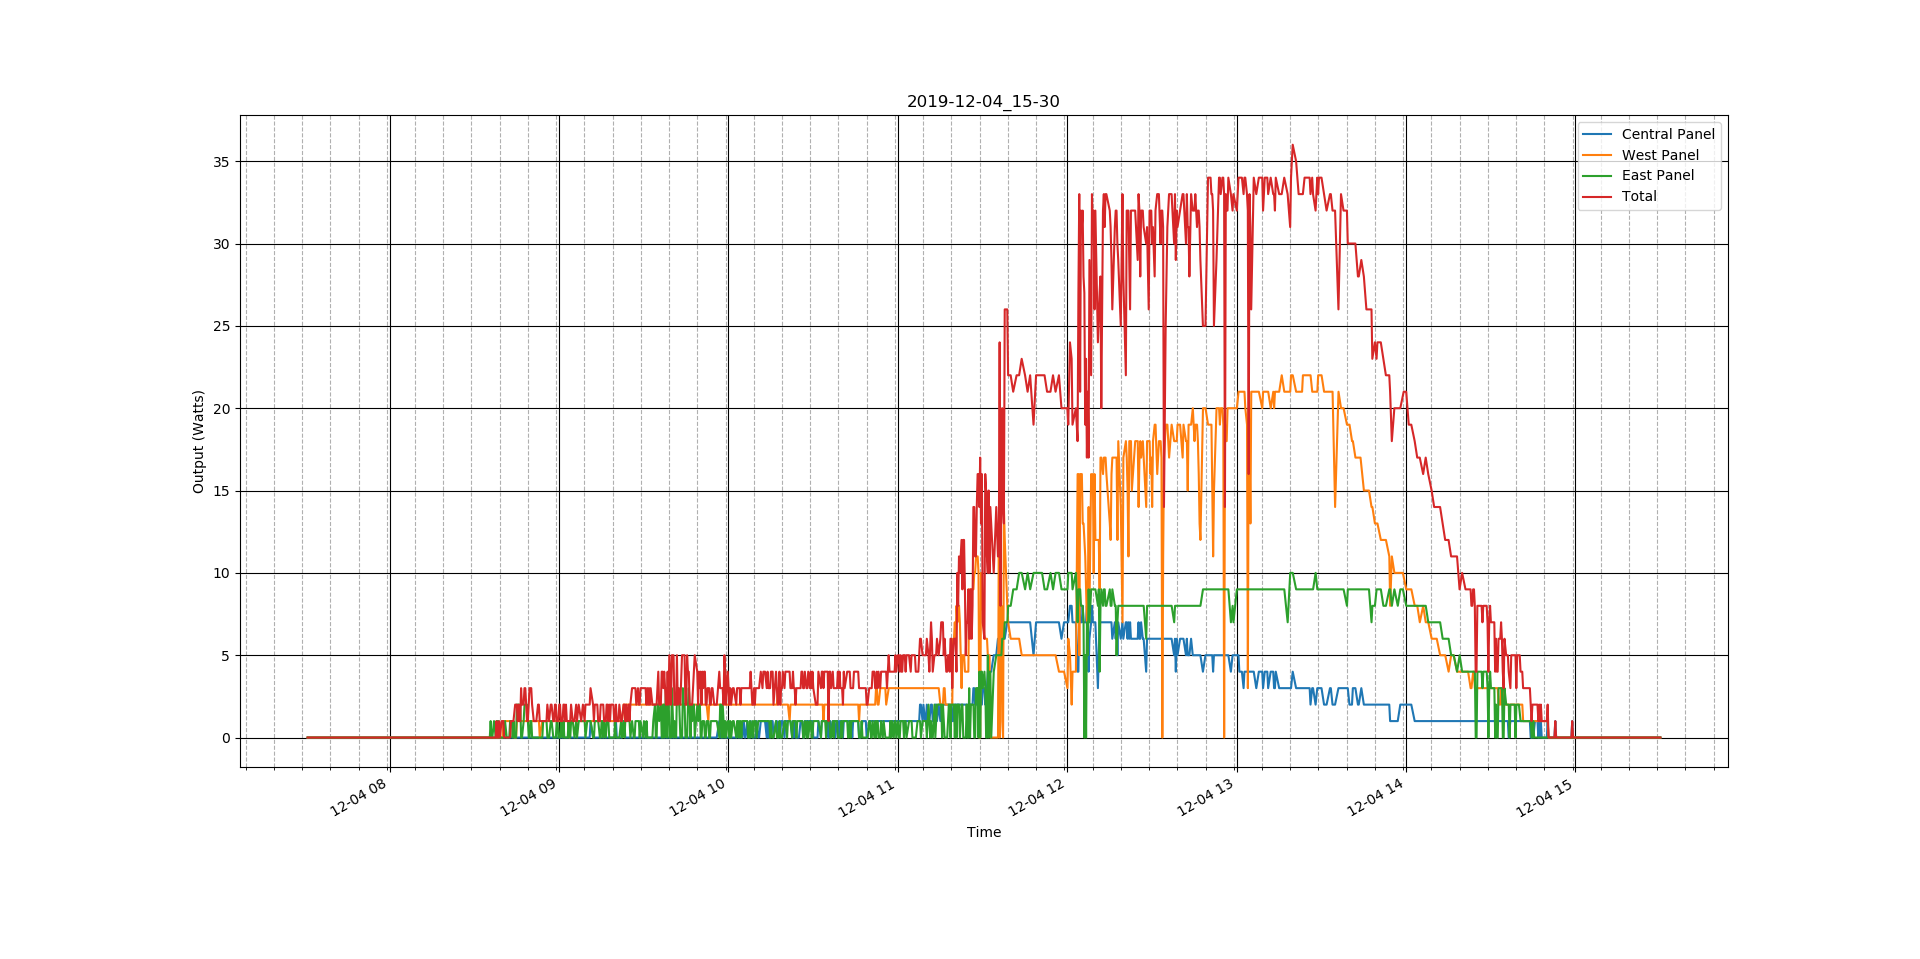
The "Solar Charger PV Voltage and Current" widget appears to have the correct data as both readings remain positive, but is there anyway to translate this graph into PV power output and graph it?

VRMchargermonitoring
2 |3000

Up to 8 attachments (including images) can be used with a maximum of 190.8 MiB each and 286.6 MiB total.

1 Answer
Finlay Knops-Mckim avatar image
Finlay Knops-Mckim answered ·

One thing to add, if this isn't currently possible, could a widget that simply multiplies PV current and voltage together be added to VRM? Hopefully a fairly quick addition.

7 comments
2 |3000

Up to 8 attachments (including images) can be used with a maximum of 190.8 MiB each and 286.6 MiB total.

Hi @Finlay Knops-Mckim

There already is: 'Solar Charger PV Yield'

0 Likes 0 ·
Finlay Knops-Mckim avatar image Finlay Knops-Mckim Daniël Boekel (Victron Energy Staff) ♦♦ commented ·

Hi Daniel - I thought this, but "Solar Charger PV Yield" goes negative if the load is enabled. It seems that is is using measurements from the battery, not the panels - see image below. In fact the graph specifically mentions battery watts, not panel watts.

That said, if I pull out the "PV Power" values from the API using python, I do get a valid graph. I think the widget might just be referencing the incorrect API value as the panels should never be producing negative power.

0 Likes 0 ·
Daniël Boekel (Victron Energy Staff) avatar image Daniël Boekel (Victron Energy Staff) ♦♦ Finlay Knops-Mckim commented ·

Hi @Finlay Knops-Mckim

interesting!

Maybe @Teun Lassche (Victron Energy Staff) knows more?

The combination of using a load-output and GX device / VRM is not an often used one I think :)

0 Likes 0 ·
Finlay Knops-Mckim avatar image Finlay Knops-Mckim Daniël Boekel (Victron Energy Staff) ♦♦ commented ·

That's understandable, this is very much a test-rig as opposed to a practical generating setup - it is using a Raspberry Pi with the Venus software installed on it as opposed to a proper GX device. Don't know if that would make a difference or not - I'd assume this was a quirk of the front end of VRM just pulling the wrong dataset out for that graph.

@Teun Lassche (Victron Energy Staff) is this something that would be fixable in VRM? I assume the widgets are chart.js or similar so should be fairly quick to tweak if necessary?

0 Likes 0 ·
Teun Lassche avatar image Teun Lassche ♦ Finlay Knops-Mckim commented ·

@Finlay Knops-Mckim I'll check it for you (we have to check your specific usecase and all other possible usecases, so might take some time)

0 Likes 0 ·
Teun Lassche avatar image Teun Lassche ♦ Teun Lassche ♦ commented ·

Quick update: we are checking it, but it might takes some time, will try to keep you posted.

0 Likes 0 ·
Finlay Knops-Mckim avatar image Finlay Knops-Mckim Teun Lassche ♦ commented ·

Hi Teun - thanks for looking into this - did you ever get anywhere with implementing a fix?

0 Likes 0 ·

Related Resources