question

mryoshii avatar image
mryoshii asked

Komische PV Kurve

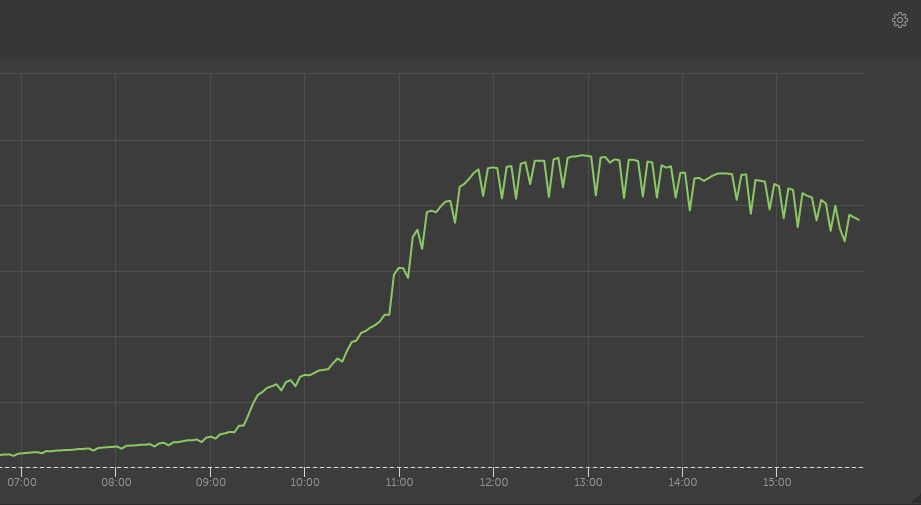
Hallo habe eine frage zu meiner PV leistungs kurve. Ist es normal das hier lie leistung so schankt? Es sind keine wolken am himmel. Ich habe einen 150/70 und dieser gurkt bei ca 1400Watt rum. Es ist ein 24V System und der MPPT ist mit 2200Wp bestückt.

Wenn Ihr mehr infos braucht sagt bescheid.


Grüße

1656338194147.png

MPPT Controllers
1656338194147.png (33.3 KiB)
2 |3000

Up to 8 attachments (including images) can be used with a maximum of 190.8 MiB each and 286.6 MiB total.

3 Answers
Stefanie (Victron Energy Staff) avatar image
Stefanie (Victron Energy Staff) answered ·

@MrYoshii

Wenn Sie die Spitzen nach unten meinen, ja, das ist normal. Ca. alle 10 Minuten wird erneut nach dem besten MPP "getrackt".

2 |3000

Up to 8 attachments (including images) can be used with a maximum of 190.8 MiB each and 286.6 MiB total.

mryoshii avatar image
mryoshii answered ·

ok das meinte ich danke.

Die frage ist jetzt noch warum ich von denn 2200Wp nur ca 1400 raus bekomme.

2 |3000

Up to 8 attachments (including images) can be used with a maximum of 190.8 MiB each and 286.6 MiB total.

holger Bleckwehl avatar image
holger Bleckwehl answered ·

Liegt am Aufstellwinkel der Module... volle Leistung nur bei senkrechtem Lichteinfall...

bei meiner (2,8 kWp) zur Zeit max. 2.2 kW. 35° Installation

2 comments
2 |3000

Up to 8 attachments (including images) can be used with a maximum of 190.8 MiB each and 286.6 MiB total.

mryoshii avatar image mryoshii commented ·
ok danke für die info
0 Likes 0 ·
Matthias Lange - DE avatar image Matthias Lange - DE ♦ mryoshii commented ·
Die Angaben im Datenblatt werden bei bestimmten Testbedingungen ermittelt. Einer dieser Werte ist 25°C Modultemperatur, das hat man aber eher selten im Sommer bei voller Sonne.

Mit steigender Modultemperatur sinkt die Leistung.

0 Likes 0 ·